

Abstract
To investigate useful biomarkers associated with proximal tubular injury, we assessed changes in levels of a focused set of biomarkers in urine and blood. Male rats administered a single dose or four doses of gentamicin (GM, 240 mg/kg/day) or a single dose of cisplatin (CDDP, 5 mg/kg) were euthanized on days 2 (the day after initial dosing) 5, or 12. At each time point, histopathological examination of the kidney and immunohistochemistry for biomarkers, kidney injury molecule-1 (Kim-1), lipocalin (NGAL), clusterin (CLU), cystatin C (CysC) and β2-microglobulin (β2M) were performed. Biomarker levels were measured in urine and blood. In both treatment groups, degenerated/necrotic proximal tubules and regenerated tubules were mainly observed on days 5 and 12, respectively. At the same time as these tubular injuries, urinary Kim-1, CysC and β2M levels were increased. Moreover, urinary levels of CysC and β2M in GM-treated animals and Kim-1 in CDDP-treated animals increased (on day 2) prior to tubular injury on day 5. This was considered to reflect the characteristics of drug toxicity. Although almost all of the biomarkers in blood were not sufficiently sensitive to detect proximal tubular injury, urinary and plasma β2M levels simultaneously increased. Therefore, in addition to urinary Kim-1, CysC and β2M levels, plasma β2M levels were also considered useful for detecting proximal tubular injury.
Keywords: kidney, proximal tubular injury, biomarker, gentamicin, cisplatin, immunohistochemistry
Introduction
Renal injury can be fatal, making the kidney a major target organ for drug research and development. Drug-induced renal injury represents one of the primary causes of drug failure or adverse drug reactions (approximately 21%) in late-stage development1, 2. Therefore, early detection of nephrotoxicity is important for determining the safety of drug candidates. Blood urea nitrogen (BUN) and creatinine (CRE) are the most commonly used markers for detecting nephrotoxicity in traditional clinical pathology. However, these markers are not very specific or sensitive, as there is usually a significant loss of renal function before BUN and CRE levels increase3.
Several renal injury biomarkers that are more specific and sensitive than BUN or CRE have already been reported. Regulatory authorities have judged 8 biomarkers—β2-microglobulin (β2M), clusterin (CLU), cystatin C (CysC), kidney injury molecule-1 (Kim-1), albumin (ALB), urinary total protein (TP), trefoil factor 3 and renal papillary antigen-1—as acceptable for the detection of acute drug-induced renal toxicity and for providing additional and complementary information not available with the currently available standard parameters in specified contexts of nonclinical development4,5,6,7. Moreover, urinary alpha-glutathione S-transferase, mu-glutathione S-transferase, lipocalin (NGAL), and osteopontin have also been recognized as candidate biomarkers for nephrotoxicity8,9,10.
Proximal tubular injury is the most frequent drug-induced renal injury because a high number of xenobiotics are reabsorbed and excreted by proximal tubules11. Glomerular injury also leads to proximal tubular injury because persistent albuminuria following glomerular injury is harmful to renal tubular cells12. Therefore, detection of proximal tubule injury may provide a sensitive way to monitor most, but not all, renal toxicities. Gentamicin (GM) and/or cisplatin (CDDP) are often used to experimentally induce nephrotoxicity when investigating the usefulness and characteristics of biomarkers that detect proximal tubular injury. GM damages proximal convoluted tubules [S1 and S2 segments]13; CDDP primarily damages proximal straight tubules [S3 segments]14.
Biomarkers are usually examined in the urine because urine is readily accessible and repeated measurements can be obtained for individual animals/humans. This allows the investigator to track the onset and progression of a renal injury and recovery from it. In addition to examination in urine, biomarkers are also examined in blood (serum/plasma)15,16,17. Most studies that have evaluated blood biomarkers have been performed in humans, few studies have evaluated blood biomarkers in animals18. Nonetheless, evaluation of blood biomarkers in animals is convenient because blood collection can be routinely performed in preclinical studies. However, evaluation of either urinary or blood biomarkers provides limited information regarding the part of the nephron that is injured and involved with changes in biomarker levels. Tissue-based assays, such as immunohistochemistry, are important to confirm the origin of a biomarker and its relationship with a histopathological change.
Recently, there have been various reports that have compared urinary biomarkers with immunohistochemistry for biomarkers in rat models of proximal tubular injury19,20,21. However, there are a few reports that have evaluated blood biomarkers in correlation with proximal tubular injury in rat models. Moreover, there are no detailed reports integrating the changes in the biomarker levels using urine-based, blood-based and tissue-based approaches. Therefore, to investigate useful biomarkers in urine and blood, which could detect renal injury, we determined the time course changes in levels of a focused set of five biomarkers (Kim-1, NGAL, CLU, CysC and β2M) that can reflect proximal tubular injury3 in urine, blood and kidney tissues from GM- or CDDP-treated rats.
Material and Methods
Animals and experimental design
All procedures were performed after approval of the study by the Institutional Animal Care and Use Committee of Mitsubishi Tanabe Research Laboratories. Male Crl:CD(SD) rats were purchased from Charles River Laboratories (Kanagawa, Japan). The animals were maintained under controlled conditions (12-h light/dark cycle, temperature of 23 ± 3°C, relative humidity of 50 ± 20%) and were given free access to food (autoclaved CRF-1, Oriental Yeast Co., Ltd., Tokyo, Japan) and tap water. Seventy-two animals were allocated to following three groups of 24 animals each: a saline-treated group (control), a GM-treated group (GM group) and a CDDP-treated group (CDDP group). The animals were 6 weeks old at the time of GM or CDDP administration.
GM (240 mg/kg body weight; 5 mL/kg), CDDP (5 mg/kg body weight; 2 mL/kg) or saline was administered intraperitoneally. Dosages were determined based on previous reports22, 23 and a preliminary examination; we evaluated the kidney after slight injury, severe injury and recovery from injury at each time point. Twelve animals in each group were euthanized on day 2 after administration of a single dose; the day of initiation of administration was designated as day 1. Six animals after administration of GM for 4 days or administration of a single dose of CDDP were euthanized on days 5 or 12, respectively. Two animals in the CDDP group euthanized on day 12 were excluded from this study because of a dosing error.
Urinalysis and blood chemistry
The animals in all groups were housed individually in stainless steel metabolic cages for approximately 24 h, and urine was sampled using the following schedule: days 1–2, animals euthanized on day 2; days 4–5, animals euthanized on days 5 and 12; days 11–12, animals euthanized on day 12.
At necropsy, blood was collected from the postcava under anesthesia with an intraperitoneal injection of thiopental sodium (Ravonal®; Mitsubishi Tanabe Pharma Corporation). Serum samples were obtained by centrifugation at 4°C. Plasma samples were obtained after centrifugation at 4°C using a test tube containing dipotassium EDTA. These samples were stored in a freezer at −90 to −70°C until analysis.
Measurements of serum items, including CRE (Serotec, Tokyo, Japan) and BUN (Shino-Test, Tokyo, Japan), were performed using an automatic analyzer (Hitachi High-Technologies Corporation., Tokyo, Japan). Measurements of urinary and serum CysC (Mitsubishi Chemical Medience, Tokyo, Japan) were also performed using this analyzer. Measurements of urinary and plasma Kim-1 (R&D Systems, Minneapolis, MN, USA), NGAL (BioPorto Diagnostics, Gentofte, Denmark), CLU (Life Diagnostics, Inc., West Chester, PA, USA) and β2M (Mitsubishi Chemical Medience) were performed using commercial ELISA kits.
Urinary data are shown as total urinary excretion measured over 24 h of collection. Urinary biomarker levels were not normalized to the contemporaneous urine creatinine level because urinary creatinine excretion in the setting of acute kidney injury is dynamic and its inclusion in the assessment of urinary biomarkers has been challenged24.
Histopathology
Animals were exsanguinated by severing the abdominal aorta and postcava after blood collection, and then the kidneys were harvested. After fixing in 10% neutral buffered formalin, cross sections of the kidney showing papilla were dehydrated and embedded in paraffin. Paraffin sections (4 µm thick) were stained with hematoxylin and eosin. Then, unblinded evaluation of the sections was performed.
Immunohistochemistry
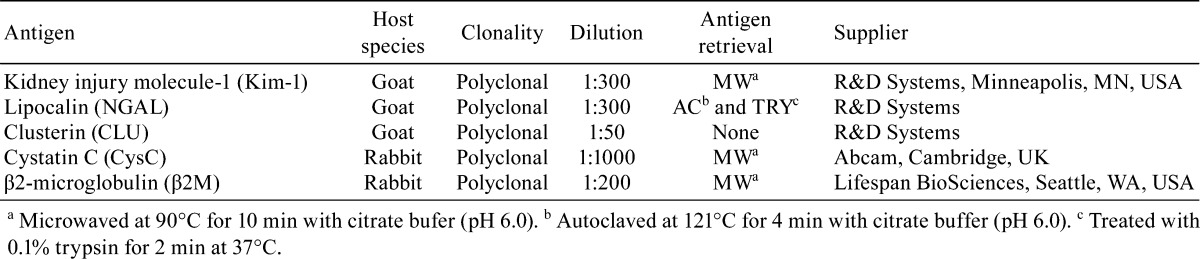
Deparaffinized sections were incubated with 3% H2O2 in distilled water for 10 min and with Block Ace (Dainippon Pharmaceutical Co., Ltd., Osaka, Japan) for 30 min at room temperature. Then, sections were incubated at 4°C for 16 h with primary antibodies. Details of the primary antibodies used are summarized in Table 1. Following incubation with Histofine Simple Stain MAX PO (Nichirei, Tokyo, Japan) for 30 min at room temperature, sections were developed using 0.05% 3,3-diaminobenzidine/H2O2 as the chromogen. All immunostained slides were counterstained with hematoxylin.
Table 1. Primary Antibodies Used in this Study.
Grading of immunoreactivity was performed as follows: −, negative; +, positive for a small area of tubular epithelium in the renal cortex or medulla; ++, positive for a large area of tubular epithelium in the renal cortex or medulla; +++, positive for a large area of tubular epithelium in both the renal cortex and medulla.
Statistical analysis
A two-tailed Dunnett’s multiple comparison test was employed for statistical evaluation of differences between control and treatment groups at a significance level of 5%. Blood chemistry and urinalysis values tended to show a log-normal distribution; therefore, a logarithmic transformation was conducted before employing Dunnett’s multiple comparison test. Values below the lower limit of quantification were regarded as half the lower limit of quantification for conducting logarithmic transformations.
Pearson’s product-moment correlation coefficient was used to evaluate the linear association between the urinary and blood levels of each biomarker.
Results
GM group
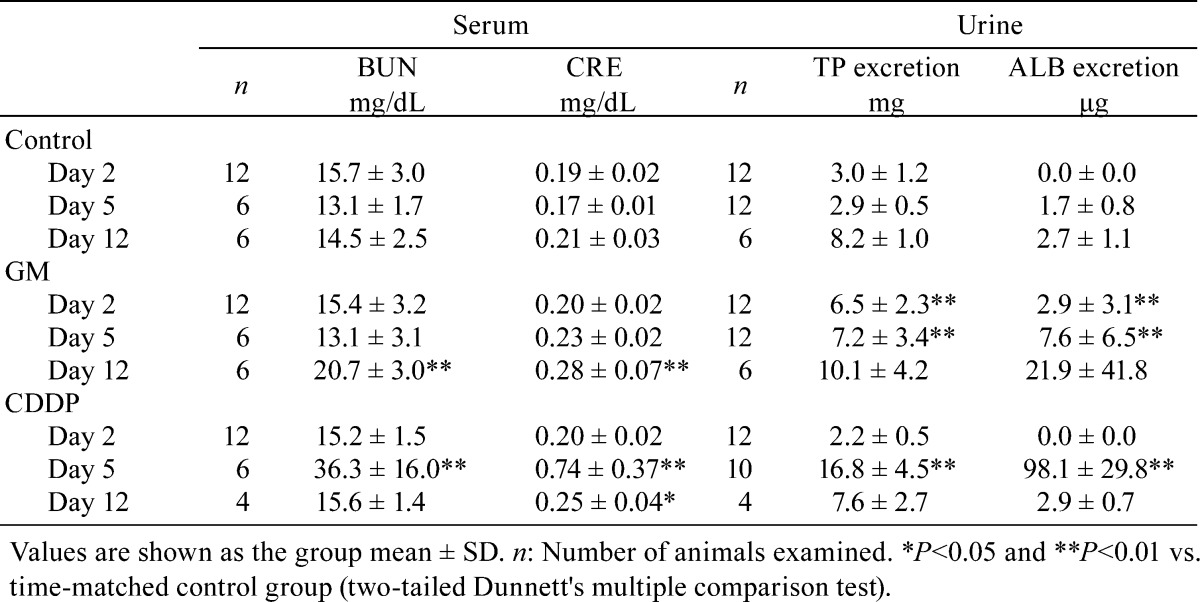
The results of histopathological examination following GM treatment are presented in Table 2. There were no histopathological findings on day 2 (the day after administration of a single dose). Eosinophilic globules and degeneration/necrosis were noted in the proximal convoluted tubules in the cortex on day 5 (Fig. 1a), and regeneration of the tubules subsequently occurred on day 12 (7 days after administration for 4 days; Fig. 1b). On day 12, dilatation of proximal tubules over the cortex and the outer stripe of the outer medulla (OSOM) was observed in one animal (Fig. 1c). Although histopathological changes were observed from day 5, BUN and CRE were significantly increased only on day 12 (Table 3). Urinary TP and ALB levels were significantly increased from days 2 to 5 (Table 3).
Table 2. Histopathological Findings in the Kidney after Receiving GM or CDDP.
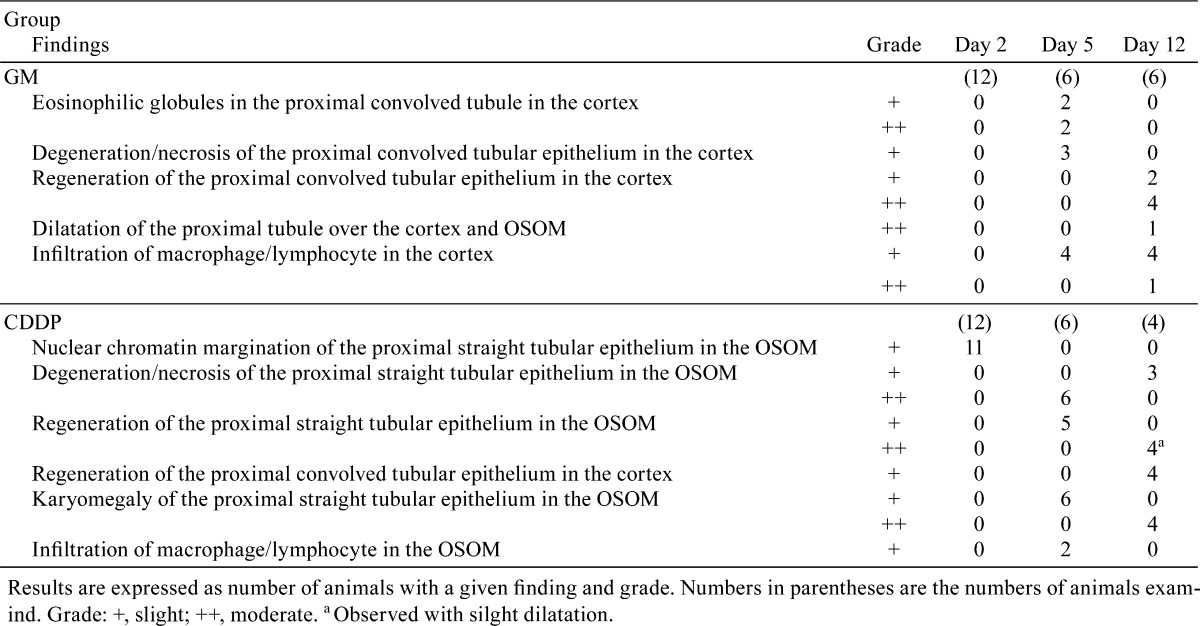
Fig. 1.

Histopathological findings in the kidneys of rats following GM or CDDP administration. The following findings were obtained in the GM group: eoshinophilic globules in and degeneration/necrosis of the proximal convoluted tubular epithelium in the cortex on day 5 (a), regeneration of the proximal convoluted tubular epithelium in the cortex on day 12 (b) and dilatation of the proximal tubule over the cortex and OSOM on day 12 (c). The following findings were observed in the CDDP group: nuclear chromatin margination of the proximal straight tubular epithelium (arrow) in the OSOM on day 2 (d) and degeneration/necrosis, regeneration, karyomegaly (arrow head) of the proximal straight tubular epithelium in the OSOM on day 5 (e) and day 12 (f). Hematoxylin and eosin staining. Bar = 50 μm (a, d, e, f), 100 μm (b, c).
Table 3. Blood Chemistry and Urinalysis Parameters Except for Focused Biomarkers.
On day 12, it was found that the TP and ALB levels had recovered to within the control range, except for the animal with dilatation of the proximal tubules observed in histopathology; this animal showed extremely high TP and ALB levels (17.2 mg and 107.0 μg, respectively). It also showed extremely high levels of the following biomarkers: urinary and plasma Kim-1 (723.9 ng and 1675.1 pg/mL, respectively) and urinary NGAL (28998.6 ng), CLU (13182.4 ng) and CysC (19.68 μg).
(1) Kim-1: The urinary Kim-1 level was significantly increased on days 5 and 12, whereas the plasma Kim-1 level was increased only on day 12 (Fig. 2a, b). Although the plasma Kim-1 levels increased after the urinary Kim-1 levels, the two were strongly correlated [coefficient of correlation (R) = 0.96, P<0.01; Fig. 3a], and both the levels of urinary and plasma Kim-1 increased from day 5 to 12.
Fig. 2.

Time course of the appearance of urinary and blood biomarkers in rats given a single administration or 4 administrations of gentamicin (GM, 240 mg/kg/day), rats given a single administration of cisplatin (CDDP, 5 mg/kg) or rats used as the vehicle control. The urinary and serum/plasma levels of Kim-1(a, b), NGAL (c, d), CLU (e, f), CysC (g, h) and β2M (i, j) were assayed at the indicated time points (the day after initial dosing shown as day 2). Individual data and mean values are expressed. The sample numbers were as follows: n = 12 for urinalysis on days 2 and 5 and blood analysis on day 2, except for the CDDP group (n = 10 for urinalysis on day 5), and n = 6 for urinalysis on day 12 and blood analysis on days 5 and 12, except for the CDDP group (n = 4 for urinalysis and blood analysis on day 12). *P<0.05 and **P<0.01 vs. control group (two-tailed Dunnett’s multiple comparison test).
Fig. 3.

Relationship between the urinary and serum/plasma levels of biomarkers. Pearson’s product-moment correlation coefficient was used to evaluate the linear association between the urinary and blood levels of each biomarker. Kim-1 (GM group, coefficient of correlation (R) = 0.96, P<0.01; CDDP group, R=0.71, P<0.01) (a), NGAL (GM group, R=0.89, P<0.01; CDDP group, R=0.95, P<0.01) (b), CLU (GM group, R=0.10, P=0.65; CDDP group, R=0.60, P<0.01) (c), CysC (GM group, R=0.25, P=0.26, CDDP group, R=0.40, P=0.07) (d), β2M (GM group, R=0.33, P=0.13, CDDP group, R=0.68, P<0.01) (e).
The results of immunohistochemistry following GM treatment are presented in Table 4. Kim-1 immunoreactivity was absent in control animals at every time point. In GM-treated animals, Kim-1 immunoreactivity was detected in a part of the proximal convoluted tubules in a nephron that displayed eosinophilic globules or degeneration/necrosis on day 5 (Fig. 4a). Kim-1 immunoreactivity was also detected in both the regenerated tubules (Fig. 4b) and dilated tubules on day 12 (Fig. 4c).
Table 4. Immunohistochemistry in the Kidney after Administration of GM or CDDP.
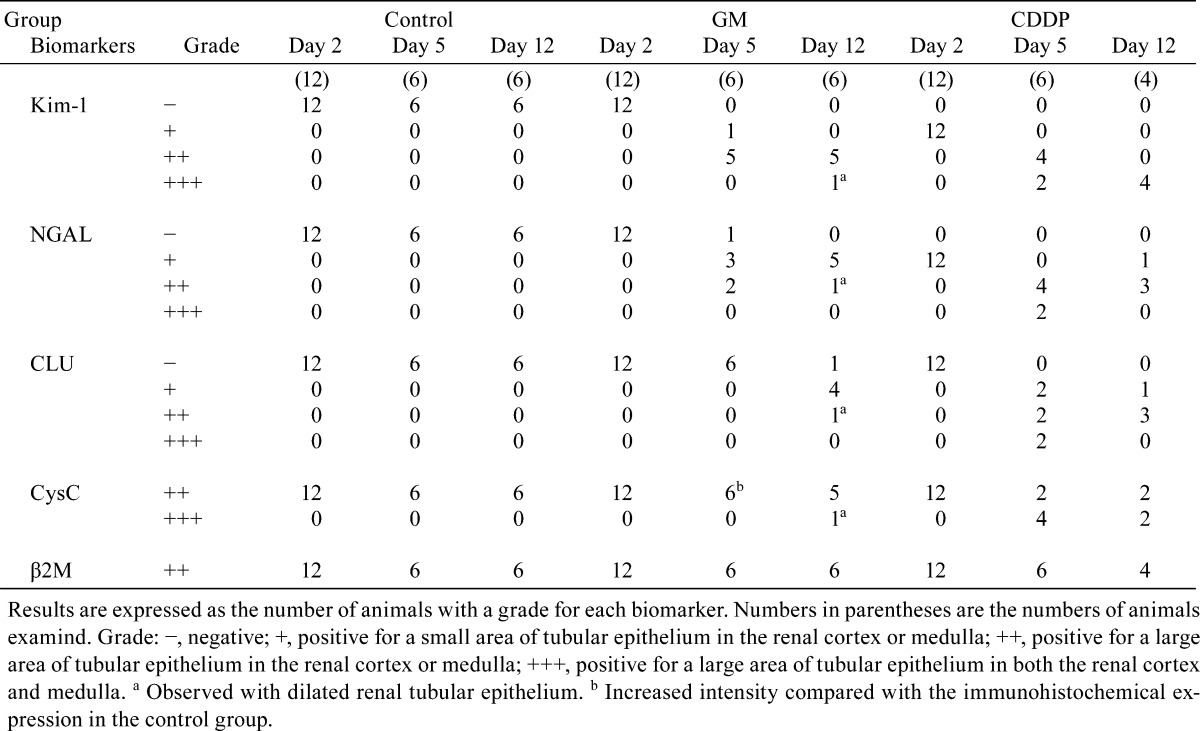
Fig. 4.

Kim-1 immunohistochemistry in the kidneys of rats following administration of GM or CDDP. Kim-1 immunoreactivity in a part of the proximal convoluted tubules in a nephron on day 5 (a), regenerated tubules on day 12 (b) and dilated tubules on day 12 (c) in the GM group. Kim-1 immunoreactivity in a few proximal straight tubules in the OSOM on day 2 (d) and the immunoreactivity in degenerate/necrotic and regenerated tubules on day 5 (e) and day 12 (f) in the CDDP group. Bar = 100 μm (a–f).
(2) NGAL: The urinary NGAL levels on days 5 and 12 were increased and showed equal values, although the increase on day 5 was not statistically significant (Fig. 2c). Although the urinary NGAL levels were showed a strong correlation with the plasma levels (R=0.89, P<0.01; Fig. 3b), the plasma NGAL were not increased in majority of the animals at any time point (Fig. 2d).
NGAL immunoreactivity was absent in control animals at every time point. NGAL immunoreactivity in GM-treated animal was similar to that of Kim-1. However, the immunoreactivity was observed sporadically with granular staining in a part of the proximal convoluted tubules that displayed eosinophilic globules or degeneration/necrosis on day 5 (Fig. 5a). NGAL immunoreactivity was also detected in a few regenerated tubules (Fig. 5b) and a part of the dilated tubules on day 12 (Fig. 5c).
Fig. 5.

NGAL immunohistochemistry in the kidneys of rats following administration of GM or CDDP. NGAL immunoreactivity in a part of the proximal convoluted tubules sporadically on day 5 (a) and in a few regenerated tubules (b) and a part of dilated tubules on day 12 (c) in the GM group. NGAL immunoreactivity in a few proximal straight tubules in the OSOM on day 2 (d) and in degenerate/necrotic and regenerated tubules and their lumens on day 5 (e) and in a few degenerate/necrotic and regenerated tubules on day 12 (f) in the CDDP group. Bar = 100 μm (a–f).
(3) CLU: The urinary CLU levels were significantly increased only on day 12, but the plasma CLU levels showed no increase at any time point (Fig. 2e, f). In addition, there was no significant correlation between urinary and plasma CLU levels (R=0.10, P=0.65; Fig. 3c).
CLU immunoreactivity was absent in control animals at every time point. CLU immunoreactivity in the GM-treated group was also absent on days 2 and 5, but it was detected in a few normal distal tubules (Fig. 6a) and a part of the dilated tubules on day 12 (Fig. 6b).
Fig. 6.

CLU immunohistochemistry in the kidneys of rats following administration of GM or CDDP. CLU immunoreactivity in a few normal distal tubules in the cortex (a) and in a part of the dilated tubules on day 12 (b) in the GM group. CLU immunoreactivity in a part of degenerate/necrotic tubules and lumens of normal tubules in the medulla (c) and the distal tubules over the cortex to medulla on day 5 (d) and in a few degenerate/necrotic tubules in the medulla on day 12 (e) in the CDDP group. Bar = 100 μm (a, b), 200 μm (c–e).
(4) CysC: The urinary CysC levels significantly increased on days 2 and 5 (Fig. 2g); however, the serum CysC levels showed no increase at any time point (Fig. 2g, h) and no significant correlation with the urinary levels (R=0.25, P=0.26; Fig. 3d). The urinary CysC levels increased from days 2 to 5. The increased mean urinary CysC level on day 12 was considered to reflect the data from the animal with proximal tubule dilatation because the CysC levels of the other animals were similar to the levels of the control animals.
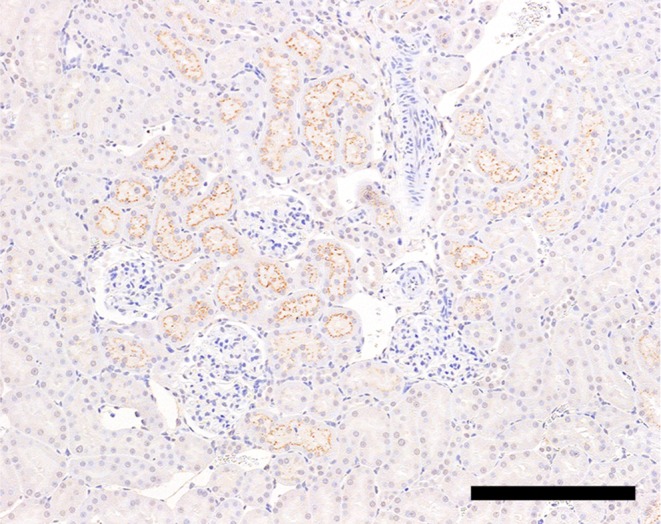
CysC immunoreactivity was present in the proximal convoluted tubules in control animals at every time point (Fig. 7a). In the kidney of the GM-treated animals on day 5, CysC immunoreactivity was more evident than that in the control animals, displaying the strongest intensity in the proximal convoluted tubules (Fig. 7b) In addition to this area, CysC immunoreactivity was detected in a part of the dilated tubules on day 12 (Fig. 7c).
Fig. 7.

CysC immunohistochemistry in the kidneys of rats following administration of GM, CDDP or a vehicle control. CysC immunoreactivity in the proximal convoluted tubules in control animals on day 5 (a, d). CysC immunoreactivity with a strong intensity in the proximal convoluted tubules of rats on day 5 (b) and immunoreactivity in a part of dilated tubules in addition to the proximal convoluted tubules on day 12 (c) in the GM group. CysC immunoreactivity in a part of the tubules including degenerated/necrotic and regenerated tubules and the tubular lumens of the medulla on day 5 (e). Bar = 200 μm (a, b, c), 400 μm (d, e).
(5) β2M: The urinary β2M levels were significantly increased at every time point, whereas the plasma β2M levels were significantly increased on days 2 and 5 (Fig. 2i, j). Both the urinary and plasma β2M levels increased from days 2 to 5 and decreased from days 5 to 12, although no significant correlation was observed (R=0.33, P=0.13; Fig. 3e).
β2M immunoreactivity was observed in the proximal convoluted tubules in the control animals (Fig. 8), and the immunoreactivity was not affected by GM administration.
Fig. 8.
β2M immunoreactivity in the proximal convoluted tubules of a control animal on day 5. Bar = 200 μm.
CDDP group
The results of histopathological examination following CDDP treatment are presented in Table 2. On day 2, nuclear chromatin margination was observed in the proximal straight tubule in the OSOM (Fig. 1d). On day 5, degeneration/necrosis and regeneration of the proximal straight tubule and karyomegaly in the proximal straight tubule were observed in the OSOM (Fig. 1e). Although the majority of these changes were still observed on day 12, the degenerated/necrotic areas began to be replaced by regenerated tubules (Fig. 1f) accompanied by slight dilatation. The BUN, CRE, ALB and TP levels showed significant increases mainly on day 5, and the levels on day 12 were similar to those of the control levels (Table 3).
(1) Kim-1: The urinary Kim-1 levels significantly increased at every point (Fig. 2a). The plasma Kim-1 level was significantly increased on days 5 and 12 (Fig. 2b). The plasma Kim-1 levels showed a strong correlation with the urinary levels (R=0.71, P<0.01; Fig. 3a). The urinary and plasma Kim-1 levels increased from days 2 to 5 and remained at high levels until day 12.
The results of immunohistochemistry following CDDP treatment are presented in Table 4. Kim-1 immunoreactivity was detected in a few proximal straight tubules on day 2 (Fig. 4d). This immunoreactivity corresponded poorly with that of the lesion with nuclear chromatin margination. Kim-1 immunoreactivity was also detected in the degenerated/necrotic and regenerated tubules on days 5 and 12, respectively (Fig. 4e, f).
(2) NGAL: There were no apparent increases in the urinary and plasma NGAL levels at any time point (Fig. 2c, d), although the urinary and plasma levels showed correlation (R=0.95, P<0.01; Fig. 3b).
NGAL immunoreactivity was detected in a few proximal straight tubules in the OSOM on day 2 (Fig. 5d). Similar to Kim-1, NGAL immunoreactivity corresponded poorly with that of the lesion with nuclear chromatin margination. NGAL immunoreactivity was also detected in degenerated/necrotic and regenerated tubules on days 5 and 12, respectively, and their lumens on day 5 (Fig. 5e, f). The intensity of immunoreactivity decreased from days 5 to 12.
(3) CLU: The urinary CLU levels increased on days 5 and 12, although the increase on day 12 was not significant (Fig. 2e, f). Plasma CLU levels were also increased on day 5 and then decreased from days 5 to 12. The urinary and plasma CLU levels showed moderate correlation (R=0.60, P<0.01; Fig. 3c).
CLU immunoreactivity was detected in a part of the degenerated/necrotic tubules in the OSOM on days 5 and 12 (Fig. 6c, e), and the intensity of immunoreactivity decreased from days 5 to 12. CLU immunoreactivity was also observed in the lumens of normal tubules in the medulla and in the normal distal tubules over the medulla and cortex on day 5 (Fig. 6c, d).
(4) CysC: Urinary CysC levels significantly increased on day 5; however, serum CysC levels did not change at any time point (Fig. 2g, h) and did not correlate with the urinary levels (R=0.40, P=0.07; Fig. 3d).
CysC immunoreactivity was present in the proximal convoluted tubules in the cortex of the kidneys of control animals (Fig. 7d). CDDP-treated animals showed additional CysC immunoreactivity in a part of the tubules including degenerated/necrotic and regenerated tubules and the tubular lumens of the medulla on days 5 (Fig. 7e) and 12.
(5) β2M: Urinary and plasma levels of β2M significantly increased on day 5 (Fig. 2f, j), and they were moderately correlated (R=0.68, P<0.01; Fig.3e).
In immunohistochemistry, there was no significant difference between control and CDDP-treated animals.
Discussion
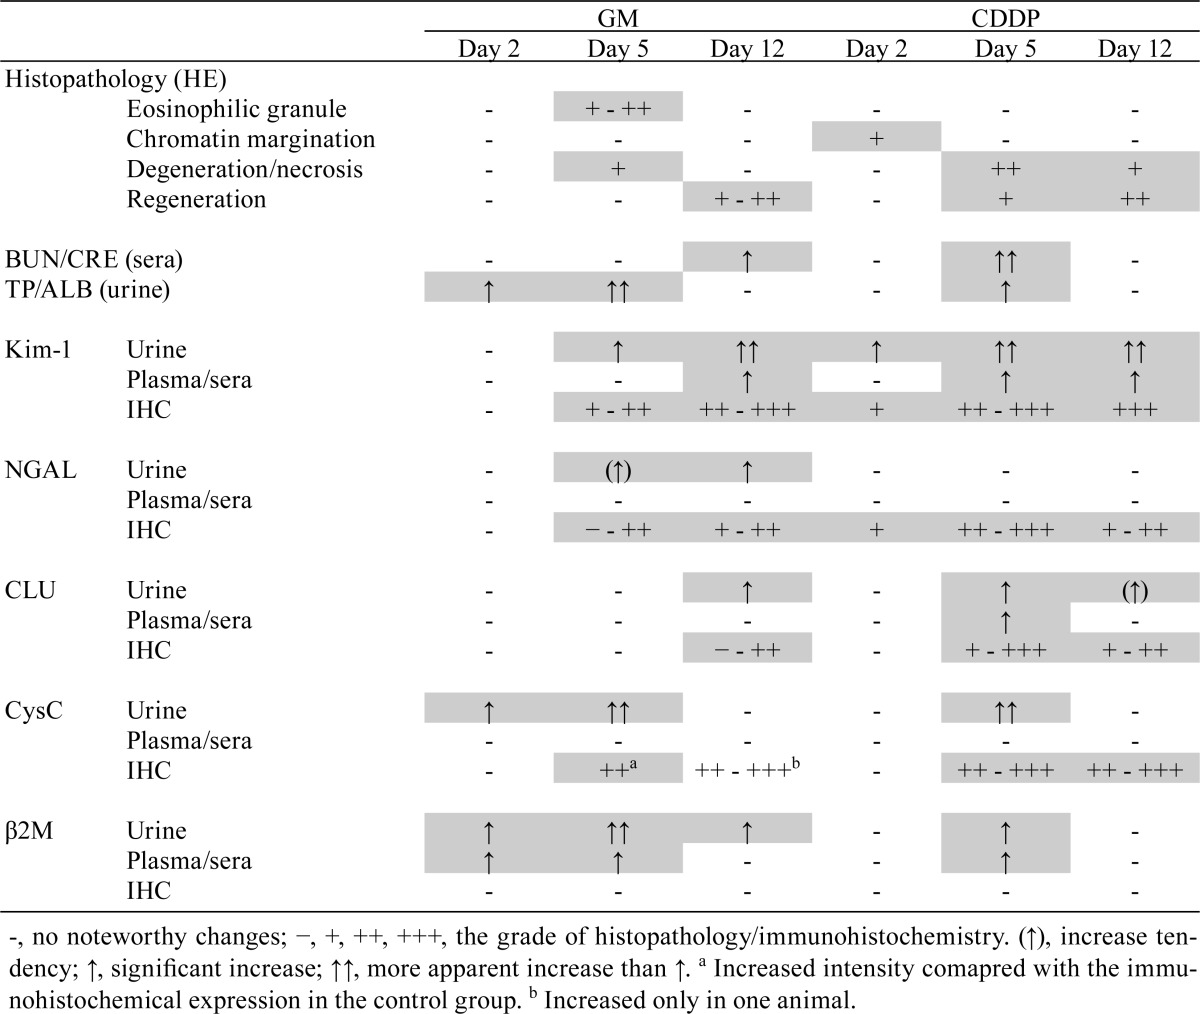
To investigate useful biomarkers that can detect proximal tubular injury, we determined the time course changes in levels of five biomarkers (Kim-1, NGAL, CLU, CysC and β2M) in urine and blood. Immunohistochemical analysis for these biomarkers was also performed to confirm the association between histopathological injury and biomarker behaviors in the kidney. Overall results are summarized in Table 5.
Table 5. Summary of the Changes in Histopathology and Biomarkers.
This study suggested that urinary Kim-1, CysC and β2M levels are especially useful for detecting proximal tubular injury. Although urinary levels of all five biomarkers are known to reflect a proximal tubular injury3, NGAL and CLU did not increase in association with degeneration/necrosis of the proximal tubule (on day 5) in GM and/or CDDP groups. Moreover, the changes in the urinary CysC and β2M levels were considered to successfully represent the time course changes in histopathology; the increased levels of these biomarkers accompanying histological injury (on day 5) returned to close to the control range in the recovery phase (on day 12). Immunohistochemical analysis was useful in confirming the association of proximal tubular injury with urinary levels of Kim-1 but not with urinary levels of CysC and β2M. The immunoreactivity patterns of CysC changed in both GM- and CDDP-treated animals and resembled those in the past reports25, 26; however, the changes in CysC immunoreactivity did not correlate with the time of increase of CysC levels in urine, and no change in β2M immunoreactivity was observed in any of the treated animals in this study.
We also revealed that urinary Kim-1, CysC and β2M levels increased prior to degeneration/necrosis of the proximal tubule, depending on the toxicity characteristics of the treatment. In the GM group, the CysC and β2M levels markedly increased on day 2 without any histopathological findings. CysC and β2M are low-molecular-weight proteins that are almost completely filtered from the blood in the glomerulus, and the filtered CysC and β2M are reabsorbed and metabolized by the proximal convoluted tubules3, 11. An increase in the urinary levels of these biomarkers indicates impaired tubular reabsorption, reflecting renal tubular injury or protein overload, such as that from glomerular injury11, 27. In addition, polycationic drugs such as GM increase the glomerular filtration of large anionic proteins, such as albumin, through a change in electrical charge11, 28. Coupled with the increase of TP and ALB levels observed at the same time point, the increase in urinary CysC and β2M levels without histopathological findings suggests the impairment of tubular reabsorption resulting from protein overload, not proximal tubular injury. On the other hand, urinary Kim-1 levels significantly increased on day 2 before degeneration/necrosis of the proximal tubule in the CDDP group. In the case of CDDP, proximal tubular injury begins with oxidative damage of cellular components14; thus, the levels of Kim-1, which is expressed in the injured renal tubular epithelial membrane29, 30, changed first, reflecting cytotoxicity. As for the nuclear margination observed at the same time point, its involvement in the changes in urinary Kim-1 levels was not completely understood because of the inconsistency between the lesion and immunoreactivity. However, considering that both of them were observed in the same area, nuclear margination may be the histopathological event that leads to degeneration/necrosis of the proximal tubule.
We revealed that both urinary and plasma β2M are sufficiently sensitive in detecting proximal tubular injury. Notably, plasma β2M levels increased in a manner similar to urinary β2M level, although the magnitude of the changes was not perfectly correlated in terms of individual values. According to several reports from human studies, increased β2M levels in blood correlate with a decreased glomerular filtration rate31, 32, whereas increased β2M levels in urine correlate with the an impairment of tubular reabsorption11, 2711, 27. Therefore, the plasma β2M level is considered to reflect a decreased glomerular filtration rate in parallel with a proximal tubular injury, although the relationship between the urinary and plasma β2M levels is still not completely understood.
In contrast, serum CysC, which has characteristics similar to those of β2M, did not change at any time point. This may be because of the difference in the measuring method: measurement with an autoanalyzer could not detect the changes in serum CysC levels because the sensitivity of the autoanalyzer was lower than that of commercial ELISA kits.
It was also noteworthy that plasma Kim-1 levels revealed good associations with urinary Kim-1 levels, although the sensitivity of plasma Kim-1 was inferior to that of urinary Kim-1. A recent study reported that plasma Kim-1 levels increased after GM treatment in rats18. Although the exact mechanism of the increase in blood Kim-1 levels remains unclear, it may be due to its direct leakage into the blood circulation because disturbance of cell polarity or permeability could occur after proximal tubular injury.
In conclusion, this study suggested that urinary Kim-1, CysC and β2M levels are useful biomarkers for detecting proximal tubular injury because an increase in them is accompanied by degeneration/necrosis of the proximal tubule, and an increase in them was also observed prior to degeneration/necrosis depending on the toxicity characteristics. Moreover, we revealed that not only urinary biomarker levels but also plasma β2M levels are useful for detecting proximal tubular injury because the latter increased in a manner similar to that observed for urinary β2M levels. Although the increase in plasma β2M levels was considered to reflect the decrease in glomerular filtration rate rather than the direct effect of a proximal tubular injury, plasma β2M levels could be an alternative biomarker in preclinical studies in cases where urine samples are unavailable.
Acknowledgments
The authors would like to thank Mr. Katsuya Fujiki and Mr. Kenichi Ohta for skillful technical assistance and Kouji Kawai for English proofreading.
Footnotes
Disclosure of Potential Conflicts of Interest: The authors declare that they have no competing interests.
References
- 1.Naughton CA. Drug-induced nephrotoxicity. Am Fam Physician. 78: 743–750. 2008. [PubMed] [Google Scholar]
- 2.Redfern WS, Ewart L, Hammond TG, Bialecki R, Kinter L, Lindgren S, Pollard CE, Roberts R, Rolf MG, and Valentin JP. Impact and frequency of different toxicities throughout the pharmaceutical life cycle. Toxicologist. 114: 1081 2010. [Google Scholar]
- 3.Bonventre JV, Vaidya VS, Schmouder R, Feig P, and Dieterle F. Next-generation biomarkers for detecting kidney toxicity. Nat Biotechnol. 28: 436–440. 2010. [DOI] [PMC free article] [PubMed] [Google Scholar]
- 4.Food and Drug Administration (FDA) Seven biomarkers of drug-induced nephrotoxicity in rats. 2008, from website: http://www.fda.gov/Drugs/DevelopmentApprovalProcess/DrugDevelopmentToolsQualificationProgram/ucm284076.htm.
- 5.FDA Non-clinical qualification of urinary biomarkers of nephrotoxicity. HESI nephrotoxicity qualification. 2010, from website: http://www.fda.gov/Drugs/DevelopmentApprovalProcess/DrugDevelopmentToolsQualificationProgram/ucm284076.htm.
- 6.European Medicines Agency (EMEA) Qualification opinion ILSI/HESI submission of novel renal biomarkers for toxicity. 2010, from website: http://www.ema.europa.eu/docs/en_GB/document_library/Regulatory_and_procedural_guideline/2010/11/WC500099359.pdf.
- 7.Pharmaceuticals and Medical Devices Agency of Japan (PMDA) Record of the consultation on pharmacogenomics/biomarkers. 2010, from website http://www.pmda.go.jp/operations/shonin/info/consult/file/pbm-kiroku-e.pdf.
- 8.Haase M, Bellomo R, Devarajan P, Schlattmann P, and Haase-Fielitz A. NGAL Meta-analysis Investigator Group Accuracy of neutrophil gelatinase-associated lipocalin (NGAL) in diagnosis and prognosis in acute kidney injury: a systematic review and meta-analysis. Am J Kidney Dis. 54: 1012–1024. 2009. [DOI] [PubMed] [Google Scholar]
- 9.Bonventre JV. Kidney injury molecule-1 (KIM-1): a urinary biomarker and much more. Nephrol Dial Transplant. 24: 3265–3268. 2009. [DOI] [PubMed] [Google Scholar]
- 10.Ferguson MA, Vaidya VS, and Bonventre JV. Biomarkers of nephrotoxic acute kidney injury. Toxicology. 245: 182–193. 2008. [DOI] [PMC free article] [PubMed] [Google Scholar]
- 11.Coimbra TM, and Lachat JJ. Analysis of urinary albumin excretion in gentamicin-treated rats. Nephron. 49: 154–159. 1988. [DOI] [PubMed] [Google Scholar]
- 12.Abbate M, Zoja C, and Remuzzi G. How does proteinuria cause progressive renal damage? J Am Soc Nephrol. 17: 2974–2984. 2006. [DOI] [PubMed] [Google Scholar]
- 13.Mingeot-Leclercq MP, and Tulkens PM. Aminoglycosides: nephrotoxicity. Antimicrob Agents Chemother. 43: 1003–1012. 1999. [DOI] [PMC free article] [PubMed] [Google Scholar]
- 14.Yao X, Panichpisal K, Kurtzman N, and Nugent K. Cisplatin nephrotoxicity: a review. Am J Med Sci. 334: 115–124. 2007. [DOI] [PubMed] [Google Scholar]
- 15.Alter ML, Kretschmer A, Von Websky K, Tsuprykov O, Reichetzeder C, Simon A, Stasch JP, and Hocher B. Early urinary and plasma biomarkers for experimental diabetic nephropathy. Clin Lab. 58: 659–671. 2012. [PubMed] [Google Scholar]
- 16.Coca SG, Yalavarthy R, Concato J, and Parikh CR. Biomarkers for the diagnosis and risk stratification of acute kidney injury: a systematic review. Kidney Int. 73: 1008–1016. 2008. [DOI] [PubMed] [Google Scholar]
- 17.Ozer JS, Dieterle F, Troth S, Perentes E, Cordier A, Verdes P, Staedtler F, Mahl A, Grenet O, Roth DR, Wahl D, Legay F, Holder D, Erdos Z, Vlasakova K, Jin H, Yu Y, Muniappa N, Forest T, Clouse HK, Reynolds S, Bailey WJ, Thudium DT, Topper MJ, Skopek TR, Sina JF, Glaab WE, Vonderscher J, Maurer G, Chibout SD, Sistare FD, and Gerhold DL. A panel of urinary biomarkers to monitor reversibility of renal injury and a serum marker with improved potential to assess renal function. Nat Biotechnol. 28: 486–494. 2010. [DOI] [PubMed] [Google Scholar]
- 18.Vinken P, Starckx S, Barale-Thomas E, Looszova A, Sonee M, Goeminne N, Versmissen L, Buyens K, and Lampo A. Tissue Kim-1 and urinary clusterin as early indicators of cisplatin-induced acute kidney injury in rats. Toxicol Pathol. 40: 1049–1062. 2012. [DOI] [PubMed] [Google Scholar]
- 19.Sabbisetti VS, Waikar SS, Antoine DJ, Smiles A, Wang C, Ravisankar A, Ito K, Sharma S, Ramadesikan S, Lee M, Briskin R, De Jager PL, Ngo TT, Radlinski M, Dear JW, Park KB, Betensky R, Krolewski AS, and Bonventre JV. Blood kidney injury molecule-1 is a biomarker of acute and chronic kidney injury and predicts progression to ESRD in type I diabetes. J Am Soc Nephrol. 25: 2177–2186. 2014. [DOI] [PMC free article] [PubMed] [Google Scholar]
- 20.Wadey RM, Pinches MG, Jones HB, Riccardi D, and Price SA. Tissue expression and correlation of a panel of urinary biomarkers following cisplatin-induced kidney injury. Toxicol Pathol. 42: 591–602. 2014. [DOI] [PubMed] [Google Scholar]
- 21.Kashiwagi E, Tonomura Y, Kondo C, Masuno K, Fujisawa K, Tsuchiya N, Matsushima S, Torii M, Takasu N, Izawa T, Kuwamura M, and Yamate J. Involvement of neutrophil gelatinase-associated lipocalin and osteopontin in renal tubular regeneration and interstitial fibrosis after cisplatin-induced renal failure. Exp Toxicol Pathol. 66: 301–311. 2014. [DOI] [PubMed] [Google Scholar]
- 22.Vaidya VS, Ozer JS, Dieterle F, Collings FB, Ramirez V, Troth S, Muniappa N, Thudium D, Gerhold D, Holder DJ, Bobadilla NA, Marrer E, Perentes E, Cordier A, Vonderscher J, Maurer G, Goering PL, Sistare FD, and Bonventre JV. Kidney injury molecule-1 outperforms traditional biomarkers of kidney injury in preclinical biomarker qualification studies. Nat Biotechnol. 28: 478–485. 2010. [DOI] [PMC free article] [PubMed] [Google Scholar]
- 23.Vaidya VS, Ramirez V, Ichimura T, Bobadilla NA, and Bonventre JV. Urinary kidney injury molecule-1: a sensitive quantitative biomarker for early detection of kidney tubular injury. Am J Physiol Renal Physiol. 290: F517–F529. 2006. [DOI] [PubMed] [Google Scholar]
- 24.Waikar SS, Sabbisetti VS, and Bonventre JV. Normalization of urinary biomarkers to creatinine during changes in glomerular filtration rate. Kidney Int. 78: 486–494. 2010. [DOI] [PMC free article] [PubMed] [Google Scholar]
- 25.Dieterle F, Perentes E, Cordier A, Roth DR, Verdes P, Grenet O, Pantano S, Moulin P, Wahl D, Mahl A, End P, Staedtler F, Legay F, Carl K, Laurie D, Chibout SD, Vonderscher J, and Maurer G. Urinary clusterin, cystatin C, beta2-microglobulin and total protein as markers to detect drug-induced kidney injury. Nat Biotechnol. 28: 463–469. 2010. [DOI] [PubMed] [Google Scholar]
- 26.Togashi Y, Sakaguchi Y, Miyamoto M, and Miyamoto Y. Urinary cystatin C as a biomarker for acute kidney injury and its immunohistochemical localization in kidney in the CDDP-treated rats. Exp Toxicol Pathol. 64: 797–805. 2012. [DOI] [PubMed] [Google Scholar]
- 27.Togashi Y, Imura N, and Miyamoto Y. Urinary cystatin C as a renal biomarker and its immunohistochemical localization in anti-GBM glomerulonephritis rats. Exp Toxicol Pathol. 65: 1137–1143. 2013. [DOI] [PubMed] [Google Scholar]
- 28.Bernard A, Amor AO, Viau C, and Lauwerys R. The renal uptake of proteins: a nonselective process in conscious rats. Kidney Int. 34: 175–185. 1988. [DOI] [PubMed] [Google Scholar]
- 29.Ichimura T, Hung CC, Yang SA, Stevens JL, and Bonventre JV. Kidney injury molecule-1: a tissue and urinary biomarker for nephrotoxicant-induced renal injury. Am J Physiol Renal Physiol. 286: F552–F563. 2004. [DOI] [PubMed] [Google Scholar]
- 30.Rached E, Hoffmann D, Blumbach K, Weber K, Dekant W, and Mally A. Evaluation of putative biomarkers of nephrotoxicity after exposure to ochratoxin a in vivo and in vitro. Toxicol Sci. 103: 371–381. 2008. [DOI] [PubMed] [Google Scholar]
- 31.Donadio C, Lucchesi A, Ardini M, and Giordani R. Cystatin C, beta 2-microglobulin, and retinol-binding protein as indicators of glomerular filtration rate: comparison with plasma creatinine. J Pharm Biomed Anal. 24: 835–842. 2001. [DOI] [PubMed] [Google Scholar]
- 32.Bianchi C, Donadio C, Tramonti G, Consani C, Lorusso P, and Rossi G. Reappraisal of serum beta2-microglobulin as marker of GFR. Ren Fail. 23: 419–429. 2001. [DOI] [PubMed] [Google Scholar]