Abstract
We demonstrate the utility of functional near-infrared spectroscopy (fNIRS) as a tool for physicians to study cortical plasticity in children with cerebral palsy (CP). Motor cortex activation patterns were studied in five healthy children and five children with CP ( old in both groups) performing a finger-tapping protocol. Spatial (distance from center and area difference) and temporal (duration and time-to-peak) image metrics are proposed as potential biomarkers for differentiating abnormal cortical activation in children with CP from healthy pediatric controls. In addition, a similarity image-analysis concept is presented that unveils areas that have similar activation patterns as that of the maximum activation area, but are not discernible by visual inspection of standard activation images. Metrics derived from the images presenting areas of similarity are shown to be sensitive identifiers of abnormal activation patterns in children with CP. Importantly, the proposed similarity concept and related metrics may be applicable to other studies for the identification of cortical activation patterns by fNIRS.
Keywords: functional near-infrared spectroscopy, cerebral palsy, plasticity, motor cortex, similarity, neuroimaging
Introduction
Cerebral palsy (CP) occurs in 2 per 1000 live births every year.1 CP describes a set of disorders that prevent proper movement and posture often accompanied by loss of sensation, perception, cognition, communication, secondary musculoskeletal problems, and recurrent seizures.2 This disorder is caused by damage to the motor control centers of the developing brain. The damage can occur during pregnancy, childbirth, or after birth early in a child’s life. One of the most prevalent types of the disorder is hemiparetic CP, an incomplete paralysis of one-half of the body. These motor deficits profoundly affect a child’s ability to develop motor skills and to engage fully in play, exploration, and self-help activities. Thus, children with CP spontaneously undergo plastic changes in their neuronal circuitry by recruiting healthy portions of their brain to partially compensate for the affected areas, resulting in their improved motor performance.3 Clinical professionals currently diagnose the functional severity of a child with CP based on qualitative scores derived by observing the success with which that child handles a prescribed series of upper extremity tasks.4, 5, 6 However, no standard imaging method currently exists for observing the spatiotemporal activation patterns of the motor cortex in children with CP and how these patterns differ from patterns of healthy children.
Although functional magnetic resonance imaging (fMRI) is the “gold standard” for neuroimaging, it often requires the patient’s complete body confinement, steadiness, and minimal interference caused by motion artifacts for the duration of experiments, which limits the success rate to for normal children.7 Nevertheless, there are case reports on the use of fMRI alone or in combination with transcranial magnetic stimulation, which investigated different aspects of cortical reorganization in children with CP.8, 9, 10, 11, 12, 13, 14 Although CP is thought to originate mostly from subcortical lesions and less often from cortical ones,8 there is evidence that associated plasticity changes occur in the motor cortex.9, 10, 11, 12, 13, 14 Certain differences in cortical activation patterns have emerged from these studies between healthy and children with CP. For example, in an fMRI study, children with hemiparesis of their upper extremities showed stronger ipsilateral activation when tapping with their affected hand.10 In the future, identifying such differential activation patterns could potentially provide biomarkers to help physicians assess the severity of CP in a more quantitative manner as well as assess the response to a specific treatment.
Functional near-infrared spectroscopy (fNIRS) offers great promise in becoming the imaging tool of choice for physicians to monitor cortical activation patterns in children with CP. It is cost effective, safe, noninvasive, and less affected by movement than other imaging modalities, such as fMRI.15 fNIRS detects changes in light absorption and scattering in tissue caused by the changes in concentration of oxyhemoglobin (HbO) and deoxyhemoglobin (Hb) secondary to neuronal activity, known as neurovascular coupling.16 Moreover, fNIRS has much higher temporal resolution, up to tens of milliseconds,17 compared to fMRI, which has a temporal resolution measured in seconds.18, 19
In this work, we demonstrate how fNIRS image analysis of motor cortex activation patterns due to finger tapping enables identification of spatial and temporal metrics that can be used to differentiate between normal pediatric subjects and children with CP with high statistical significance. The definition and use of these metrics, namely the distance from center, area difference, duration, and time-to-peak, is described. In addition, a similarity concept is defined that enables identification of both areas that have similar activation patterns as that of the maximum activation area, as well as dissimilar activation patterns within that area, which are not readily discernible in unprocessed activation images. It is shown that some of the metrics quantified from similarity images can serve as sensitive discriminators of abnormal activation patterns in children with CP.
Materials and Methods
Subjects
Five pediatric controls, Subjects 1–5 (two female and three male, old), and five children with hemiparetic CP, Subjects 6–10 (three female and two male, old), were included in this study. All the controls were right handed. Only children with CP that had a successful anatomical magnetic resonance imaging scan performed, indicating a single subcortical lesion in one of the two brain hemispheres, were included in this study. Three of the children with CP, Subjects 6–8, had a subcortical lesion in the left hemisphere (LH), which affected movement of their right hand. Subjects 9 and 10 had a subcortical lesion in the right hemisphere (RH), which affected movement of their left hand. Informed consent was obtained from all subjects and their legal guardians. Except for Subjects 4 and 6, it was possible to attain a second visit for fNIRS measurements within two months of the first. These studies were performed under the approval of The University of Texas Southwestern Medical Center at Dallas (UTSW) Institutional Review Board protocol (IRB No. :042007-064).
Measurements
A continuous-wave (CW) fNIRS brain imager (CW-5, Techen Inc., Milford, Massachusetts) was used to map the HbO and Hb changes induced by motor cortex stimulation. The source-detector geometry is shown in Fig. 1a. Eight detectors were placed over each brain hemisphere to cover a relatively large area of the motor cortex. The geometrical arrangement of sources and detectors was attached onto the subjects’ heads by perforated Velcro straps. Eight laser sources emitted at and eight at , such that each optical fiber bundle delivered light of both wavelengths at each source location [circles in Fig. 1a], simultaneously. Each source bundle had up to four detectors [squares in Fig. 1a] within a distance, and each detector received signals from up to two source bundles. As a result, there were 28 possible source-detector channel combinations for each wavelength, as indicated by the straight lines connecting sources to detectors in Fig. 1a. Activation in cortical areas within the probes’ field of view was monitored simultaneously by all source-detector pairs, because the CW-5 enables all laser sources to be on at the same time with distinct modulation frequencies (, with an increment of ). The backreflected light detected was sampled at a rate of , which was later demodulated and downsampled to to reduce data-set sizes.
Figure 1.
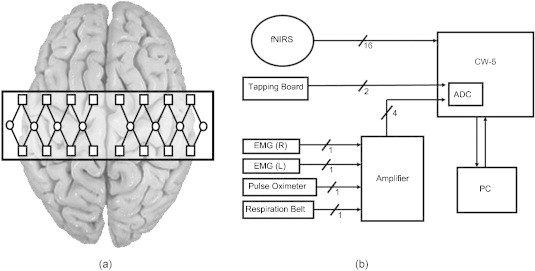
(a) Placement geometry of the fNIRS probes over the motor cortex. The circles represent sources, and the squares represent detectors. (b) Overall instrumentation setup.
In addition to measuring the cortical hemodynamic response by optical means, the finger-tapping, respiration, and cardiac pulsation patterns were also measured simultaneously for each subject. The finger-tapping rate was measured using a custom-built, capacitance-based tapping board that produced a bilevel voltage output for each tap. The respiration and cardiac pulsation measurements were amplified with a Brownlee Model 410 amplifier (AutoMate Scientific, Berkeley, California), and recorded by the CW-5 system. The respiration and cardiac measurements were amplified by a factor of 200 and , respectively. Breathing patterns were measured using a respiration belt with a piezoelectric transducer (Sleepmate Technologies, Glen Burnie, Maryland). The belt was wrapped around each subject’s lower chest while keeping the transducer away from the heart in order to prevent cardiac pulsation noise from leaking into the respiration measurement. Cardiac pulsation was measured using a pulse oximeter (Nellcor Inc., Boulder, Colorado) attached to the index finger on the hand not in use for tapping. In addition, movement of the forearm flexor muscles controlling the fingers was measured by electromyography [(EMG), B & L Engineering, Santa Ana, California]. The EMG measurements were not used in our filtering procedures but instead served as quality control sentinels for our measurements, making sure that the specified hand was the only hand tapping, while the other was kept still. A diagram of the overall instrumentation setup is shown in Fig. 1b, in which EMG (R) and EMG (L) stand for the EMG taken from the right forearm and left forearm, respectively. All nonoptical physiological measurements were fed into the CW-5 and digitized by an analog-to-digital converter, sampled at and later downsampled to , to reduce data-set sizes, as was done for the reflectance signals. Therefore, all signals had a common time base with the fNIRS measurements, which enabled the use of the reference physiological measurements in the subsequent filtering procedures described in Section 2E.
Protocol
The fNIRS probe placement was done according to the measured coronal (ear-to-ear) and sagittal (forehead-to-back-of-head) distances. The center of the probe set was placed at half the distance of the aforementioned measurements, which was considered the estimated midpoint of the motor cortex. A PowerPoint animation on a computer screen guided subjects through the finger-tapping protocol. No set tapping frequency was required of the pediatric subjects. Thus, the tapping frequency was self-paced, which resulted in average finger-tapping rates in the range within the tapping period. Tapping consisted of moving all fingers of one hand, while the wrist was held down by soft straps to keep it from moving. The subjects touched the tapping board while tapping and rested their hand on the board during the no-tapping intervals. The data acquisition protocol consisted of a baseline (no tapping), immediately followed by a series of ten consecutive epochs of of tapping and of rest, and ended with a baseline measurement, resulting in a total acquisition time of . Measurements were separately acquired for both left and right finger tapping. The subjects sat up straight with their head resting back in a quiet, dimly lit room. All subjects were video recorded during the measurements in order to verify, along with the aforementioned EMG measurements, that they performed the finger-tapping tasks properly.
Visualization of fNIRS Signals
Processing and visualization of the time-series reflectance data acquired by the CW-5 system is usually performed by the open-source HOMER software implemented in MATLAB (Mathworks, Natick, Massachusetts).20 HOMER filters the signal using low-pass and high-pass Butterworth filters to reduce noise from frequencies outside the known physiological range. Furthermore, the software applies principle component analysis (PCA) to reduce any global hemodynamic signals, detrends signals to reduce any long-term drifts, and averages the detected signal for individual source-detector pairs over user-selected time intervals of tapping and rest. Subsequently, using the reflectance measurements from all detector channels activation images are reconstructed by use of the Tikhonov perturbation solution to the photon-diffusion equation,21 which employs a regularized Moore–Penrose inversion scheme.22 The reconstructed, two-dimensional images represent maps of Hb and HbO changes on the brain cortex surface, within the detector’s field of view [rectangle in Fig. 1a] as a result of finger tapping. As Hb dynamics are highly correlated with those of HbO23 and have significantly lower amplitudes than the latter, making them susceptible to cross-talk from HbO24 and to interference from physiological artifacts, we have focused on the analysis of HbO dynamics only.
Filtering
In addition to detecting evoked hemodynamic changes, fNIRS is sensitive to cerebral hemodynamic fluctuations of systemic origin. Such systemic fluctuations can be caused by cardiac pulsation, respiration, and Mayer waves. For typical motor cortex activation protocols, the cortical hemodynamic response can be found in the frequency range, while physiological artifacts, such as cardiac pulsation, can be found between , respiration in the range, and Mayer waves at or lower.25, 26 Because there is a significant overlap between the frequency spectra of respiration and Mayer waves and of the hemodynamic response due to brain activity, and there is an overlap in frequency spectra of cardiac pulsation and the tapping frequency, bandpass filtering is not effective in removing such physiological artifacts. Previous attempts in the removal of these physiological artifacts from fNIRS signals have used component analysis27, 28, 29, 30 or adaptive filtering.30, 31, 32, 33, 34
Two types of component analysis have previously been used to filter fNIRS signals, PCA,27 and independent component analysis.28, 29, 30 Component analysis is advantageous because no additional measurements are used to track the physiological artifacts. The disadvantage of these algorithms is that they need training data to properly identify the physiological artifacts and that the physiological artifacts may contribute to the signal differently once the study begins, thus making it difficult to attribute each component to a specific artifact or to define the number of components needed to be removed.27
To better track the physiological artifacts, additional physiological measurements can be simultaneously taken or the physiological artifacts and the hemodynamic response can be modeled, as in adaptive filtering. The least mean square (LMS) filter is a finite impulse response (FIR) filter in which the filter coefficients adjust in order to minimize the least-squared error in fitting the measured noise measurements to the noisy signal.30, 31, 32, 33 The extended Kalman filter, otherwise, can filter the fNIRS signals by statistically modeling the physiological artifacts and the hemodynamic response due to brain activity.34 Unfortunately for the extended Kalman filter, a model of the hemodynamic response for children with CP is unknown and may vary, depending on the type of lesion the child has.
In order to overcome the disadvantages of individually filtering with component analysis or adaptive filtering, a combination of PCA and LMS filtering was used in this work. Using the additional reference physiological measurements, physiological artifacts that were within the same frequency range as the tapping frequency or the cortical hemodynamic response were filtered. More specifically, the fNIRS signals were first bandpass filtered between 0.01 and , using a Butterworth filter, to exclude frequencies of nonphysiological origin from the signal. Subsequently, baseline correction compensated for the baseline drift that could occur throughout the repeated cycles of activation and then PCA was applied to the fNIRS signals. In contrast to the baseline procedure implemented in HOMER, which uses only the first time point of the experiment as baseline reference, we corrected the baseline for each activation interval individually by taking the average of the of data before the beginning of each activation interval and then subtracting that value from the activation data in that interval. In the implementation of PCA, we empirically found that removing the two largest eigenvalues, which represented components in the frequency range of Mayer waves and cardiac pulsation physiological artifacts, resulted in the best compromise between the reducing global background signal while not substantially reducing the contrast of activation areas in the reconstructed images as was done by Zhang et al.27 In our analysis, we saw that the percent of the first two eigenvalues to the sum of all eigenvalues represented most of the baseline signal . In addition, in some cases the second eigenvector contributed to larger variations in the baseline signal than the first eigenvector. It was thus decided that the removal of the first two eigenvectors was optimal for removing baseline noise without compromising signal quality. Finally, the signal was adaptively filtered for respiration first, and then cardiac pulsation,35 using an LMS algorithm.31, 32, 33 The reference noise signals [Fig. 1b] that were used in this adaptive filtering procedure were first low-pass filtered at to reduce the contribution of electronic noise. No difference was found in the order in which the adaptive filters were applied, but using PCA after adaptive filtering was found to greatly decrease the signal quality.
Averaging
After filtering the signals as described in Section 2E and excluding the tapping-rest intervals that were not executed properly, as judged by video recording and EMG, data from all source-detector pairs were processed by HOMER. Because the sampling frequency was , each time point represents every . The properly executed tapping-rest intervals were averaged at each time point (total of 800 time points) giving a averaged temporal response for each source-detector pair. Activation images of the motor cortex were then reconstructed for every time point from the averaged temporal response of all source-detector pairs.17 Time-averaged HbO activation images were formed by averaging HbO activation images within a window that started after the tapping began to after the tapping had stopped ( relative to the beginning of each tapping interval) because that was the time window during which most of the activation signal was observed.
Identifying Areas of Activation
Activation areas were identified by a k-means clustering algorithm36 implemented in MATLAB. The algorithm was applied to identify areas of activation in two different images: the time-averaged HbO images and the two-dimensional spatiotemporal plots representing a concatenation of the averaged temporal responses of each pixel.
The algorithm employed three cluster means that were initialized at the maximum pixel value, minimum pixel value, and zero. The algorithm then placed each image pixel into one of the clusters, as judged by the closest Euclidean distance [Eq. 1] of the value of each pixel (of coordinates ) to the mean of the three clusters. However, if the minimum distance was equal between two clusters, then the pixel was placed into the cluster with the smaller mean
| (1) |
The algorithm recalculated the mean of each cluster after processing the whole image and repeated the process until the means of each cluster no longer changed, in which a maximum of 11 iterations were necessary for the time-averaged HbO images. The cluster that initially had a mean equal to the maximum pixel value in the image represented pixel values related to activation [Fig. 2a]. The cluster that initially had a mean equal to zero represented pixel values related to the baseline. Lastly, the cluster that initially had a mean equal to the minimum pixel value in the image represented deactivation.
Figure 2.
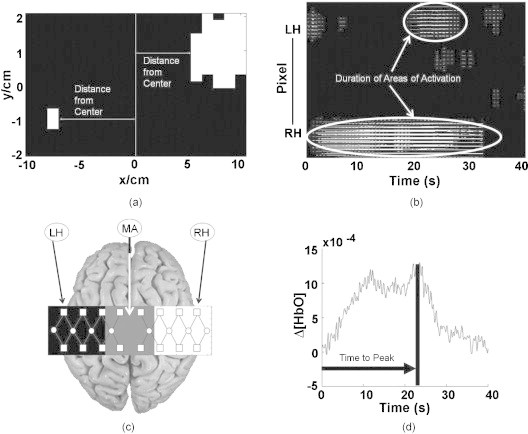
Pictorial descriptions of the spatial and temporal image metrics: (a) Measurement of distance from center for both hemispheres. (b) Duration was computed as the average temporal length of activation (white areas) per pixel. The pixels were concatenated from the LH to the RH. (c) The area difference metric measured as the difference in activation area between the middle area (MA) and the contralateral hemisphere to the tapping hand (i.e., RH for left finger tapping or LH for right finger tapping). (d) Time-to-peak measurement in which the arrow represents the time that the signal took to reach its peak from the beginning of the tapping interval.
Similarly, the temporal responses of each pixel were clustered to identify activation, baseline, and deactivation. The averaged temporal responses of each pixel were concatenated from the LH to RH to give a two-dimensional plot, in which the y-axis represented the pixels and the x-axis represented time. Then the previously discussed k-means clustering algorithm36 was applied to the two-dimensional plot, in which a maximum of 20 iterations were needed to identify the three clusters. The pixels with activation in the two-dimensional plot [Fig. 2b] showed the time and location of areas of activation during finger tapping. Subsequently, a number of spatial and temporal metrics were derived from the resulting time-averaged and two-dimensional activation images, as described here below.
Metrics Derived from the Reconstructed Images
We identified spatial metrics (distance from center and area difference) from the time-averaged HbO images and temporal metrics (duration and time-to-peak) from the two-dimensional plots. The identified spatial and temporal metrics presented differences between controls and children with CP. We have also identified similar temporal patterns spatially over the motor cortex, as will be shown in Section 3, which has great promise for differentiating between the two subject groups.
Distance from center
To show differences in activation location in the time-averaged HbO images between healthy controls and children with CP, a vertical line was used as a reference at the center of the motor cortex and the horizontal distance between the near edge of the activation area closest to the centerline (distance from center) was measured for each hemisphere [Fig. 2a].37 Since the distance from center metric is dependent on the identification of areas of activation, this metric was not quantified in the cases where there was no activation identified in the ipsilateral or contralateral hemisphere relative to the tapping hand.
Area difference
Because it was observed that children with CP consistently had activation closer to the motor cortex centerline, a metric was defined to quantify the amount of activation observed by this difference. The metric was defined as the difference in area of activation (area difference) occurring near the edge of the contralateral hemisphere of the tapping hand and the middle region of the motor cortex. More specifically, the detector field of view was divided in three nearly equal areas of in length and a width of for the RH and LH and for the motor cortex center [Fig. 2c]. Areas of activation in each subdivision of the motor cortex were identified using the same clustering algorithm previously used to identify activation over the entire motor cortex (see Section 2G). The metric of interest for differentiating between the two subject groups was defined as the difference of the identified activation area found by the clustering algorithm in the time-averaged HbO images between the contralateral hemisphere and the middle region of the motor cortex.
Duration and time-to-peak
The temporal aspects of the change in HbO were quantified with metrics (duration and time-to-peak) devised from the two-dimensional plots [Fig. 2b]. Lines of activation in these two-dimensional plots represented the change of HbO in each pixel that was above baseline, as identified by the activation cluster from the clustering algorithm. The length of these lines therefore represented the duration of activation for each pixel [Fig. 2b]. The metric of duration was then defined as the average value of activation duration over all pixels. Additionally, the average temporal response data were sorted to identify pixels with maximum activation from the two-dimensional plots, as identified by the clustering algorithm. From the pixels with maximum activation, the average time difference between the beginning of the tapping interval and the time point of maximum HbO change was defined as the time-to-peak metric [Fig. 2d].
Similarity
Image areas, which were spatially distinct from the primary activation region, were observed to have demonstrated temporal profiles of HbO change similar to those of the primary activation region. Because the amplitudes in HbO change of these secondary regions were lower in magnitude, they were not always assigned to the cluster of pixels with activation, as identified by the clustering algorithm discussed above.36 To identify these areas, a similarity concept was defined that quantified aspects of resemblance between the temporal profile of the maximum activation area and other regions in the motor cortex.
Only pixels that had a value greater than or equal to zero from the time-averaged HbO activation images were compared in the similarity analysis. Before checking the similarity between the temporal profiles of each pixel, these were first smoothed to remove high-frequency instrumentation noise using a third-order Savitzky–Golay FIR filter.38, 39 After smoothing, each pixel was normalized to the peak activation value during the tapping-rest interval because the similarity analysis focuses on the shape of activation curves and not their magnitude.
Subsequently, two metrics were defined for describing each pixel’s temporal activation profile. These were the angle defined by the tangent and the change of signal amplitude at every time point, as shown in Fig. 3a.40 A cost function was then defined to quantify the degree of similarity for these two metrics between the seed pixel (i.e., the peak activation pixel) and other pixels in the image. Though previous works have used the Euclidean distance to find the similarity between two time series,41, 42, 43 a dynamic time-warping (DTW)–based cost function was selected to measure similarity to accommodate for small changes in phase between the seed pixel and activation occurring elsewhere in the image.44, 45 A brief overview of how DTW was adapted to the fNIRS image analysis is explained next.
Figure 3.
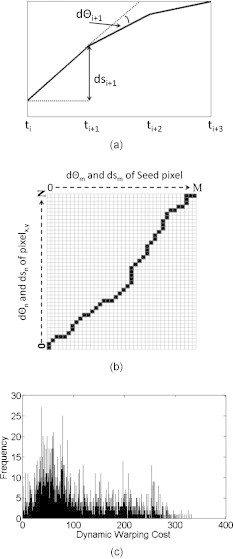
(a) Measurements made for the change in angle defined by the tangent and the change in amplitude for every time point, (b) illustration of a DTW path, and (c) histogram of the dynamic warping costs for all control subjects.
Suppose there are two time series, S and P, of length N and M, respectively, where , , and , . An matrix is then formed to align the two sequences in which the entry consists of the distance, , of the two points and [i.e., ]. A warping path45 is then found in which a contiguous set of matrix elements defines a mapping between S and P [Fig. 3b] and that the warping cost, , is minimized such that
| (2) |
where K is the number of warping elements and is the distance found at . The warping path is subject to specific constraints such that the warping starts and finishes in diagonally opposite corners, steps are only allowed to adjacent cells (including diagonally adjacent cells), and each must be monotonically spaced in time.45 Furthermore, the time warping is globally constrained using the Sakoe–Chiba band,46 where (i.e., ). The purpose of this constraint is to prevent a relatively small section of one time series to be mapped to a relatively large section of another. In this case, a maximum of of one time series can be mapped to a single point of another (i.e., a shift of can be detected).
In this study, DTW was not directly applied to the pixel temporal responses, but to the two metrics that defined the shape of the temporal responses, and . matrices were formed to find the warping costs for both and . Instead of looking for the minimum warping cost for and separately, the warping cost was redefined such that in Eq. 2 is represented by
| (3) |
Subsequently, a threshold needed to be defined to identify the range of DTW cost corresponding to activation image pixels that were considered similar to the seed pixel. Because the dynamic warping cost is directly comparable between controls and subjects with CP, the dynamic warping costs of the controls, for both right and left finger tapping, were pooled together in a single histogram that presented the frequency of each dynamic warping cost for all control subjects [e.g., Fig. 3c]. Because there were no clear divisions found in the histogram, a k-means algorithm was used to divide the histogram into five levels, in which the clusters were initialized similar to that of Liu and Yu.47 Though the k-means algorithm could divide the histogram into more levels for a more stringent similarity definition, dividing it into five levels was empirically found to be sufficient for finding similar time series, as will be shown in Section 3. A flowchart of the similarity algorithm is shown in Fig. 4.
Figure 4.
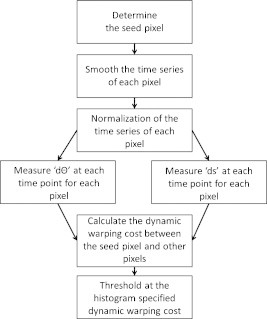
Block diagram of the similarity algorithm.
Statistical Analysis
Two-sampled t-tests were performed, using SAS 9.1 (SAS Institute Inc., Cary, North Carolina) to see if there was a significant difference of metric means between control subjects and ones with CP. In cases where the variances between the two subject groups were found to be significantly different , the Mann–Whitney test was used instead. The null hypothesis was defined as a zero difference in the mean between the two groups. For the cases where a statistically significant difference was found between the two subject groups, a post hoc power analysis was performed to validate the statistical power of the t-test, which indicates the probability of not having a false significant difference for the given subject population size.48
Results
Distance from Center
Visual inspection of activation patterns in children with CP suggested these subjects had time-averaged activation areas closer to the centerline of the motor cortex compared to controls. The distance from center metric was therefore defined (Section 2H1) to measure this distance. Figures 5a, 5b are bar graphs showing the distances separately for the RH (right horizontal columns) and LH (left horizontal columns) for control subjects (Subj1–Subj5), ones with right hemiparetic CP (Subj6–Subj8), and ones with left hemiparetic CP (Subj9–Subj10). In Figs. 5a, 5b, it is seen that controls consistently had activation further from the centerline in the ipsilateral hemisphere than in the contralateral hemisphere relative to the tapping hand. In contrast, the ipsilateral activation for children with CP was closer to the centerline, and in a few cases, it was even closer than the contralateral activation for the same subject.
Figure 5.
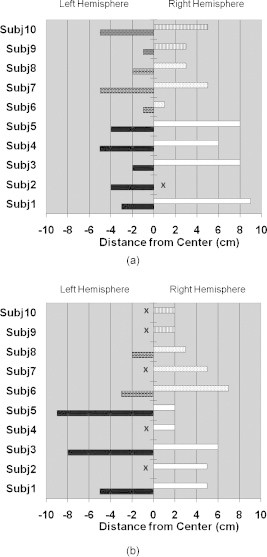
Bar graphs presenting the distance from center measurements from the time-averaged HbO activation images for (a) left finger tapping and (b) right finger tapping. The distances are presented separately for the RH (right horizontal columns) and LH (left horizontal columns) for control subjects (Subj1–Subj5, LH–black, RH–white), ones with right hemiparetic CP (Subj6–Subj8, LH–brick, RH–dots) and ones with left hemiparetic CP (Subj9–Subj10, LH–trellis pattern, RH–vertical lines). x indicates the exclusion of the measurement since no activation was identified in that hemisphere.
A high statistical significance was found , , Table 1) for the mean value difference in ipsilateral distance from center between controls and children with CP , but no significant difference was observed in the contralateral distance from center between controls and ones with CP .
Table 1.
Efficacy of the derived metrics for differentiating between controls and subjects with CP. Comparisons are made between the right or left finger tapping (RFT/LFT) for controls versus tapping with the affected hand for subjects with CP.
| Control RFT/LFT versus affected | Distancefrom center | Areadifference | Duration/time-to-peak | Area difference(similarity) | Distancefrom seed |
|---|---|---|---|---|---|
| Specificity (%) | 100 | 60 | 80 | 80 | 100 |
| Sensitivity (%) | 80 | 60 | 100 | 60 | 60 |
| PPV (%) | 100 | 60 | 83 | 75 | 100 |
| NPV (%) | 83 | 60 | 100 | 66 | 71 |
| Control RFT/LFT versus unaffected | |||||
| Specificity (%) | 100 | 60 | 80 | 80 | 100 |
| Sensitivity (%) | 60 | 20 | 60 | 20 | 60 |
| PPV (%) | 100 | 33 | 75 | 50 | 100 |
| NPV (%) | 71 | 43 | 66 | 50 | 71 |
Area Difference
Although the distance from center metric gave information about differences in activation location between controls and children with CP, this metric did not capture differences in the spatial extent of the corresponding activation areas. To quantify the latter, the area-difference metric was defined as described in Section 2H2.
In Fig. 6, the results of the area difference metric show that for controls the area of activation in the contralateral hemisphere of tapping was always greater than the activation in the middle area of the motor cortex by at least . Three of the five subjects with CP (Subjects 6, 9, and 10) showed greater activation area in the middle portion of the motor cortex when tapping with one of their two hands. Interestingly, Subject 8, a right hemiparetic subject, presented an area difference of when right finger tapping (i.e., even though he was using his affected hand). Subject 7 had similar results as the controls for this metric. Although in some cases, subjects with CP presented larger activation in the middle region of the motor cortex than in the contralateral hemisphere, for the current population size there was no significant difference in area difference metrics between controls and children with CP . Also, there was no statistically significant difference in the mean values of the area difference metric when subjects with CP were tapping with their affected or unaffected hand (, ).
Figure 6.
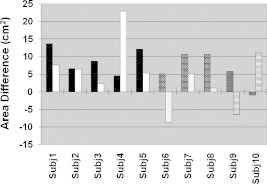
Activation area difference for control subjects (Subj1–Subj5, left tapping–black, right tapping–white), ones with right hemiparetic CP (Subj6–Subj8, left tapping–brick, right tapping–dotted), and ones with left hemiparetic CP (Subj9–Subj10, left tapping–trellis pattern, right tapping–horizontal lines).
Duration and Time-to-Peak
The ratio of duration over time-to-peak was identified as a potentially useful metric for differentiating between the two subject groups. With one exception, the controls had a duration over time-to-peak ratio of for both right and left finger tapping (Fig. 7), i.e., duration was greater than or equal to time-to-peak. In contrast, duration was found to be less than the time-to-peak when children with CP were tapping with their affected hand (right, dotted column for Subjects 6–8 and left, trellis patterned column for Subjects 9 and 10). In addition, when children with CP were tapping with their unaffected hand, this ratio often assumed values that were substantially higher or lower than unity for some individuals, though no consistent pattern was observed.
Figure 7.
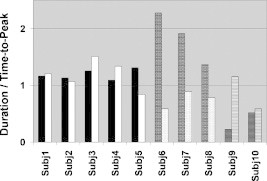
Bar graph presenting the ratio of duration over time-to-peak metrics for control subjects (Subj1–Subj5, left tapping–black, right tapping–white), ones with right hemiparetic CP (Subj6–Subj8, left tapping–brick, right tapping–dotted), and ones with left hemiparetic CP (Subj9–Subj10, left tapping–trellis pattern, right tapping–horizontal lines).
No significant difference was observed between the mean values of duration over time-to-peak ratios between controls that were left finger tapping or right finger tapping . Subsequently, these results were pooled into a single normal subject group and a two-sampled t-test verified the high statistical significance (, , Table 1) in the difference between the means of the duration over time-to-peak ratios between controls and children with CP tapping with their affected hand .
Similarity
By using the above-described similarity algorithm (Section 2H4), pixel areas were identified having similar temporal profiles of HbO concentration change with respect to the primary area of activation. It was found that these similar areas did not necessarily coincide with the areas having the highest activation in the time-averaged images, but could have an HbO concentration change in the baseline range. Furthermore, subjects with CP demonstrated a greater diversity of temporal patterns, as quantified by the range of DTW penalty term values, within the areas of activation than control subjects. To illustrate these points, a sample activation image [Fig. 8a], an image processed by an activation cluster algorithm [Fig. 8b], an image processed by the similarity algorithm [Fig. 8c], and the color-coordinated normalized, average temporal profiles of the areas in the similarity image [Fig. 8d] are shown for a control subject. For purposes of comparison, the same types of images are shown for a subject with CP [Figs. 8e, 8f, 8g, 8h]. It is seen that the area of activation identified by the clustering algorithm [Fig. 8b] does not coincide with the area of pixels with similar activation [Fig. 8c]. In contrast, children with CP had areas of activation [Fig. 8e] with dissimilar activation profiles, except for pixels immediately neighboring the seed-pixel location [Fig. 8g]. The temporal profiles of activation are also shown [Figs. 8d, 8h], in order to provide a visual example of the degree of similarity between the seed pixel (black curves) and the most similar cluster of pixels (level 1). Because the dynamic warping costs of the control subjects were pooled together, not all subjects individually present all five levels of similarity as seen in Figs. 8c, 8d.
Figure 8.
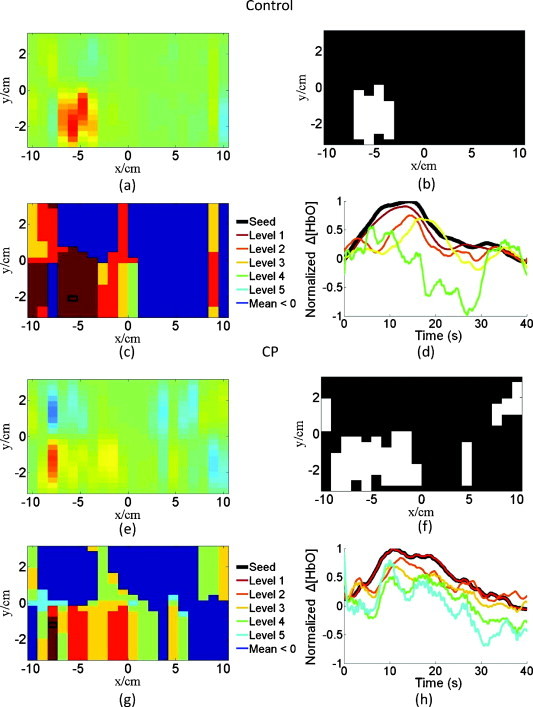
Images shown are for a control subject, Subject 2, in which the (a) normalized image of the average change in HbO concentration, (b) the thresholded activation image, (c) the similarity image with color-coordinated levels, and (d) the corresponding average temporal responses for the color-coordinated similarity levels are shown. Not all five levels of similarity are seen for this control subject. The images at the bottom are for a subject with CP, Subject 7, in which (e–h) correspond to (a–d) for the control subject.
The area difference of the most similar pixels to the primary activation area (level 1) in the similarity images was investigated as a metric for differentiating between controls and children with CP. In Fig. 9, it is seen that controls typically had a greater area difference than children with CP. This difference between the mean values of area difference of controls and children with CP was indeed found to be significant (, , Table 1). The results for area difference demonstrate that the similarity concept can highlight differences between controls and subjects with CP much better than the corresponding metric derived from applying a threshold algorithm to the same subject’s activation images. Additionally, there was no discernible correlation between area difference and whether children with CP were tapping with their affected or unaffected hand (, ).
Figure 9.
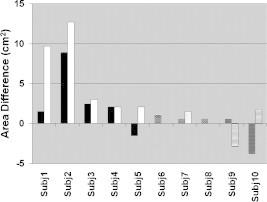
Area difference in similarity images for control subjects (Subj1–Subj5, left tapping–black, right tapping–white), ones with right hemiparetic CP (Subj6–Subj8, left tapping–brick, right tapping–dotted), and ones with left hemiparetic CP (Subj9–Subj10, left tapping–trellis pattern, right tapping–horizontal lines).
Although children with CP had smaller areas of similarity, their most similar areas (level 1) were spatially closer to their seed pixel than in controls (Fig. 10). To present this difference the maximum distance among the most similar areas (level 1) from the seed pixel was found, in which the difference between the controls and children with CP was significant (, , Table 1). The larger distance in controls can be explained by some similarity areas being seen in the ipsilateral hemisphere and the larger areas of similarity neighboring the seed pixel, whereas in children with CP this is not the case. Furthermore, there is no significant difference when the children with CP were tapping with their affected or unaffected hand .
Figure 10.
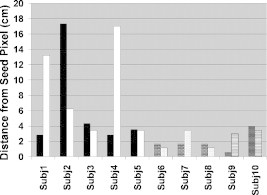
Maximum distance of the pixel with the highest similarity (level 1) to the seed pixel in similarity images for control subjects (Subj1–Subj5, left tapping–black, right tapping–white), ones with right hemiparetic CP (Subj6–Subj8, left tapping–brick, right tapping–dotted), and ones with left hemiparetic CP (Subj9–Subj10, left tapping–trellis pattern, right tapping–horizontal lines).
Validation Analysis to Differentiate between Controls and Subjects with CP
Though four of the five presented metrics gave statistically significant differences between controls and children with CP (distance from center, duration/time-to-peak, area difference of similarity images, and maximum distance from seed), there were still false positives or false negatives found. Table 1 shows the sensitivity, specificity, positive predictive value (PPV), and negative predictive value (NPV) for each of these metrics. Subjects were considered to be in the CP group if their metrics were beyond one standard deviation of the corresponding mean value of the same metric for controls.
From Table 1, it is clear that each fNIRS metric performs differently in each category. For example, the specificity, sensitivity, PPV, and NPV values for area difference in activation images are low, which supports the t-test conclusion that this metric may be less useful for differentiating between the two subject populations. On the other hand, distance from center and distance from seed clearly tell if a subject is a control (, ), while duration/time-to-peak clearly tells if a subject is in the CP group (, ). However, the area difference of similarity does not clearly show if a subject is a control or with CP, but it does have a higher specificity (80%) than the area difference in activation images (60%). Because no single metric has 100% success, an approach for distinguishing between the two subject populations where multiple metrics are quantified is warranted.
Repeatability
The exact anatomical placement of probes and the quality of optical contact with the scalp are common causes of concern for the repeatability of fNIRS measurements. To reduce such concerns in this study, measurements were performed twice for four subjects in each group (Table 2). As an example, the reflectance time series for the source-detector pair with maximum signal, which was the same for both visits, are presented in Figs 11a, 11b for a control subject (Subject 2) and for a subject with CP (Subject 8) tapping with their right hand. It is seen that these time-series signals, as well as the reconstructed activation and activation-threshold images [Figs. 11c, 11d] have similar patterns for both visits. Furthermore, spatial metrics (distance from center and area difference) were quantified for both visits and a paired t-test was performed on these metrics for each subject group. For both groups, there was no significant difference in these metrics between the two visits (Table 2, X is shown when no activation was found in the ipsilateral hemisphere). The repeatability findings were similar for all other metrics (not shown).
Table 2.
The ipsilateral distance from center and area difference metrics measured in two separate visits for four subjects in each group.
| Control | Ipsilateral distance from center(cm) | Area difference | |||
|---|---|---|---|---|---|
| Visit 1 | Visit 2 | Visit 1 | Visit 2 | ||
| LFT | Subject 1 | 5 | 6 | 41.04 | 42.75 |
| Subject 2 | X | X | 19.95 | 19.95 | |
| Subject 3 | 8 | 6 | 26.22 | 26.22 | |
| Subject 5 | 9 | 6 | 36.48 | 34.20 | |
| RFT | Subject 1 | 9 | 8 | 22.80 | 23.94 |
| Subject 2 | X | X | 19.38 | 19.38 | |
| Subject 3 | 8 | 8 | 6.84 | 15.39 | |
| Subject 5 | 8 | 8 | 15.96 | 16.53 | |
| Paired t-test | |||||
| LFT | Subject 7 (RH) | X | 7 | 31.92 | 30.78 |
| Subject 8 (RH) | 2 | 3 | 31.92 | 31.35 | |
| Subject 9 (LH) | 2 | 2 | 17.67 | 15.96 | |
| Subject 10 (LH) | 2 | 3 | |||
| RFT | Subject 7 (RH) | 5 | 4 | 15.39 | 15.39 |
| Subject 8 (RH) | 3 | 2 | 3.42 | 5.70 | |
| Subject 9 (LH) | X | 3 | |||
| Subject 10 (LH) | X | 5 | 33.63 | 35.91 | |
| Paired t-test | |||||
X is shown when no activation was found in the ipsilateral hemisphere.
Figure 11.
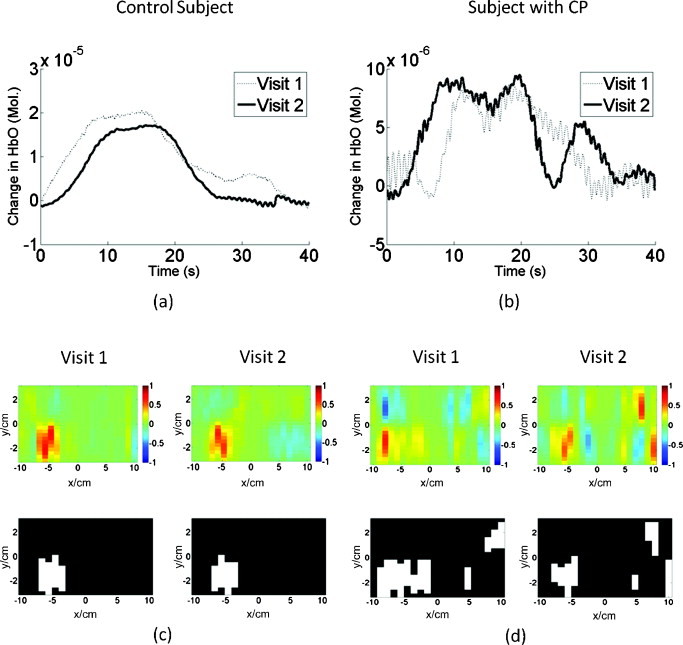
Repeated fNIRS measurements for a control (Subject 2) and a subject with CP (Subject 8) performing right finger tapping: (a,b) show the time-series reflectance patterns for the same source-detector pair, while (c,d) show the activation images (top) and their corresponding activation-threshold images (bottom) for each visit.
Discussion and Conclusions
A CW fNIRS instrument was used to image patterns of change in HbO concentration in the motor cortex of five control children and five children with CP for a finger-tapping protocol. A signal-processing method, involving a combination of bandpass filtering, PCA, and adaptive filtering, was developed to remove global physiological artifacts, such as respiration, cardiac pulsation, and Mayer waves. The tapping-rest intervals were averaged together at each time point giving a averaged tapping-rest response for each source-detector pair. Images were subsequently reconstructed for each time point from the averaged temporal responses of all source-detector pairs. These series of images, or their corresponding time-averaged images, were processed by a clustering algorithm to identify the location and spatial extent of areas of activation. Additionally, the same reconstructed images were analyzed by a similarity algorithm that identified areas of lower change in HbO concentration compared to primary activation areas that nevertheless had similar temporal change patterns to the latter. Therefore, the similarity algorithm unveiled secondary activation areas that to our knowledge have not been studied before. Because of their smaller activation values, compared to the primary activation region, these areas were not easily discernible in the time-averaged activation images and were considered to be in the range of the baseline data according to the clustering algorithm.
After application of the activation threshold or of the similarity algorithm, a number of metrics were quantified in the processed images. These metrics were either spatial (distance from center and area difference) or temporal (duration and time-to-peak) in nature. The thresholded activation images presented differences between controls and children with CP using the distance from center metric and the ratio of duration over time-to-peak. Similarity analysis provided the area difference metric (Fig. 9) with higher statistical significance for differentiating between controls and children with CP compared to the corresponding metric from thresholded time-averaged images of activation (Fig. 6). Moreover, similarity displayed a significant difference in spatial location of areas of similarity by measuring the maximum distance of the most similar areas of the seed pixel from the seed pixel. It was found that some of the above-described metrics could differentiate between controls and children with CP with high statistical significance and statistical power, despite the small numbers of subjects involved, as summarized in Table 3. It is important to point out that the identified differences between subject populations for any one metric were deduced by statistical analysis. Therefore, a subject with CP may have had some metrics with values that overlapped with the range of corresponding values for control subjects. It is conceivable that as the subject population increases with future fNIRS studies, it will be possible to differentiate more clearly between subject groups by training a classification algorithm (e.g., a support vector machine or a neural network)47 to accept as an input a set of fNIRS image metrics for each individual and correctly classify them.
Table 3.
Summary of results of the differences found between controls and children with CP.
| Metric | p value | Statistical power |
|---|---|---|
| Distance from center(Ipsilateral hemisphere of activation image) | 0.98 | |
| Duration/time-to-peak(CP affected hand, activation image) | 0.0002 | 0.99 |
| Area differencea(Similarity image) | 0.0383 | 0.77 |
| Maximum distance from the seed pixela(Similarity image) | 0.0223 | 0.73 |
Indicates the use of the Mann-Whitney test instead of a two-sampled t-test.
Although fNIRS may not be needed for the initial diagnosis of the CP condition, it can become a practically implementable method that will enable clinicians to study cortical plasticity. The analysis methods presented above offer quantitative tools that may help differentiate between individuals that appear to have the same CP disability phenotype as quantified by standard upper extremity motor skill classifications schemes (e.g., MACS, SHUEE, and Nine Hole Peg Test).4, 5, 6 In addition, the current work is a first step toward the endeavor to establish fNIRS as an easily accessible tool for monitoring plastic changes in the cortex of patients with CP during and after therapy, which should be feasible as recent fMRI studies have indicated.49, 50, 51, 52
Acknowledgments
This work was supported by a grant from the William Randolph Hearst Foundation and The United Cerebral Palsy Research and Educational Foundation. We also acknowledge the clinical staff at the Texas Scottish Rite Hospital in Dallas for its time and support. We show our gratitude to Dr. George Kondraske of the University of Texas at Arlington for providing the tapping board.
References
- Rice J., Russo R., Halbert J., Essen P., and Haan E., “Motor function in old children with cerebral palsy in the South Australian population,” Dev. Med. Child Neurol. 51, 551–556 (2009). 10.1111/j.1469-8749.2008.03182.x [DOI] [PubMed] [Google Scholar]
- Kulak W., Sobaniec W., Kuzia J., and Bocknowski L., “Neurophysiologic and neuroimaging studies of brain plasticity in children with spastic cerebral palsy,” Exp. Neurol. 198, 4–11 (2006). 10.1016/j.expneurol.2005.11.014 [DOI] [PubMed] [Google Scholar]
- Eyre J. A., “Corticospinal tract development and its plasticity after perinatal injury,” Neurosci. Biobehav Rev. 31, 1136–1149 (2007). 10.1016/j.neubiorev.2007.05.011 [DOI] [PubMed] [Google Scholar]
- Eliasson A. C., Krumlinde-Sundholm L., Rösblad B., Beckung E., Arner M., Öhrvall A. M., and Rosenbaum P., “The manual ability classification system (MACS) for children with cerebral palsy: scale development and evidence of validity and reliability,” Dev. Med. Child Neurol. 48, 549–554 (2006). 10.1017/S0012162206001162 [DOI] [PubMed] [Google Scholar]
- Davis J. R., Peace L. C., Wagner L. V., Gidewall M., Blackhurst D. W., and Roberson W. M., “Validation of the Shriners Hospital for Children upper extremity evaluation (SHUEE) for children with hemiplegic cerebral palsy,” J. Bone Jt. Surg. 88, 326–333 (2006). 10.2106/JBJS.E.00298 [DOI] [PubMed] [Google Scholar]
- Oxford Grice K., Vogel K. A., Le V., Mitchell A., Muniz S., and Vollmer M. A., “Adult norms for a commercially available nine hole peg test for finger dexterity,” Am. J. Occup. Ther. 57(5), 570–573 (2003). [DOI] [PubMed] [Google Scholar]
- Wilke M., Holland S. K., Myseros J. S., Schmithorst V. J., and Ball W. S., “Functional magnetic resonance imaging in pediatrics,” Neuropediatrics 34(5), 225–233 (2003). 10.1055/s-2003-43260 [DOI] [PMC free article] [PubMed] [Google Scholar]
- Krageloh-Mann I. and Horber V., “The role of magnetic resonance imaging in furthering understanding of the pathogenesis of cerebral palsy,” Dev. Med. Child Neurol. 49, 144–151 (2007). 10.1111/j.1469-8749.2007.00144.x [DOI] [PubMed] [Google Scholar]
- Carr L. J., Harrison L. M., Evans A. L., and Stephens J. A., “Patterns of central motor reorganization in hemiplegic cerebral palsy,” Brain 116, 1223–1247 (1993). 10.1093/brain/116.5.1223 [DOI] [PubMed] [Google Scholar]
- Maegaki Y., Maeoka Y., Ishii S., Eda I., Ohtagaki A., Kitahara T., Suzuki N., Yoshino K., Ieshima A., Koeda T., and Takeshita K., “Central motor reorganization in cerebral palsy patients with bilateral cerebral lesions,” Pediatr. Res. 45, 559–567 (1999). 10.1203/00006450-199904010-00016 [DOI] [PubMed] [Google Scholar]
- Thickbroom G. W., Byrnes M. L., Archer S. A., Nagarajan L., and Mastaglia F. L., “Differences in sensory and motor cortical organization following brain injury early in life,” Ann. Neurol. 49, 320–327 (2001). 10.1002/ana.68 [DOI] [PubMed] [Google Scholar]
- Staudt M., Grodd W., Gerloff C., Erb M., Stitz J., and Krägeloh-Mann I., “Two types of ipsilateral reorganization in congenital hemiparesis. A TMS and fMRI study,” Brain 125, 2222–2237 (2002). 10.1093/brain/awf227 [DOI] [PubMed] [Google Scholar]
- Vandermereen Y., Davare M., Duque J., and Olivier E., “Reorganization of cortical hand representation in congenital hemiplegia,” Eur. J. Neurosci. 29, 845–854 (2009). 10.1111/j.1460-9568.2009.06619.x [DOI] [PubMed] [Google Scholar]
- Vandermereen Y., Sébire G., Grandin C. B., Thonnard J. L., Schlögel X., and De Volder A. G., “Functional reorganization of brain in children affected with congenital hemiplegia: fMRI study,” Neuroimage 20, 289–301 (2003). 10.1016/S1053-8119(03)00262-3 [DOI] [PubMed] [Google Scholar]
- Bunce S., Izzetoglu M., Izzetoglu K., Onaral B., and Pourrezaei K., “Functional near-infrared spectroscopy,” IEEE Eng. Med. Biol. Mag. 25(4), 54–61 (2006). 10.1109/MEMB.2006.1657788 [DOI] [PubMed] [Google Scholar]
- Schweiger M., Gibson J., and Arridge S. R., “Computational aspects of diffuse optical tomography,” IEEE Comput. Sci. Eng. 5(6), 33–41 (2003). [Google Scholar]
- Franceschini M., Fantini S., Thompson J., Culver J., and Boas D., “Hemodynamic evoked response of the sensorimotor cortex measured noninvasively with near-infrared optical imaging,” Psychophysiology 40, 548–560 (2003). 10.1111/1469-8986.00057 [DOI] [PMC free article] [PubMed] [Google Scholar]
- Hernandez L., Badre D., Noll D., and Jonides J., “Temporal sensitivity of event-related fMRI,” Neuroimage 17, 1018–1026 (2002). 10.1016/S1053-8119(01)91017-1 [DOI] [PubMed] [Google Scholar]
- Dilharreguy B., Jones R., and Moonen C., “Influence of fMRI data sampling on the temporal characterization of the hemodynamic response,” Neuroimage 19, 1820–1828 (2003). 10.1016/S1053-8119(03)00289-1 [DOI] [PubMed] [Google Scholar]
- Huppert T. J., Diamond S. G., Franceschini M. A., and Boas D. A., “HomER: a review of time-series analysis methods for near-infrared spectroscopy of the brain,” Appl. Opt. 48(10), D280–D298 (2009). 10.1364/AO.48.00D280 [DOI] [PMC free article] [PubMed] [Google Scholar]
- Kilmer M., Hansen P. C., and Espanol M. I., “A projection-based approach to general-form Tikhonov regularization,” SIAM J. Sci. Comput. (USA) 29(1), 315–330 (2007). 10.1137/050645592 [DOI] [Google Scholar]
- Wang J., “Recurrent neural networks for computing pseudoinverses of rank-deficient matrices,” SIAM J. Sci. Comput. (USA) 18(5), 1479–1493 (1997). 10.1137/S1064827594267161 [DOI] [Google Scholar]
- Huppert T. J., Hoge R. D., Diamond S. G., Franceschini M. A., and Boas D. A., “A temporal comparison of BOLD, ASL, and NIRS hemodynamic responses to motor stimuli in adult humans,” Neuroimage 29, 368–382 (2006). 10.1016/j.neuroimage.2005.08.065 [DOI] [PMC free article] [PubMed] [Google Scholar]
- Strangman G., Fraceschini M. A., and Boas D. A., “Factors affecting the accuracy of near-infrared spectroscopy concentration calculations for focal changes in oxygenation parameters,” Neuroimage 18, 865–879 (2003). 10.1016/S1053-8119(03)00021-1 [DOI] [PubMed] [Google Scholar]
- Sato T., Ito M., Suto T., Kameyama M., Suda M., Yamagishi Y., Ohshima A., Uehara T., Fukuda M., and Mikuni M., “Time courses of brain activation and their implications for function: a multichannel near-infrared spectroscopy study during finger tapping,” Neurosci. Res. 58, 297–304 (2007). 10.1016/j.neures.2007.03.014 [DOI] [PubMed] [Google Scholar]
- Julien C., “The enigma of Mayer waves: facts and models,” Cardiovasc. Res. 70, 12–21 (2006). 10.1016/j.cardiores.2005.11.008 [DOI] [PubMed] [Google Scholar]
- Zhang Y., Brooks D., Franceschini M., and Boas D., “Eigenvector-based spatial filtering for reduction of physiological interference in diffuse optical imaging,” J. Biomed. Opt. 10(1), 011014 (2005). 10.1117/1.1852552 [DOI] [PubMed] [Google Scholar]
- Kohno S., Miyai I., Seiyama A., Oda I., Ishikawa A., Tsuneishi S., Amita T., and Shimizu K., “Removal of the skin blood flow artifact in functional near-infrared spectroscopic imaging data through independent component analysis,” J. Biomed. Opt. 12(6), 062111 (2007). 10.1117/1.2814249 [DOI] [PubMed] [Google Scholar]
- Akgul C. B., Akin A., and Sankur B., “Extraction of cognitive-activity related waveforms from functional near-infrared spectroscopy signals,” Med. Biol. Eng. Comput. 44, 945–958 (2006). 10.1007/s11517-006-0116-3 [DOI] [PubMed] [Google Scholar]
- Morren G., Wolf M., Lemmerling P., Wolf U., Choi J. H., Gratton E., De Lethauwer L., and Van Huffel S., “Detection of fast neural signals in the motor cortex from function near infrared spectroscopy measurements using independent component analysis,” Med. Biol. Eng. Comput. 42, 92–99 (2004). 10.1007/BF02351016 [DOI] [PubMed] [Google Scholar]
- Zhang Q., Brown E., and Strangman G., “Adaptive filtering for global interference cancellation and real-time recovery of evoked brain activity: a Monte Carlo simulation,” J. Biomed. Opt. 12(4), 044014 (2007). 10.1117/1.2754714 [DOI] [PubMed] [Google Scholar]
- Zhang Q., Brown E., and Strangman G., “Adaptive filtering to reduce global interference in evoked brain activity detection: a human subject case study,” J. Biomed. Opt. 12(6), 064009 (2007). 10.1117/1.2804706 [DOI] [PubMed] [Google Scholar]
- Zhang Q., Strangman G., and Ganis G., “Adaptive filtering to reduce global interference in non-invasive NIRS measures of brain activation: How well and when does it work?,” Neuroimage 45, 788–794 (2009). 10.1016/j.neuroimage.2008.12.048 [DOI] [PMC free article] [PubMed] [Google Scholar]
- Abdelnour A. F. and Huppert T., “Real-time imaging of human brain function by near-infrared spectroscopy using an adaptive general linear model,” Neuroimage 46, 133–143 (2009). 10.1016/j.neuroimage.2009.01.033 [DOI] [PMC free article] [PubMed] [Google Scholar]
- Alexandrakis G., Khan B., Tian F., Asanani N., Behbehani K., Delgado M., and Liu H., “Translation of near infrared brain imaging to assess children with cerebral palsy,” Proc. SPIE 7180, 718005 (2009). 10.1117/12.809340 [DOI] [Google Scholar]
- MacQueen J., “Some methods for classification and analysis of multivariate observations,” in Proc. 5th Berkeley Symp. on Math. Stat. Prob., pp. 281, University of California, Berkeley (1967).
- Asanini N., “Study of NIRS based motor cortex activation patterns in cerebral palsy affected kids using image based metrics,” Masters Thesis, University of Texas at Arlington, Arlington (2008). [Google Scholar]
- Xie S., Xiang B., Yu L., and Deng H., “Tailoring noise frequency spectrum to improve NIR determinations,” Talanta 80, 895–902 (2009). 10.1016/j.talanta.2009.08.010 [DOI] [PubMed] [Google Scholar]
- Vaiphasa C., “Consideration of smoothing techniques for hyperspectral remote sensing,” Photogrammetry Remote Sens. 60, 91–99 (2006). 10.1016/j.isprsjprs.2005.11.002 [DOI] [Google Scholar]
- Sebastian T., Klein P., and Kimia B., “On aligning curves,” IEEE Trans. Pattern Anal. Mach. Intell. 25, 116–124 (2003). 10.1109/TPAMI.2003.1159951 [DOI] [PubMed] [Google Scholar]
- Agrawal R., Lin K. I., Sawhney H. S., and Shim K., “Fast similarity search in the presence of noise, scaling, and translation in times-series databases,” in Proc. 21st Int. Conf. on Very Large Databases, 490–501 (1995).
- Faloutsos C., Ranganathan M., and Manolopoulos Y., “Fast subsequence matching in time-series databases,” in Proc. ACM SIGMOD Conf., Minneapolis, pp. 419–429, ACM, New York: (1994).
- Keogh E., Chakrabarti K., Pazzani M., and Mehrotra S., “Dimensionality reduction for fast similarity search in large time series databases,” J. Knowl. Inf. Syst. 3(3), 263–286 (2001). 10.1007/PL00011669 [DOI] [Google Scholar]
- Xi X., Keogh E., Shelton C., and Wei L., “Fast time series classification using numerosity reduction,” in Proc. 23rd Int. Conf. on Machine Learning, pp. 1033–1040, ACM, Pittsburgh, PA (2006).
- Keogh E. and Ratanamahatana C. A., “Exact indexing of dynamic time warping,” J. Knowl. Inf. Syst. 7, 358–386 (2005). 10.1007/s10115-004-0154-9 [DOI] [Google Scholar]
- Sakoe H. and Chiba S., “Dynamic programming algorithm optimization for spoken word recognition,” IEEE Trans. Acoust., Speech, Signal Process. 26, 43–49 (1978). 10.1109/TASSP.1978.1163055 [DOI] [Google Scholar]
- Liu D. and Yu J., “Otsu method and K-means,” in Proc. of 9th Int. Conf. on Hybrid Intelligent Systems, pp. 344–349, IEEE Computer Society, Washington, DC (2009).
- Zar J. H., Biostastical Analysis, 3rd ed., Prentice Hall, pp. 65–178, Englewood Cliffs: (1996). [Google Scholar]
- Kamruzzaman J. and Begg R. K., “Support vector machines and other pattern recognition approaches to the diagnoses of cerebral palsy gait,” IEEE Trans. Biomed. Eng. 53(12), 2479–2490 (2006). 10.1109/TBME.2006.883697 [DOI] [PubMed] [Google Scholar]
- You S., Jang S., Kim Y., Barrow I., and Hallett M., “Cortical reorganization induced by virtual reality therapy in children with hemiparetic cerebral palsy,” Dev. Med. Child Neurol. 47, 628–635 (2005). 10.1017/S0012162205001234 [DOI] [PubMed] [Google Scholar]
- Phillips J., Sullivan K., Burtner P., Caprihan A., Provost B., and Bernitsky-Beddingfield A., “Ankle dorsiflexion fMRI in children with cerebral palsy undergoing intensive body-weight-supported treadmill training: a pilot study,” Dev. Med. Child Neurol. 49, 39–44 (2007). [DOI] [PubMed] [Google Scholar]
- Sutcliffe T. L., Logan W. J., and Fehlings D. L., “Pediatric constraint-induced movement therapy is associated with increased contralateral activity on function magnetic resonance imaging,” J. Child Neurol. 24(10), 1230–1235 (2009). 10.1177/0883073809341268 [DOI] [PubMed] [Google Scholar]


