

Abstract
Background
The aim of this study was to evaluate the value of T1/T2-weighted imaging (T1/T2WI) registration to reduce the postbiopsy hemorrhage effect for prostate cancer localization on prostate magnetic resonance imaging (MRI).
Methods
Twenty-one men with pathology-proven prostate cancer who underwent preoperative MRI in a single institution were selected. The zonal anatomy was divided into 16 sections. T2WI, T1/T2-weighted registered imaging (T1/T2RI), T2WI combined with diffusion-weighted imaging (T2WI + DWI), and T1/T2RI combined with DWI (T1/T2RI + DWI) were scored for the likelihood of cancer by two radiology faculty members and two trainees, and were compared with histology results. Areas under the receiver operating characteristics curve (AUCs) were used to assess diagnostic accuracy.
Results
For the trainees (Reader 3 and Reader 4), the AUC values were significantly higher (P < 0.05) for T1/T2RI (0.60 and 0.62, respectively) than for T2WI (0.54 and 0.56, respectively) in tumor detection, whereas no significant difference was observed for faculty members. There was no significant difference in AUC values between T1/T2RI and T2WI + DWI for all readers except for Reader 1. There was no additional diagnostic benefit for adding DWI with T1/T2RI for all readers.
Conclusions
T1/T2WI registration is a feasible technique. For less experienced readers, T1/T2RI is better than T2WI in localization of prostate cancer.
Keywords: Biopsy, Hemorrhage, Image registration, Magnetic resonance imaging, Prostate neoplasms
Introduction
The need for the early detection and localization of prostate cancer based on noninvasive magnetic resonance imaging (MRI) has increased with the emergence of local targeted therapies as alternatives to radical prostatectomy or radiation therapy.1–4 However, despite the expectations that MRI would be useful for primary detection and localization of prostate cancer, it is an unsatisfactory imaging modality because of its limited diagnostic accuracy. Therefore, MRI is currently performed for local staging of prostate cancer confirmed by transrectal ultrasonography-guided biopsy beforehand. However, this routine diagnostic process of prostate cancer has the additional negative effect of reducing the diagnostic performance of prostate MRI owing to postbiopsy hemorrhage. Postbiopsy hemorrhage presents hypointensity on T2-weighted imaging (T2WI) similar to the signal intensity of typical prostate cancer. Although several investigators have reported various methods and imaging techniques for reducing the influence of postbiopsy hemorrhage on T2WI,5–8 it is still a major problem for localization of the prostate cancer on MRI.
T1-weighted imaging (T1WI) is often helpful for distinguishing hemorrhage from background tissue, although abnormal lesion such as prostate cancer is indistinguishable due to its poor tissue contrast. Thus, we hypothesized that if we could automatically suppress the signal intensity of hemorrhage on T2WI using its T1 signal intensity, T2 signal intensity of the prostate cancer would be more conspicuous and the diagnostic performance of prostate MRI would be improved. This hypothesis has motivated investigation of the potential usefulness of imaging registration technique by summation of the different signal intensities of hemorrhage from T1WI and T2WI (Fig. 1).
Fig. 1.
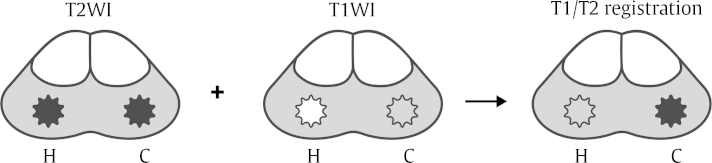
The basic concept of T1/T2-weighted imaging (T1/T2WI) registration. The signal intensity of hemorrhage (H) is same as that of prostate cancer (C) on T2WI; however, it is different on T1WI. To reduce the hemorrhage effect on T2WI, any T1 signal intensity above a selected threshold value is superimposed on T2WI using the imaging registration technique. After undergoing this process, T2 signal intensity of the prostate cancer would be more conspicuous, whereas that of the hemorrhage would be suppressed.
Therefore, we aimed to evaluate the feasibility of T1/T2WI registration technique for reducing the postbiopsy hemorrhage effect on prostate MRI and to assess the diagnostic accuracy of T1/T2-weighted registered imaging (T1/T2RI) for detecting prostate cancer in comparison with T2WI, T2WI combined with diffusion-weighted imaging (T2WI + DWI), and T1/T2RI combined with DWI (T1/T2RI + DWI) in the same patients. Histopathologic sections were used as the reference standard.
Materials and methods
Study populations
Our institutional review board approved this retrospective study and waived the requirement for informed consent. We enrolled 25 men who underwent 1.5-T prostate MRI for the local staging of prostate cancer in a single institution from March to October 2009. The inclusion criteria were as follows: (1) patients in whom prostate cancer had been confirmed by transrectal ultrasonography-guided biopsy within 2 months before undergoing MRI, and in whom radical prostatectomy was performed; (2) patients who had available T1/T2RI generated using an in-house software program, and (3) patients who had available reconstructed whole-mount step-section pathologic tumor maps using an in-house software program after prostatectomy. We excluded patients (1) who had previous prostate cancer treatment or (2) for whom technical problems had interfered with the use of software programs. Among the 25 patients, four were excluded due to the following reasons: technical error of in-house software program (n = 3) and previous history of hormone therapy (n = 1). As a result, 21 patients (mean age, 68 years ± 5 years; range, 60–75 years) who satisfied the criteria were included for analysis.
MRI protocol
MRI was performed on a 1.5-T scanner (Gyroscan Intera 1.5-T, Philips Medical Systems, Best, The Netherlands) using a pelvic phased-array coil (SENSE-Flex-M coil, Philips Medical Systems). According to the standard prostate MRI protocol at our institution, the images were obtained including transverse T2-weighted [repetition time/echo time (TR/TE), 5,900–6,100/120 ms; section thickness, 4 mm; intersection gap, 1 mm; field of view, 150 × 150 mm; matrix, 512 × 512; number of excitations, 3] and T1-weighted fast spin-echo sequences (TR/TE, 425–600/8–10 ms; section thickness, 4 mm; intersection gap, 1 mm; field of view, 150 × 150 mm; matrix, 512 × 512; number of excitations, 3). DWI was performed using a single-shot echo-planar imaging technique (b value = 0 and 1,000 s/mm2) in the axial plane (TR/TE, 2,600–4,000/81 ms; section thickness, 5 mm; intersection gap, 1 mm; field of view, 220 × 220 mm; matrix, 256 × 256; number of excitations, 6 or 14).
Imaging registration processing
T1/T2RI was generated based on routine spin-echo sequences of T1WI and T2WI using the Prostate Fusion Tool software program, which was developed in the Visual Computing and Medical Imaging Laboratory (VCMI Lab) at the College of Information and Media, Seoul Women’s University, Korea (Fig. 2). Using this program, any signal intensity over a selected threshold value on T1WI was superimposed on T2WI within the specified boundary. In our study, we use the fixed threshold value of T1 signal intensity. The fixed optimal threshold value of T1 signal intensity was selected by a preliminary test using sample data, which was not included in our study.
Fig. 2.

Software program for T1/T2-weighted imaging (T1/T2WI) registration. Using the Prostate Fusion Tool software program, T1/T2-weighted registered imaging (A) is generated by designating a region of interest with four or more points on T2WI (B) and (C) T1WI. (D) Finally, T1/T2-weighted registered imaging can be compared with a photomicrograph of pathologic specimen.
Image analysis and interpretation
T2WI, T1/T2RI, and DWI were evaluated on a Picture Archiving and Communication Systems workstation (INFINITT Technology, Seoul, Korea). All images were reviewed by four radiologists, including two faculty members (H.J.L. and S.I.H., who had >20 years of experience and 16 years of experience interpreting prostate MRI, respectively) and two trainees (Y.J.B. and J.Y.Y., who are residents having 3 years of radiology experience). Although the readers were aware that the patients had prostate cancer, they were blinded to clinical data and pathologic results. They were provided with a description of the principle of image registration and some example before imaging interpretation.
T2WI, T1/T2RI, T2WI + DWI, and then T1/T2RI + DWI were independently reviewed. The imaging quality of T1/T2RI was analyzed according to three categories as follows: (1) good (no artifact); (2) adequate (the presence of minor image-degrading artifacts but feasible for imaging interpretation with moderate confidence); and (3) poor (the presence of major image-degrading artifacts enough to disturb imaging interpretation).
The zonal anatomy of the prostate was divided into 16 regions, modified from the result of the 2011 European Consensus Meeting.9 First, the prostate was divided into the base, middle, and apex regions. According to the description by Haider et al,10 the base was defined as the region extending from the most superior margin to the widest transverse diameter of the prostate. The middle was defined as the region between the widest transverse diameter of the prostate and the orifices of the ejaculatory ducts at the verumontanum. The apex was defined as the region inferior to the mid-region. The central gland comprising the transition zone and central zone was additionally divided into left and right halves from the base to apex, yielding six regions. The peripheral zone of the prostate was subdivided into four quarters (left lateral, left medial, right medial, and right lateral areas) at the middle and base, whereas it was subdivided into left and right halves at the apex. Thus, the middle and base of the prostate were composed of six regions each and the apex was composed of four regions. The reviewers assigned a score to each local region for the likelihood of cancer using the following 5-point index scale: 0, definitely no cancer; 1, probably no cancer; 2, possible cancer; 3, probable cancer; and 4, definite cancer.
Histopathologic analysis and image correlation
The prostate specimens were embedded in formalin after prostatectomy and then sliced from the apex to the base at 3–4-mm intervals. These slices were sectioned into two halves or four quarters to fit on a standard slide. An uropathologist (G.Y.C.) with over 25 years of experience outlined the region of cancer before it was digitally imaged. All sectioned slides were digitized and reconstructed into whole-mount sections automatically using the Pathology Stitching and Correction Tool software program, which was developed by the VCMI Lab at the College of Information and Media, Seoul Women's University, Korea. The region was considered positive for cancer if it contained tumor with a cross-sectional area that was greater than 0.5 cm2 on the fixed specimen and a Gleason score of 6 or higher.
For the purpose of radiologic–pathologic correlation, a radiologist reviewed the pathologic specimens in conjunction with MRI. MRI and pathologic step-section slices were paired based on anatomic landmarks and the approximate distance from the base or apex.
Statistical analyses
All the statistical analyses were performed using commercially available software (SPSS, version 18, 2010; SPSS, Chicago, IL, USA). P values less than 0.05 were considered statistically significant. Receiver operating characteristic curves were estimated separately for each region of the prostate using the maximum likelihood. The area under the receiver operating characteristics curve (AUC) of T1/T2RI was compared with T2WI, T2WI + DWI, or T1/T2RI + DWI for each reader. The diagnostic accuracy was estimated for differences between methods by choosing a threshold score of 2 or higher to indicate cancer, together with 95% confidence intervals (CIs), separately for each reader. Interobserver agreement was evaluated using the k statistic, which was interpreted based on the criteria of Landis and Koch.11
Results
The patients' characteristics are summarized in Table 1. Of the total 336 regions in 21 patients, 120 contained cancers that were greater than 0.5 cm2 with a Gleason score of 6 or higher. Among them, 67 cancers (55.8%) were located in the peripheral zone. The mean interval from MRI to surgery was 19 days (range, 7–38 days). In analysis of the imaging quality of T1/T2RI, all cases were classified into either adequate or good categories by all readers.
Table 1.
Patient characteristics.
| Characteristic | Value |
|---|---|
| Mean age (yr) | 68 (60–75) |
| Mean preoperative PSA level (ng/mL) | 7.645 (4.7–13.3) |
| Maximum Gleason score | |
| 6 | 1 |
| 7 | 18 |
| 8 | 2 |
| Pathologic stage | |
| T2a | 0 |
| T2b | 0 |
| T2c | 13 |
| T3a | 7 |
| T3b | 1 |
| Interval between biopsy and MRI (d) | |
| ≤14 | N = 9 |
| >14 | N = 12 |
| Mean tumor volume | 14 (1–80%) |
| Number of tumor nodulesa) | |
| In peripheral zone | 67 (55.8%) |
| In central zone | 53 (44.2%) |
MRI, magnetic resonance imaging; PSA, prostate-specific antigen.
Tumor nodule was counted if it was greater than 0.5 cm2 on the fixed specimen with a Gleason score of 6 or higher.
For faculty members, Reader 1 and Reader 2, no significant improvement of T1/T2RI (AUC values of 0.60 and 0.62, respectively) was observed in tumor detection compared with T2WI (AUC values of 0.60 and 0.62, respectively). However, the AUC values of T1/T2RI were significantly higher than those of T2WI for the trainees, Reader 3 (0.60 and 0.54, respectively, P = 0.03) and Reader 4 (0.62 and 0.56, respectively, P = 0.04; Fig. 3). As a result of adding DWI on T2WI, the AUC value of T2WI + DWI was significantly higher than that of T2WI for three of four readers. However, there was no additional benefit for adding DWI on T1/T2RI in tumor detection for all readers. When comparing AUC values between T2WI + DWI and T1/T2RI, Reader 1 achieved a significant higher AUC value for T2WI + DWI than for T1/T2RI (0.68 and 0.60, respectively, P = 0.02), whereas others showed no significant difference between T2WI + DWI and T1/T2RI.
Fig. 3.

Receiver operating characteristic curves for detection of prostate cancer on T2-weighted imaging (T2WI; dotted line) and T1/T2-weighted registered imaging (T1/T2RI, solid line). (A) For Reader 1, areas under the curve (AUCs) of both T2WI and T1/T2RI were 0.60 without statistical significance (P = 0.93). (B) For Reader 2, the AUCs of both T2WI and T1/T2RI were 0.62 without statistical significance (P = 0.97). (C) For Reader 3, the AUC was significantly higher (P = 0.03) for T1/T2RI (AUC = 0.60) than for T2WI (AUC = 0.54). (D) For Reader 4, the AUC was significantly higher (P = 0.04) for T1/T2RI (AUC = 0.62) than for T2WI (AUC = 0.56).
The diagnostic accuracy of all readers is summarized in Tables 2 and 3, using a threshold score of 2 or higher to indicate cancer. For trainees, the diagnostic accuracy was significantly higher for T1/T2RI than for T2WI (P = 0.002 and P < 0.001 for Reader 3 and Reader 4, respectively; Figs. 4 and 5). Especially for Reader 4, the diagnostic accuracy was significantly higher for T1/T2RI than for T2WI without overlap of the CIs [63.69%, (58.55–68.83); 95% CI vs. 52.98%, (47.64–58.32); 95% CI, P < 0.001]. When comparing diagnostic accuracy between T2WI + DWI and T1/T2RI, no significant difference was observed for all readers except for Reader 1 (T2WI + DWI vs. T1/T2RI = 66.37% vs. 53.27%, P = 0.001; Table 3). For all readers, the diagnostic accuracy between T1/T2RI and T1/T2RI + DWI was not found to have a significant difference.
Table 2.
Diagnostic accuracy of T2-weighted imaging versus T1/T2-weighted registered imaging for prostate cancer.a)
| T2WI | T1/T2RI | P | |
|---|---|---|---|
| Reader 1 | 59.23% (53.98–64.48)b) | 53.27% (47.97–58.60) | 0.088 |
| Reader 2 | 64.58% (59.47–69.67) | 64.29% (59.1–69.41) | >0.99 |
| Reader 3 | 58.63% (53.36–63.90) | 65.77% (60.70–70.84) | 0.002 |
| Reader 4 | 52.98% (47.64–58.32) | 63.69% (58.55–68.83) | <0.001 |
T2WI, T2-weighted image; T1/T2RI, T1/T2-weighted registered imaging.
Regions scored as 2 or higher were considered positive.
The 95% confidence intervals are shown in parentheses.
Table 3.
Diagnostic accuracy of T2-weighted imaging combined with diffusion-weighted imaging versus T1/T2-weighted registered imaging for prostate cancer.a)
| T2WI + DWI | T1/T2RI | P | |
|---|---|---|---|
| Reader 1 | 66.37% (61.31–71.42)b) | 53.27% (47.97–58.60) | 0.001 |
| Reader 2 | 66.96% (61.93–71.99) | 64.29% (59.1–69.41) | 0.507 |
| Reader 3 | 61.31% (56.10–66.52) | 65.77% (60.70–70.84) | 0.276 |
| Reader 4 | 70.24% (65.35–75.13) | 63.69% (58.55–68.83) | 0.084 |
T2WI + DWI, T2-weighted imaging combined with diffusion-weighted imaging; T1/T2RI, T1/T2-weighted registered imaging alone.
Regions scored as 2 or higher were considered positive.
The 95% confidence intervals are shown in parenthesis.
Fig. 4.

High specificity of T1/T2-weighted registered imaging in a 74-year-old man with prostate cancer. (A) T2-weighted imaging shows focal low signal intensity in the right lateral peripheral zone (arrow). It was scored as greater than 2 (possible cancer) by three readers. (B) T1-weighted imaging shows focal high signal intensity in that region (arrow), suggestive of hemorrhage. (C) After data processing, focal T2 low signal intensity in the same region (arrow) is suppressed on T1/T2-weighted registered imaging. It was scored as 0 or 1 by all readers. (D) Finally, tumor is not identified on the pathologic specimen (hematoxylin–eosin stain; original magnification, 1×) in the corresponding region (arrow).
Fig. 5.

Good conspicuity of prostate cancer on T1/T2-weighted registered imaging in a 67-year-old man. (A) T2-weighted imaging shows suspicious focal low signal intensity in the right posterior peripheral zone at the apex of the prostate (arrow). The interobserver agreement for this region was poor because it was unclear. (B) T1-weighted imaging shows focal high signal intensity in that region (arrow), suggestive of partial hemorrhage. (C) After data processing, this lesion is shown as a more conspicuous low signal intensity region with the relatively clear margin of the tumor (arrow) on T1/T2-weighted registered imaging. (D) A photomicrograph of the pathologic specimen (hematoxylin–eosin stain; original magnification, 1×) shows a tumor with Gleason score of 7 (outlined area with arrow) in the corresponding region.
The interobserver agreement for the detection of prostate cancer was all moderate on T2WI, T1/T2RI, T2WI + DWI, and T1/T2RI + DWI with kappa values of 0.47–0.58 among all readers.
Discussion
The imaging registration technique is widely used in radiologic fields such as breast dynamic contrast-enhanced MRI and MR angiography to improve the lesion detection rate. This technique is usually applied for differentiating one from surrounding tissue or for monitoring the interval change of the subject in serial follow-up. It is routinely used in rigid organs such as the brain; however, its use is less common in movable body organs.12–14 Imaging registration in the prostate, which is a relatively nonmovable and rigid organ, has been described in several publications, often for measurement of the prostate volume, guidance of image-based localized therapy, or fusion between MRI and the histologic specimen.15–18 To the best of our knowledge, the imaging registration technique has not yet been used as a potential technique for reducing the postbiopsy hemorrhage effect on prostate MRI.
Hypointensity of prostate cancer on T2WI is difficult to distinguish from that of prostatitis, benign prostatic hypertrophy, or postbiopsy hemorrhage.19 Among these factors, postbiopsy hemorrhage has the greatest ability to interfere with localizing the cancer on T2WI. Several authors proposed adjusting the time interval between biopsy and MRI to eliminate the influence of postbiopsy hemorrhage on MRI.5–7,20 However, this approach was not effective due to individual variation during the period of a full resolution of postbiopsy hemorrhage. Postbiopsy hemorrhage is inevitable on MRI in the current diagnostic process of prostate cancer. Barrett et al8 rather attempted to use postbiopsy hemorrhage for detection of prostate cancer with the hemorrhage exclusion sign on T1WI. In our study, we used the imaging registration technique for reducing postbiopsy hemorrhage effect on T2WI, based on the difference of the signal intensity on T1WI between cancer and hemorrhage.
Our results showed that the T1/T2WI registration technique was feasible for reducing the effect of postbiopsy hemorrhage on T2WI. In cases with obvious postbiopsy hemorrhage, hemorrhage was often misdiagnosed as prostate cancer on T2WI. This is more common with less experienced readers, although it was not statistically significant. In those cases, hypointensity of hemorrhage on T2WI was completely corrected using the image registration technique, and therefore, it showed almost the same signal intensity as the surrounding normal prostate tissue on T1/T2RI (Fig. 4). In cases with a small amount of postbiopsy hemorrhage, tumor extent is sometimes overestimated because of partially overlapped hemorrhage. In those cases, hypointensity of the prostate cancer became more conspicuous with clear margin on T1/T2RI than that on T2WI, because the partially overlapped hemorrhage was suppressed using the image registration technique (Fig. 5). Furthermore, the quality of T1/T2RI was acceptable for interpretation without severe misregistration artifact. Although there was the interface artifact between the hemorrhage and surrounding tissue in some cases, it was minor and negligible. The quality of T1/T2RI seems to be decided by the qualities of the routine T1WI and T2WI.
Another noticeable finding in our study was that the AUC values for T1/T2RI were significantly higher in detection and localization of prostate cancer in comparison with T2WI for radiology trainees [AUC value of 0.54 (T2WI) and 0.60 (T1/T2RI) for Reader 3, AUC value of 0.56 (T2WI) to 0.62 (T1/T2RI) for Reader 4, P < 0.05]. The experience level of radiologists can affect diagnostic performance with any imaging study. In particular, interpretation of prostate MRI is even more influenced by the reader experience.21–25 However, from our results, T1/T2RI could decrease this difference by improving diagnostic performance of less experienced readers. Less experienced readers had difficulty in distinguishing tumor from adjacent overlapped hemorrhage on T2WI because of lack of experience and unfamiliarity with minute morphologic differences between prostate cancer and hemorrhage. However, T1/T2RI is relatively more intuitive than T2WI by automatic subtraction of hemorrhage. It might help them identify the margin of tumors more clearly. Therefore, we think that T1/T2RI can be a good alternative option to improve diagnostic accuracy to localize prostate cancer for less experienced readers such as general radiologists or urologists.
In addition, there was no significant difference in diagnostic accuracy between T2WI + DWI and T1/T2RI. Unlike DWI, T1/T2RI does not require additional scan. T1/T2RI can be simply generated based on routine spin-echo T1WI and T2WI with postprocessing program. Therefore, it is easy to implement as a potential useful technique in the clinics. Theoretically, use of T1/T2RI can shorten the interpretation time and increase diagnostic confidence compared with side-by-side interpretation of T2WI and T1WI, which is the method performed in routine practice.
Our study had several limitations. First, this was a small retrospective study using 1.5-T MRI. Second, we used a pelvic phased-array coil on prostate MRI. Although higher signal-to-noise ratio could be achieved using an endorectal coil, we do not routinely use it at our institution because of patient discomfort. Third, misregistration artifacts were identified in some cases, even though they were all minor. Finally, although we tried to match MRI with pathology maps using anatomical landmark, the radiologic–pathologic correlation was still ambiguous. Despite these limitations, this is the first try to use the image registration technique for reducing postbiopsy hemorrhage effect in localization of prostate cancer. However, further large prospective studies are required to confirm the clinical value of T1/T2RI in localization of prostate cancer. If this procedure is successful, it can be a useful problem-solving technique and will help urologists recognize the tumor location preoperatively.
In conclusion, T1/T2WI registration is a feasible technique for reducing the postbiopsy hemorrhage effect. For less experienced readers, T1/T2RI is better than T2WI in localization of prostate cancer.
Conflicts of interest
None declared.
Acknowledgments
This study has received funding from the Basic Science Research Program through the National Research Foundation of Korea (NRF) funded by the Ministry of Education, Science and Technology (NRF-2010-0009271).
References
- 1.Cooperberg M.R., Broering J.M., Carroll P.R. Time trends and local variation in primary treatment of localized prostate cancer. J Clin Oncol. 2010;28:1117–1123. doi: 10.1200/JCO.2009.26.0133. [DOI] [PMC free article] [PubMed] [Google Scholar]
- 2.Stern J.M., Stanfield J., Kabbani W., Hsieh J.T., Cadeddu J.A. Selective prostate cancer thermal ablation with laser activated gold nanoshells. J Urol. 2008;179:748–753. doi: 10.1016/j.juro.2007.09.018. [DOI] [PubMed] [Google Scholar]
- 3.Bahn D.K., Lee F., Badalament R., Kumar A., Greski J., Chernick M. Targeted cryoablation of the prostate: 7-year outcomes in the primary treatment of prostate cancer. Urology. 2002;60:3–11. doi: 10.1016/s0090-4295(02)01678-3. [DOI] [PubMed] [Google Scholar]
- 4.Robinson J.W., Donnelly B.J., Saliken J.C., Weber B.A., Ernst S., Rewcastle J.C. Quality of life and sexuality of men with prostate cancer 3 years after cryosurgery. Urology. 2002;60:12–18. doi: 10.1016/s0090-4295(02)01679-5. [DOI] [PubMed] [Google Scholar]
- 5.White S., Hricak H., Forstner R., Kurhanewicz J., Vigneron D.B., Zaloudek C.J. Prostate cancer: effect of postbiopsy hemorrhage on interpretation of MR images. Radiology. 1995;195:385–390. doi: 10.1148/radiology.195.2.7724756. [DOI] [PubMed] [Google Scholar]
- 6.Qayyum A., Coakley F.V., Lu Y., Olpin J.D., Wu L., Yeh B.M. Organ-confined prostate cancer: effect of prior transrectal biopsy on endorectal MRI and MR spectroscopic imaging. AJR Am J Roentgenol. 2004;183:1079–1083. doi: 10.2214/ajr.183.4.1831079. [DOI] [PubMed] [Google Scholar]
- 7.Tamada T., Sone T., Jo Y., Yamamoto A., Yamashita T., Egashira N. Prostate cancer: relationships between postbiopsy hemorrhage and tumor detectability at MR diagnosis. Radiology. 2008;248:531–539. doi: 10.1148/radiol.2482070157. [DOI] [PubMed] [Google Scholar]
- 8.Barrett T., Vargas H.A., Akin O., Goldman D.A., Hricak H. Value of the hemorrhage exclusion sign on T1-weighted prostate MR images for the detection of prostate cancer. Radiology. 2012;263:751–757. doi: 10.1148/radiol.12112100. [DOI] [PMC free article] [PubMed] [Google Scholar]
- 9.Dickinson L., Ahmed H.U., Allen C., Barentsz J.O., Carey B., Futterer J.J. Magnetic resonance imaging for the detection, localisation, and characterisation of prostate cancer: recommendations from a European consensus meeting. Eur Urol. 2011;59:477–494. doi: 10.1016/j.eururo.2010.12.009. [DOI] [PubMed] [Google Scholar]
- 10.Haider M.A., van der Kwast T.H., Tanguay J., Evans A.J., Hashmi A.T., Lockwood G. Combined T2-weighted and diffusion-weighted MRI for localization of prostate cancer. AJR Am J Roentgenol. 2007;189:323–328. doi: 10.2214/AJR.07.2211. [DOI] [PubMed] [Google Scholar]
- 11.Landis J.R., Koch G.G. The measurement of observer agreement for categorical data. Biometrics. 1977;33:159–174. [PubMed] [Google Scholar]
- 12.Erickson B.J., Patriarche J., Wood C., Campeau N., Lindell E.P., Savcenko V. Image registration improves confidence and accuracy of image interpretation. Cancer Inform. 2007;4:19–24. [PMC free article] [PubMed] [Google Scholar]
- 13.Erickson B.J., Mandrekar J., Wang L., Patriarche J.W., Bartholmai B.J., Wood C.P. Effect of automated image registration on radiologist interpretation. J Digit Imaging. 2007;20:105–113. doi: 10.1007/s10278-007-9023-x. [DOI] [PMC free article] [PubMed] [Google Scholar]
- 14.Tan I.L., van Schijndel R.A., Fazekas F., Filippi M., Freitag P., Miller D.H. Image registration and subtraction to detect active T(2) lesions in MS: an interobserver study. J Neurol. 2002;249:767–773. doi: 10.1007/s00415-002-0712-6. [DOI] [PubMed] [Google Scholar]
- 15.Fei B., Wheaton A., Lee Z., Duerk J.L., Wilson D.L. Automatic MR volume registration and its evaluation for the pelvis and prostate. Phys Med Biol. 2002;47:823–838. doi: 10.1088/0031-9155/47/5/309. [DOI] [PubMed] [Google Scholar]
- 16.Pursley J., Risholm P., Fedorov A., Tuncali K., Fennessy F.M., Wells W.M. A Bayesian nonrigid registration method to enhance intraoperative target definition in image-guided prostate procedures through uncertainty characterization. Med Phys. 2012;39:6858–6867. doi: 10.1118/1.4760992. [DOI] [PMC free article] [PubMed] [Google Scholar]
- 17.Chappelow J., Bloch B.N., Rofsky N., Genega E., Lenkinski R., DeWolf W. Elastic registration of multimodal prostate MRI and histology via multiattribute combined mutual information. Med Phys. 2011;38:2005–2018. doi: 10.1118/1.3560879. [DOI] [PMC free article] [PubMed] [Google Scholar]
- 18.Oguro S., Tokuda J., Elhawary H., Haker S., Kikinis R., Tempany C.M. MRI signal intensity based B-spline nonrigid registration for pre- and intraoperative imaging during prostate brachytherapy. J Magn Reson Imaging. 2009;30:1052–1058. doi: 10.1002/jmri.21955. [DOI] [PMC free article] [PubMed] [Google Scholar]
- 19.Schiebler M.L., Tomaszewski J.E., Bezzi M., Pollack H.M., Kressel H.Y., Cohen E.K. Prostatic carcinoma and benign prostatic hyperplasia: correlation of high-resolution MR and histopathologic findings. Radiology. 1989;172:131–137. doi: 10.1148/radiology.172.1.2472644. [DOI] [PubMed] [Google Scholar]
- 20.Ahmed H.U., Kirkham A., Arya M., Illing R., Freeman A., Allen C. Is it time to consider a role for MRI before prostate biopsy? Nat Rev Clin Oncol. 2009;6:197–206. doi: 10.1038/nrclinonc.2009.18. [DOI] [PubMed] [Google Scholar]
- 21.Fütterer J.J., Heijmink S.W., Scheenen T.W., Jager G.J., Hulsbergen-Van de Kaa C.A., Witjes J.A. Prostate cancer: local staging at 3-T endorectal MR imaging—early experience. Radiology. 2006;238:184–191. doi: 10.1148/radiol.2381041832. [DOI] [PubMed] [Google Scholar]
- 22.Rosenkrantz A.B., Lim R.P., Haghighi M., Somberg M.B., Babb J.S., Taneja S.S. Comparison of interreader reproducibility of the prostate imaging reporting and data system and likert scales for evaluation of multiparametric prostate MRI. AJR Am J Roentgenol. 2013;201:W612–W618. doi: 10.2214/AJR.12.10173. [DOI] [PubMed] [Google Scholar]
- 23.Fütterer J.J., Engelbrecht M.R., Huisman H.J., Jager G.J., Hulsbergen-van De Kaa C.A., Witjes J.A. Staging prostate cancer with dynamic contrast-enhanced endorectal MR imaging prior to radical prostatectomy: experienced versus less experienced readers. Radiology. 2005;237:541–549. doi: 10.1148/radiol.2372041724. [DOI] [PubMed] [Google Scholar]
- 24.Akin O., Riedl C.C., Ishill N.M., Moskowitz C.S., Zhang J., Hricak H. Interactive dedicated training curriculum improves accuracy in the interpretation of MR imaging of prostate cancer. Eur Radiol. 2010;20:995–1002. doi: 10.1007/s00330-009-1625-x. [DOI] [PMC free article] [PubMed] [Google Scholar]
- 25.Mullerad M., Hricak H., Wang L., Chen H.N., Kattan M.W., Scardino P.T. Prostate cancer: detection of extracapsular extension by genitourinary and general body radiologists at MR imaging. Radiology. 2004;232:140–146. doi: 10.1148/radiol.2321031254. [DOI] [PubMed] [Google Scholar]