

Abstract
Methylene blue (MB) delays cellular senescence, induces complex-IV, and activates Keap1/Nrf2; however, the molecular link of these effects to MB is unclear. Since MB is redox-active, we investigated its effect on the NAD/NADH ratio in IMR90 cells. The transient increase in NAD/NADH observed in MB-treated cells triggered an investigation of the energy regulator AMPK. MB induced AMPK phosphorylation in a transient pattern, which was followed by the induction of PGC1α and SURF1: both are inducers of mitochondrial and complex-IV biogenesis. Subsequently MB-treated cells exhibited >100% increase in complex-IV activity and a 28% decline in cellular oxidants. The telomeres erosion rate was also significantly lower in MB-treated cells. A previous research suggested that the pattern of AMPK activation (i.e., chronic or transient) determines the AMPK effect on cell senescence. We identified that the anti-senescence activity of MB (transient activator) was 8-times higher than that of AICAR (chronic activator). Since MB lacked an effect on cell cycle, an MB-dependent change to cell cycle is unlikely to contribute to the anti-senescence activity. The current findings in conjunction with the activation of Keap1/Nrf2 suggest a synchronized activation of the energy and cellular defense pathways as a possible key factor in MB's potent anti-senescence activity.
Abbreviations: MB, methylene blue; NAD, nicotinamide adenine dinucleotide; NAO, 10-nonyl acridine orange; AMPK, AMP-activated protein kinase; NAMPT, Nicotinamide phosphoribosyltransferase; AICAR, 5-Aminoimidazole-4-carboxamide riboside
Keywords: Mitochondria, Oxidants, Complex-IV, NAD, AMPK, Senescence, Telomeres
Graphical abstract

Highlights
-
•
Methylene blue (MB) transiently increases the ratios NAD/NADH and pAMPK/AMPK.
-
•
MB induces PGC1α, SURF1, and complex IV biogenesis.
-
•
Oxidants production as well as telomere erosion decreases in MB-treated cells.
-
•
MB activates the metabolic pathways of cell defense and energy metabolism.
-
•
MB, a potent anti-senescence agent in vitro, maybe also effective in vivo.
1. Introduction
The process of cell senescence is considered to be protective against cancer because senescent cells have limited proliferative capacity [1]. Furthermore, accumulating evidence indicates that senescent cells increase in aging and they are believed to contribute to the process of aging [1–15]. A significant slowing in the age-related deterioration has been observed in mouse model engineered for eliminating senescent cells [2,3]. As the cell senesces it accumulates biochemical and morphological changes and loses its function [16]. Furthermore, senescent cells secrete specific factors (e.g., cytokines) that could affect the integrity of the extracellular matrix and may also interfere with the adjacent cells in their vicinity [1,17–19]. Thus, preventing or delaying the formation of senescent cells may provide a viable strategy for modulating the process of cellular senescence and the deleterious effects of senescent cells [20,21]. Along the line of this hypothesis, strategies such as genetic manipulations or development of specific drugs that lack side effects (e.g., promoting cancer) could be promising for reducing the load of senescent cells and modulating the deleterious effects of senescent cells in vivo.
Several compounds have been reported with various abilities of delaying cell senescence in vitro [20,22]. Recent findings show that methylene blue (MB, a redox active agent) is very effective in delaying cell senescence [23]. At very low concentration (100 nM) MB prolonged the lifespan of human embryonic lung fibroblasts (IMR90) by ≈50% [23]. The anti-senescence activity of MB was demonstrated in the large gain in Population Doubling Level (PDL) as well as in prolonging the replicative capacity of the cells by four to six weeks beyond the control [23]. These observations are intriguing since MB has been used in clinical settings for many years to treat a variety of ailments not related to aging [24,25]. MB could serve as a candidate drug to test anti-senescence therapy in research models. Therefore, the more we understand the effect of MB on the intermediary metabolism of the cell the better we understand the process of cellular senescence delay by MB.
MB is mostly used for treating congenital or poison-induced methemoglobinemia [26]. In this regard MB serves as an electron carrier that transfers electrons from nicotinamide adenine dinucleotides (NAD(P)H) to methemoglobin (Fe+3), which is then reduced to deoxyhemoglobin (Fe+2). Thus, the electron shuttling by MB restores the ability of hemoglobin-heme to bind oxygen [26]. In this process MB oxidizes NAD(P)H to NAD (or NADP) via cellular dehydrogenases (e.g., cytochrome b5 reductase). Additional studies suggest that the effect of MB on cell metabolism is concentration dependent. At low concentrations (nanomolar range) MB improves mitochondrial respiration [23,27] and delays cellular senescence [23]. It increases subunit II of cytochrome c oxidase (complex IV) by >30%; the rate of heme synthesis; iron uptake; cell resistance to oxidants (e.g., H2O2); induces the cytoprotective pathway Keap1/Nrf2 [23, 28]; and prevents cellular senescence induced by chronic exposure to oxidants [23]. At high concentration (>micromolar) MB inhibits nitric oxide synthase [29], guanylyl cyclase [30], and causes down regulation of complex IV [23].
At low concentration MB induces complex IV and activates Keap1/Nrf2 (cytoprotective pathway) [23,28], however the molecular mechanism that drives these changes and their connection to cell senescence is not clear. Mitochondrial dysfunction, impairment to energy metabolism, telomeres erosion, and oxidative stress are factors that contribute to cellular senescence [31–35]. In the current study we concentrated on the effect of MB on complex IV. We measured the effect of MB on NAD/NADH, which led to investigating the energy-sensing kinase AMP-activated Protein Kinase (AMPK). MB induces PGC1α and SURF1, which is important for mitochondrial and complex IV biogenesis. The findings of this study in conjunction with the activation of Keap1/Nrf2 pathway by MB [23,28] led to investigating the status of reactive oxygen species and telomeres erosion in MB-treated cells. The current study provides molecular correlates to the effect of low concentration of MB on complex IV, energy metabolism, redox metabolism, and telomeres.
2. Materials and methods
2.1. Material
Cell culture reagents (DMEM, FBS, PenStrep, and trypsin-EDTA), as well as western blot reagents include NuPAGE 4–12% Bis-Tris Gel and MOPS SDS Running Buffer (20X) were from Life-Technologies (Grand Island, NY). NAO and DAPI were from Molecular Probes (Eugene, Oregon). DCFH, cytochrome c, n-Dodecyl-beta-maltoside, and DTT were from Sigma (St. Louis, MO). 5-Aminoimidazole-4-carboxamide riboside (AICAR) was from Cayman chemical company (Ann Arbor, MI). The antibodies for AMPK (AMP-activated protein kinase) and pAMPK (rabbit monocloncal anti-Phospho-Thr172-AMPKα), PGC1α, SIRT1, phospho-Ser47-SIRT1 (p-SIRT1) were from Cell Signaling Technology (Beverly, MA). Antibodies for SURF1 and Actin were from Santa Cruz Biotechnology (Dallas, TX). Protease inhibitors, phosphatase inhibitors, and RIPA buffer with EDTA were from Boston BioProducts (Ashland, MA). Pierce ECL Western blotting Substrate and Restore Western blot Stripping Buffer were from Thermo Scientific (Rockford, IL). Quick Start Bradford Dye Reagent for protein quantification was from Bio-Rad (Hercules, CA).
2.2. IMR90 cell culture, treatment with MB, and preparing cellular lysate
Normal human lung fibroblasts (IMR90) were obtained from Coriell Institute for medical research (Camden, NJ). The cells were cultured in DMEM supplemented with 10% FBS [23]. IMR90 cells can be maintained under tissue culture conditions for about three months until the replicative senescence is reached, which is usually at population doubling level (PDL) around 60. The optimal concentration of MB that delays cell senescence was established as 100 nM [23]. Thus, in the current study we used 100 nM MB. Newly seeded cell cultures were treated with 100 nM MB for the specified intervals as indicated below. At the completion of the treatment with MB, the cultures were harvested and used to prepare cell lysates as described below or stored for later use in −80 °C.
2.3. Measuring the weekly gain in population doubling level (PDL)
Cellular replicative senescence was determined by measuring the weekly gain in PDL and the final cumulative PDL as described previously [23]. Briefly, a week from seeding, the cultures of IMR90 cells were harvested by trypsinization, and the cells were counted using Coulter Counter (BeckmanCoulter, Brea CA). The seeding of a new cell culture was performed by transferring 0.5 million cells from the current cell culture to a new plate. Several plates can be seeded at once. After a week from seeding, the new culture was harvested; the cells were counted and new cultures were seeded again as described above. Every week, the gain in PDL was calculated by using the initial (0.5 million) and the final cell counts (i.e. densities) as described previously [23]. The new weekly gain in PDL was added to the previous PDL to establish the cumulative PDL number. As the cumulative PDL of the specific IMR90 cell culture increases, the culture approaches senescence. At senescence the PDL plateaus. Thus, young cells have low PDL (between 20 and 30) and the final PDL of old-senescent cells usually plateaus at PDL≥55. Senescence was defined when the cell culture stops gaining PDLs. IMR90 cells were contentiously maintained in culture until they senesce, which usually lasts three months.
2.4. Measuring the ratio oxidized to reduced nicotinamid adenine dinucleotides (NAD/NADH)
The levels of NAD and NADH were measured using EnzyChrom NAD/NADH Assay Kit (E2ND-100; BioAssay Systems, Hayward, CA). IMR90 cells were grown in the presence or absence of 100 nM MB for 0–24 h, harvested, and the cells were collected in ice-cold PBS. About 105 cells were used to assay NAD and NADH as described by the manufacturer. Briefly, two separate sets of 105 cells were used. One set was extracted by 100 µl NAD-extraction buffer for NAD determination while the other set was extracted by NADH-extraction buffer for NADH determination. Both extracts were heated for 5 min at 60 °C. The level of NAD and NADH was assayed using enzymatic recycling of MTT followed by measuring the change in absorbance at 565 nm at the time points 0 and 15 min using Molecular Devices Spectra MaxM5. In conjunction with the unknown samples a standard curve was similarly prepared as described by the manufacturer. NAD and NADH concentrations were calculated using the difference in absorbance at 0 and 15 min and the standard curve. The concentration of NAD and NADH were used to calculate the ratio NAD/NADH at each time point.
2.5. SDS-PAGE and western blot analysis for specific protein factors
At the harvesting time point, the IMR90 cell culture plates were placed on ice, the used media was removed, and the cells were rinsed three times with ice-cold PBS (Ca+2, Mg+2-free). The cells were then scrapped using cell scraper, collected using ice-cold centrifuge, the supernatant was discarded, and the pellet was re-suspended into RIPA buffer that was previously supplemented with phosphatase and protease inhibitors. This cell suspension was sonicated at 4 °C and the protein were quantified using Bradford reagent. The samples to be analyzed were resolved in (4–12%) SDS-PAGE, transferred to PVDF membrane (Immobilon-P, Millipore, Billerica, MA), and blocked with 5% BSA. The PVDF membranes were developed by incubation with the specific primary antibodies: pAMPK, AMPK, PGC1α, SURF1, Actin, p-SIRT1, or SIRT1 overnight at 4 °C. After washing the primary antibody, the membrane was exposed to the respective secondary antibody. The free secondary antibody was then washed and the protein band-associated-HRP with ECL was used to highlight the protein content of each band by capturing the chemiluminescence on x-ray film. Actin was used as a loading control for PGC1α and SURF1 while pAMPK and pSIRT1 were normalized to AMPK and SIRT1, respectively. The pixels density of each band was determined using Image J software. In the case of pAMPK and p-SIRT1, the PVDF membrane was first developed for pAMPK (or p-SIRT1) and then stripped and redeveloped for the parent proteins AMPK and SIRT1.
2.6. Comparing the anti-senescence activity of MB and AICAR
The effect of AICAR on PDL (i.e., cell senescence) was investigated using 50 and 100 µM. The concentrations of AICAR were determined based on a pilot experiment, in which we identified the nontoxic concentration of AICAR. We found that 50 and 100 µM AICAR are not cytotoxic to IMR90 cells, thus we used these concentrations to test the effect of AICAR on cell senescence and compare to MB. MB was prepared fresh every week in ddw and added to the growth media at a final concentration of 100 nM [23]. AICAR was prepared as 250 mM stock solution, sterilized, and stored as aliquots in −80 °C. The PDL in control, MB-treated, and AICAR-treated IMR90 cells was calculated as described in the section on cell senescence that was described above.
2.7. Measuring the activity of cytochrome c oxidase (complex IV) in IMR90 cells
IMR90 cells were treated for different intervals with 100 nM MB and the activity of complex IV was measured using cytochrome c oxidase assay kit (Sigma, St. Louis, MO). Briefly, the lysate from MB-treated cells or controls were prepared into ice-cold PBS that was previously supplemented with protease inhibitors as well as 2 mM n-dodecyl-beta maltoside. The samples were sonicated in cold and spun down at 4000 RPM for 5 min (Microfuge 22R centrifuge). Complex IV assay buffer contained 10 mM Tris HCl/120 mM KCl, 0.3 µM n-Dodecyl beta-d-maltoside, pH 7. Ferricytochrome c (2.7 mg is dissolved into 1 ml DDW) was reduced to ferrocytochrome c by adding 5 µM DTT. Complete reduction of ferricytochrome c to ferrocytochrome c was confirmed by the increase in its absorbance at 550 nm. Complex IV activity assay requires mixing 30 µl of the lysate with 570 µl assay buffer in a cuvette, which is then used to blank the spectrophotometer (Beckman Coulter DU 800) at 550 nm. The enzymatic activity starts by adding 30 µl of ferrocytochrome c to the cuvette followed by quick mixing and monitoring the decline in the absorbance at 550 nm (Beckman Coulter DU 800). The final concentration of ferrocytochrome c was 10.4 μM. Complex IV oxidizes ferrocytochrome c to ferricytochrome c causing a decline in the absorbance at 550 nm. The rate of the decline at 550 nm was measured from the first 20 s of the enzymatic reaction and used with the mM extinction coefficient ε550=21.84 [mM]−1 [cm]−1 of reduced cytochrome c to calculate complex IV activity.
2.8. Staining mitochondrial inner membrane with 10-nonyl acridine orange (NAO)
NAO is a fluorescent dye that binds with cardiolipin, which is found only in the mitochondrial inner membrane [36,37]. Thus, the level of intracellular fluorescence of NAO is an indicator of the mass of the mitochondrial inner membrane. IMR90 cells were cultured, treated with MB, and harvested as described above. The cells were counted using Beckman's Coulter counter and one million cells were transferred to FACS tubes, spun down at 3000 RPM (Allegra X-22R centrifuge), the supernatant media was decanted, and the cell pellet was resuspended into two ml of 25 mM HEPES (pH 7.2)/DMEM. A stock solution of 5 mM NAO was prepared into DMSO. NAO was added to each sample at a final concentration of 200 nM, mixed, and incubated at 37 °C in dark for 30 min. NAO-stained cells were then spun down, the media-containing NAO was decanted, and the cells were washed twice with Hank's buffer and resuspended in 1 ml Hank's buffer. NAO-stained cells were analyzed with FACSariaII (FACSariaII, BD, San Jose, CA) using excitation 490 nm and emission 540 nm.
The optimal concentration of 200 nM NAO was determined by treating IMR90 cells with increasing concentrations of NAO (0–5 μM) for 30 min at 37 °C. The fluorescence was measured using FACSariaII and plotted against the concentration of NAO to determine the range of NAO concentrations that produces linear increase in intracellular fluorescence before it reaches plateau (Data not shown). The concentration of NAO that provide 50% of the linear range of NAO fluorescence was used to measure the inner membrane mass of the mitochondria in IMR90 cells. This concentration was 200 nM for NAO.
2.9. Measuring the level of oxidants in IMR90 cells using DCFH
2′,7′-dichlorofluorescein diacetate (DCFH-DA) is a cell permeable molecule that becomes fluorescent (DCF) following its oxidation by reactive oxygen species [38]. IMR90 cells were cultured, treated with MB, and then harvested as described above. One million IMR90 cells were added to FACS tubes, spun down at 3000 RPM (Allegra X-22R centrifuge), supernatant media was decanted, and the cell pellet was resuspended into 2 ml of 25 mM HEPES (pH 7.3)/DMEM. A stock solution of 5 mM DCFH was prepared in DMSO. DCFH was added to each sample at a final concentration of 1 µM, mixed, and incubated at 37 °C in dark for 20 min. DCFH-treated cells were then spun down and the media-containing DCFH was decanted. The cells were then washed twice with Hank's buffer and resuspended in 1 ml Hank’s buffer. DCFH-treated cells were analyzed for DCF fluorescence using FACSaria II at excitation 480 nm and emission 530 nm.
The optimal concentration of DCFH (1 µM) was determined by treating IMR90 cells for 20 min with increasing concentrations of DCFH (0–20 μM) and incubated at 37 °C. The fluorescence was measured and plotted against the concentration of DCFH to determine the concentrations of DCFH that produces linear increase in intracellular fluorescence before it reaches plateau (Data not shown). The concentration of DCFH that provides 50% of the linear range of the fluorescence was chosen and used to measure the steady-state level of intracellular oxidants in IMR90 cells. This concentration was 1 µM for DCFH.
2.10. Determining telomeres length in IMR90 cells
IMR90 cells were treated with or without 100 nM MB starting at PDL ≈27 and ending at PDL ≈44 (four weeks in culture). The cells were split on weekly basis as described above. The DNA was extracted and used to measure the telomere length. The telomeres length was determined by using the kit TeloTAGGG Telomere Length Assay (Roche Life Sciences). The kit utilizes Southern analysis of terminal restriction fragments (TRF) that were obtained after digesting the genomic DNA. In brief, DNA was digested by mixture of restriction enzymes that preserve the sub-telomeric DNA while non-telomeric DNA is digested to low molecular-weight fragments. The DNA fragments were then separated by gel electrophoresis followed by transferring the DNA fragments to a nylon membrane. The blotted DNA fragments were hybridized to a digoxigenin (DIG)-labeled probe that is specific for telomeric repeats, then incubated with a DIG-specific antibody covalently coupled to alkaline phosphatase. The immobilized telomere probe was visualized by chemiluminescent substrate (CDP-Star) for alkaline phosphatase. The molecular DNA standards were used to determine average TRF length of the telomere smear using the molecular-weight standard that was included in the kit.
2.11. Determining the cell cycle phases in IMR90 culture
Normal and young IMR90 cells were synchronized utilizing contact inhibition. Contact inhibition due to confluency is usually achieved in IMR90 cells at about seven days after seeding. However, for this experiment the cell culture was allowed to grow for eleven days to assure that all the cells ceased dividing. Thus, on day six a fresh growth medium was used to replace the old media. This approach of synchronization resulted in >95% of the cells in G1, <4% S, and <1.6% G2. Chemical inhibition of the cell cycle or deprivation of specific nutrient was not used for synchronizing due to the nature of this experiment, where we test the effect of MB on cell cycle.
In order to determine the effect of MB on cell cycle, the synchronized cell culture was harvested and re-seeded (0.5 million cell/100 mm plate) and treated with 100 nM MB for various intervals or remained untreated in order to serve as control. At the end of each interval, MB-treated cells and control cells were harvested, spun down at 1200 RPM for five minutes. The cells were washed with Ca++- and Mg++- free-PBS twice, fixed in 95% ethanol, and spun down at 2200 RPM for 10 min, and then resuspended in PBS. The resuspended cells were counted and 0.2 million cells were transferred into FACS tube. The cells were once again spun down, PBS was decanted, and the cells were resuspended in 0.1% Triton-X100 solution supplemented with 300 nM DAPI and incubated for 30 min at 4 °C. The cells were then separated and analyzed at excitation 360 nm and emission 460 nm using FACSAriaII. The data was analyzed for DNA pattern using ModFit software for cell cycle analysis (Verity Software, Topsham, ME).
2.12. Statistical analysis
Graphing and statistical analysis were performed using Prism 6.0 software (GraphPad, San Diego, CA, USA). Significance was defined at 95% confidence interval when P<0.05.
3. Results
3.1. Methylene blue increases the ratios NAD/NADH, pAMPK/AMPK, and induces PGC1α
Following 15 min of treatment of IMR90 cells with MB the ratio NAD/NADH increased by 63%, which within 24 h returned to the control level (Fig. 1). MB did not affect NAMPT, a rate-limiting enzyme in NAD synthesis (Fig. 1B), indicating no de novo synthesis of NAD in MB-treated cells. The data are consistent with the transient increase in NADH oxidation in MB-treated cells (Fig. 1). The ratio NAD/NADH is a key indicator for the cellular energy and redox status [39]. Reduced intracellular energy status (high NAD/NADH ratio) results in AMPK phosphorylation [40], thus we examined the effect of MB on AMPK. MB increased the phosphorylation of AMPK at Thr-172 (pAMPK) and as a result the ratio pAMPK/AMPK gradually increased after 1 h of treatment with MB until reached significance after 24 h. pAMPK/AMPK returned to the level of the control after 48 h (Fig. 2A and B). Since pAMPK is capable of inducing PGC1α, the time-dependent effect of MB on PGC1α was also examined. MB induced PGC1α after 24 h of incubation (Fig. 3A and B). However, MB did not affect the protein level of SIRT1 or p-Ser47-SIRT1 even after 7 days of incubation (Data not shown).
Fig. 1.

The effect of MB on NAD/NADH ratio. IMR90 cells were cultured in the presence or absence of 100 nM MB for 0 (control), 0.25, 2, and 24 h. After harvesting the cultures the cells were counted and 105 cells were used to assay NADH and NAD with the help of EnzyChrom NAD/NADH Assay Kit as described in Section 2. The level of NAD and NADH was assayed by enzymatic recycling followed by measuring the change in absorbance at 565 nm at 0 and 15 min. A. The concentration of NADH (upper panel) and NAD (center panel) were calculated using a standard curve and those were used to calculate the ratio NAD/NADH (Lower Panel). Three independent experiments are shown each was performed in triplicates. Values are Mean±sem (t-test, *P<0.02). B. A representative immunoblot depicting the effect of MB on NAMPT as well as the ratio of NAMPT to Actin calculated from immuneblots similar to the one presented.
Fig. 2.

The effect of MB on pAMPK/AMPK ratio. IMR90 cells were seeded and incubated with 100 nM MB for different intervals. The cells were harvested at each specific time point and the cell lysates were prepared and stored at −80 °C. The proteins from each time point were analyzed with western blot using specific antibodies for pAMPK and AMPK as described in Section 2. The immuneblot image was captured on the x-ray film and the band density was quantified using ImageJ. A. Shows a representative immuneblot of pAMPK and AMPK. B. The ratio of pAMPK to AMPK was calculated from western blots similar to the one in A. Shown the Mean±sem of at least four independent experiments. One-way ANOVA, Dunnett's multiple comparisons test, *P<0.05, **P<0.001).
Fig. 3.

The effect of MB on the induction of PGC1α. IMR90 cells were seeded and incubated with 100 nM MB for different intervals. The cells were harvested at each specific time point and the cell lysates were prepared and stored at −80 °C. The proteins were analyzed with western blot using specific antibodies for PGC1α and Actin as described in Section 2. The immuneblot image was captured on the x-ray film and the band density was quantified using ImageJ. A. Shows a representative immunoblot of PGC1α and Actin. B. Shows the ratio of the densities of PGC1α to Actin. Shown is the Mean±sem of at least four independent experiments. One-way ANOVA, Bonferroni's multiple comparisons test (*P<0.05, ***P<0.001).
3.2. The effect of methylene blue on complex IV activity, mitochondrial inner membrane, and intracellular oxidants
The induction of PGC1α by MB suggests a molecular connection to mitochondrial biogenesis. We further investigated for a direct connection to complex IV by studying the effect of MB on SURF1, a key factor in the biogenesis of active complex IV. MB gradually induced SURF1 over time (Fig. 4A and B) and subsequently the enzymatic activity of complex IV also increased (Fig. 5). Since complex IV resides only in the mitochondrial inner membrane, we decided to examine if the increase in complex IV is accompanied by an increase in the mitochondrial inner membrane. NAO is a fluorescent dye that binds cardiolipin, a specialized lipid found only in the mitochondrial inner membrane. An increase in the mass of the mitochondrial inner membrane was observed in MB-treated cells as determined by the increase in NAO fluorescence. NAO fluorescence gradually increased in MB-treated cells in a time line that was consistent with the increase in complex IV (Fig. 6). Intracellular incorporation of NAO reached plateau at fluorescence level 30% above that of the control (Fig. 6).
Fig. 4.

The effect of MB on SURF1. IMR90 cells were seeded and incubated with 100 nM MB for different intervals. The cells were harvested from each time point and the cell lysates were prepared and stored at −80 °C. The proteins were analyzed with western blot using specific antibodies for SURF1 and Actin as described in Section 2. The immuneblot image was captured on the x-ray film and the density of each band was quantified using ImageJ. A. Shows an immunoblot of SURF1 and Actin. B. The ratio of the densities of SURF1 to Actin. Shown is the Mean±sem of at least five independent experiments. Paired t-test, *p<0.04.
Fig. 5.

Time-dependent build-up of cytochrome c oxidase (Complex IV) activity in response to MB. IMR90 cell cultures were treated with 100 nM MB for increasing intervals (up to 6 days). At the end of each specific time point, the cells were harvested, the lysates were prepared, and complex IV activity was determined as described in Section 2. The assay buffer contained 10 mM Tris HCl/120 mM KCl, 0.3 µM n-Dodecyl beta-D-maltoside, pH 7. The rate of oxidation of the substrate ferrocytochrome c to ferricytochrome c was measured at 550 nm and used to calculate the enzymatic activity with the help of the millimolar extinction coefficient of 21.84. The data are Mean±sem of five independent experiments. **P<0.001, One-way ANOVA, Dunn's multiple comparisons test.
Fig. 6.

The effect of MB on the mitochondrial innermembrane. IMR90 cell cultures were treated with 100 nM MB for increasing intervals up to 7 days. The cultures were harvested by trypsinazation, counted, and resuspended into DMEM. One million cells of each time point were placed in designated tube and incubated in dark with 200 nM NAO. The fluorescence was measured using flow cytometry as described in Section 2. The data shown are the Mean AFU±SEM of four independent experiments, each performed in triplicate. *P<0.04, (One-way ANOVA, Dunnett's multiple comparisons test).
Elevated activity of complex IV improves mitochondrial respiration [23] and lowers cellular level of oxidants [41–43]. Therefore we measured the level of oxidants in MB-treated cells. The steady-state level oxidants level in MB-treated cells was 28% lower than that of the control (Fig. 7). Intracellular oxidants were determined by using DCFH-DA.
Fig. 7.

The effect of MB on intracellular oxidants. IMR90 cell cultures were treated with 100 nM MB for increasing intervals (up to 7 days). The cells were harvested by trypsinazation, counted, and resuspended into 25 mM HEPES (pH 7.3)/DMEM. One million cells of each specific time point were placed in the designated tube and incubated in dark with 1 µM of 2′,7′-dichlorfluorescein-diacetate (DCFH-DA) and the fluorescence of DCF was measured using flow cytometry as described in Section 2. The data shown are the percentages of the Mean AFU±sem of six independent experiments, each performed in triplicates. *P<0.01, (One-way ANOVA, Dunnett's multiple comparisons test).
3.3. Methylene blue slows telomeres erosion in IMR90 cells
The rate of telomeres erosion impacts the rate of cellular senescence in dividing cells. Thus, the rate of telomeres erosion was examined over four weeks of treatment with MB. The initial PDL upon seeding of the control and MB-treated group was 27. As expected, at the end of the four weeks MB-treated cells gained more PDLs than the controls. The gain in the PDL in weeks 1, 2, 3, and 4 in the control group was 4, 3.6, 3.5, and 3.4 PDL while the gain in PDL in the MB-treated group was 4.2, 4.2, 4.3, and 4.3 PDLs, respectively. The telomeres length was visualized with the help of Southern blots similar to the one shown in Fig. 8A, which served to measure the telomeres length in controls and MB-treated cells. The calculations show that MB-treated IMR90 cells have longer telomeres as compared to the controls (Fig. 8A). Telomeres erosion rate was calculated and found to be about 4% per week (0.49 kb/week) in control cells, while the rate in MB-treated cells was 0.5%/week (0.03 kb/week) (Fig. 8B, P<0.02).
Fig. 8.

The effect of MB on the length of telomeres in IMR90 cells. IMR90 cells were treated with 100 nM MB starting at PDL 27 and ending at PDL 44. The cells were split every week, PDL calculated, cultures were re-seeded (0.5 million/plate), and the remaining cells were collected for DNA extraction as described in Section 2. Genomic DNA was extracted and processed for telomere length analysis as instructed in TeloTAGGG Telomere Length Assay kit. A. Shows Southern blot of terminal restriction fragments (TRF) after digesting the genomic DNA. B. The rate of telomeres erosion. The rate was calculated from the Kb distribution of TRF from three Southern blots similar to the one shown in A. The rate of telomere erosion was about 0.49 kb/week and 0.03 kb/week in control and MB-treated cells respectively (*P<0.02, t-test).
3.4. Methylene blue does not interfere with the cell cycle of IMR90 cells
Since IMR90 are normal cells, the effect of MB on the cell cycle was investigated by measuring the distribution of the different stages of the cell cycle in synchronized IMR90 cell culture. Synchronization by contact inhibition caused more than 95% of the cells to enter G1 phase (Fig. 9A). The effect of MB on the cell cycle of the synchronized cultures was examined at 18, 24, 48, and 72 h. MB did not alter the cell cycle stages regardless of the duration of exposure to MB. The data presented in Fig. 9B was selected from IMR90 cells that were exposed to MB for 48 h (Fig. 9B).
Fig. 9.

The effect of MB on the cell cycle of IMR90 cells. IMR90, normal human cells, were synchronized by contact inhibition and used to seed new cultures. One group of the new cultures was assigned to 100 nM MB while the other group remained as control. Both groups were incubated for 18, 24, 48, and 72 h. At the end of each time point the cells were harvested, washed with ice-cold PBS, and prepared for flow cytometry analysis for the various stages of the cell cycle as described in Material and Methods. The data from the flow cytometer was used for determining the distribution of the various stages of cell cycle with the help of ModFit software (Verity Software, Topsham, ME). A. Shows the synchronization of the cells and the distribution of the cell cycle stages in 90% confluent culture and in over confluent culture. Each time point represents the Mean±sem of three independent experiments, each performed in triplicates. *P<0.05 One-way ANOVA, Friedman test. B. Shows the distribution of the cell cycle stages in MB-treated and control cultures at the time point 48 h. Although several intervals were tested, shown are the data from 48 h incubation with MB (see text for details).
3.5. MB is more effective than AICAR in delaying cellular senescence
The anti-senescence activity of AICAR (a chronic activator of AMPK) was compared to that of MB. The nontoxic concentration of AICAR was determined based on a pilot experiment, which demonstrated 50 µM and 100 µM to be optimal for testing the effect of AICAR on cell senescence (Data not shown). At 50 µM, AICAR has no effect on cell senescence (Fig. 10). At 100 µM, on the other hand, AICAR has positive but small effect on cell senescence (Fig. 10). The control cultures senesced at PDL 66 (Fig. 10). The gain in PDL by 100 µM AICAR was 2.1 PDLs (P<0.05) as compared to 18 PDLs (P<0.001) gained by 100 nM MB, which make the final PDL at senescence to be 68.1 and 84 PDLs, respectively (Fig. 10). Thus, MB causes large gain in total PDL. Furthermore, AICAR prolonged the interval until the cell culture reached senescence by one week beyond the control culture while MB prolonged the interval until the cell culture reached senescence by 6 weeks beyond the control culture (Fig. 10). It is important to emphasize that the anti-senescence activity of MB requires a concentration that is 1000 times less than AICAR (100 nM MB vs. 100 µM AICAR).
Fig. 10.

Comparing the anti-senescence activity of AICAR to MB. IMR90 cells were maintained with MB, AICAR, or control until they senesce. The senescence of IMR90 cells was measured by continuously maintaining the cells in culture as described in Materials and Methods. The control cells gained 66 PDLs and senesced at week 11 (closed squares), 100 nM MB-treated cells gained 84 PDLs and senesced at week 17 (open squares), the 50 µM AICAR-treated cells gained 65.4 PDLs and senesced at week 11 (closed circles), and 100 µM AICAR-treated cells gained 68.1 PDLs and senesced at week 12 (open circles). Each time point represents the average of the PDLs that were calculated from three independent experiments. The data shown is the Mean±sem. One-way ANOVA, Dunnett's multiple comparisons test. *P<0.05, ***P<0.001.
4. Discussion
MB is a strong anti-senescence agent that also induces complex IV [23], however the molecular correlates of these actions are not clear. In the current study we utilized the fact that MB is a mild redox agent [44] that receives electrons from NAD(P)H dehydrogenases [23,26] and investigated its effect on cellular metabolism with the hope to find a possible link to complex IV. Previous studies suggest that MB is reduced at the cell surface, a process that increases its diffusibility across the cell [45]. Within 15 min of exposure to MB the NAD/NADH ratio increased by 63%, which returns to the control level within 2 h (Fig. 1). The increase in NAD/NADH is driven by an increase in NAD and a decrease in NADH (Fig. 1), which is likely due to an increase in the oxidation of NADH+ rather than an increase in NAD+ synthesis since MB did not affect NAMPT, the rate-limiting enzyme in NAD synthesis (Fig. 1B). The NAD/NADH ratio is an indicator of the energy and redox status, thus the increase in NAD/NADH suggested a change to pAMPK/AMPK. An elevated NAD/NADH ratio indicates low cellular energy status, a condition that causes AMPK phosphorylation [46]. Indeed, the ratio pAMPK/AMPK increases in MB-treated cells, peaks at 24 h from the exposure to MB, and returns to the control level after 48 h (Fig. 2). The transient increases in NAD/NADH (Fig. 1) and pAMPK/AMPK (Fig. 2) suggest that MB causes a temporary change to cellular energy and redox status. The transient effect of MB on the ratios NAD/NADH and pAMPK/AMPK could be the result of a positive feedback that activates specific pathways (e.g., of TCA cycle). These pathways work to restore the NAD/NADH ratio to the control level.
pAMPK activates several metabolic responses. Among the factors that are affected by pAMPK is the transcriptional coactivator PGC1α [35,47,48]. PGC1α up-regulates the expression of genes that are important for mitochondrial biogenesis and maintenance [40,49] and thus could link MB to the mitochondria and complex IV. MB induced PGC1α after 24 h of exposure (Fig. 3); which also parallels the pattern of phosphorylation of AMPK (Fig. 2A). The increase in PGC1α triggers long-term changes to the mitochondria [49] such as the induction of complex IV. We found that MB induces SURF1, which is essential for the biogenesis of complex IV (Fig. 5). Parallel to the increase in SURF1, complex IV activity also gradually increases starting on day two of treatment and more than doubled on day five (Fig. 4). The increase in complex IV activity is consistent with the acceleration of mitochondrial respiration by MB [23,27]. The activity of complex IV directly correlates with the energy efficiency and inversely with the level of oxidants [41–43]. The vast majority of intracellular O2 is safely converted to water by the action of complex IV through mitochondrial respiration. Thus, the induction of complex IV (Fig. 4) could contribute to the decrease in intracellular oxidants that we observed in MB-treated cells (Fig. 7). MB also increases the cellular antioxidants defense mechanisms by activating Nrf2/Keap1 pathway, enhancing the cellular resistance to oxidative stress [23,28]. The function of Keap1/Nrf2 is impaired with aging or in age-related disorders [50].
Oxidative stress contributes to telomeres erosion and thus accelerates cell senescence [31–34]. Chronic exposure to low sub-toxic concentration of H2O2 accelerates cellular senescence [51], which was prevented by MB [23]. Therefore, we measured the effect of MB on the rate of telomeres erosion and found it to be lower in MB-treated cells (Fig. 8). The low erosion rate of telomeres is likely contributed for, in part, by lower level of oxidants (Fig. 7) and the activation of Keap1/Nrf2 pathway by MB [23,28]. Thus, MB could, in part, delay cell senescence by lowing the rate of telomeres erosion.
Because complex IV is located in the inner-membrane of the mitochondria, the increase in complex IV assembly requires a concomitant increase in the mass of the mitochondrial inner-membrane. NAO staining, used to assess the mitochondrial inner-membrane, shows an increase in the mass of the inner-membrane in MB-treated cells (Fig. 6). The pattern of the increase in the inner-membrane mass parallels that of complex IV.
The involvement of AMPK in cell senescence is controversial. AMPK delays cell senescence when induced by acute treatment with H2O2 [52,53]. However, continuous activation of AMPK has been proposed to mediate cellular senescence [53,54] and to lead to adverse effects [55,56]. AICAR shares structural similarity with AMP, thus it acts as strong activator of AMPK [48,57]. Since MB transiently activates AMPK we compared its anti-senescence activity to AICAR. MB was more than eight times effective in delaying cell senescence than AICAR (i.e., 18 vs., 2.1 PDLs, respectively, Fig. 10). Furthermore, MB was six times more effective in prolonging the replicative capacity of the cell culture than AICAR (Fig. 10). The reduced efficacy of delaying cell senescence by AICAR could be, in part, due to the excessive activation of AMPK [53], which is not the case with MB, which transiently activates AMPK (Fig. 10). Since cell senescence is measured by determining replicative senescence (the change in PDL), the potential of a direct effect of MB on cell cycle was examined. Cell cycle analysis of MB-treated cells shows no affect on cell cycle (Fig. 9). The induction of the cell defense mechanisms (e.g., Keap1/Nrf2) in conjunction with the lower levels of oxidants as well as induction of complex IV and improving mitochondrial respiration are likely to lower DNA damage and, thus slow telomeres erosion.
Scheme 1 reconciles the various effects of MB from this study and from published results (e.g., activation of Keap1/Nrf2). We propose combined activation of energy and cellular defense pathways by MB as possible key factor in MB’s potent anti-senescence activity. MB alters the ratios NAD/NADH and pAMPK/AMPK, which leads to the induction of complex IV and lowering the intracellular oxidants production. In addition, MB activates Keap1/Nrf2 pathway, which enhances cellular resistance to oxidative stress [23,28]. The activity of Keap1/Nrf2 is attenuated with age [50], a factor that enhance the damaging impact of oxidants on macromolecules such DNA and telomeres. Oxidants damage to proteins, lipids, and DNA, enhance telomeres erosion, and mitochondrial dysfunction, all are well-established contributing factors to cell aging [31,58]. These factors are also involved in several age-related disorders (including Alzheimer disease [59], atherosclerosis [60], and Parkinson's disease [61]).
Scheme 1.
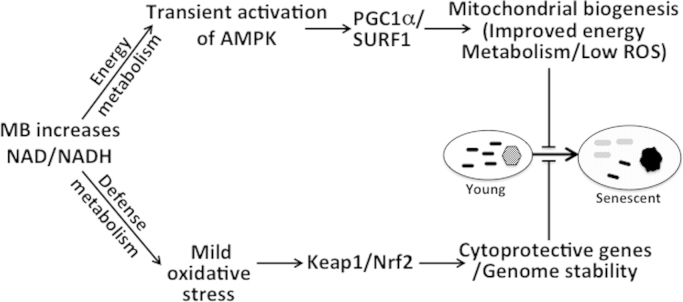
MB interacts with AMPK and Keap1/Nrf2 pathways that oversee energy and cellular defense metabolism, respectively. MB increases the ratio of NAD/NADH, which connects to the cellular energy regulation (pAMPK) and the cytoprotective mechanisms (Keap1/Nrf2). The increase in NAD/NADH, which is fast and transient, is followed by an increase in pAMPK/AMPK. AMPK plays key role in energy metabolism through mitochondrial and complex IV biogenesis (and activity). The biogenesis of complex IV requires SURF1 while PGC1α is important for mitochondrial biogenesis, maintenance, and function. MB also activates the Keap1/Nrf2 pathway, which plays central role in the defense metabolism against oxidants and xenobiotic that may damage DNA, lipids, and proteins. The induction of the cytoprotective mechanism in conjunction with lower levels of oxidants as well as the induction of complex IV and improvement of mitochondrial respiration are likely to enhance genome stability and slow telomeres erosion. Black and gray bars represent mitochondria from young and old cells, respectively. The hexagon represents nucleus from a young cell while dark circle represents the morphological and heterochromatin changes in old cell.
The significance of this study lies in the potent anti-senescence activity of MB as well as in that MB is an FDA-approved drug, which encourages repurposing its clinical use of low concentration to delay cell senescence in vivo if the scientific research supports this approach. MB is very effective in delaying cellular senescence in vitro, which makes it an attractive for studying the concept of anti-senescence therapy in vivo [1,17]. However, the optimal concentration of MB for in vivo testing needs to be defined [62]. Additional pathological conditions that could benefit from MB include diabetes and Alzheimer’s disease. Due to its modulatory effect on AMPK, MB could benefit diabetes patients. Enhancing mitochondrial activity and complex IV and lowering cellular oxidants production by MB might prevent or delay the onset of mitochondrial dysfunction and energy hypometabolism in Alzheimer’s disease.
Conflict of interest
HA has a patent on Diaminophenothiazines.
Acknowledgment
This project was supported by the National Institute of Aging of NIH (R15AG041414), American Federation for Aging Research (AFAR) Research Grant Program, and Ames Foundation to HA.
References
- 1.Rodier F., Campisi J. Four faces of cellular senescence. J. Cell Biol. 2011;192:547–556. doi: 10.1083/jcb.201009094. [DOI] [PMC free article] [PubMed] [Google Scholar]
- 2.Baker D.J., Weaver R.L., van Deursen J.M. p21 both attenuates and drives senescence and aging in BubR1 progeroid mice. Cell Rep. 2013;3:1164–1174. doi: 10.1016/j.celrep.2013.03.028. [DOI] [PMC free article] [PubMed] [Google Scholar]
- 3.Tyner S.D., Venkatachalam S., Choi J., Jones S., Ghebranious N., Igelmann H., Lu X., Soron G., Cooper B., Brayton C., Park S.H., Thompson T., Karsenty G., Bradley A., Donehower L.A. p53 mutant mice that display early ageing-associated phenotypes. Nature. 2002;415:45–53. doi: 10.1038/415045a. [DOI] [PubMed] [Google Scholar]
- 4.Hinkal G.W., Gatza C.E., Parikh N., Donehower L.A. Altered senescence, apoptosis, and DNA damage response in a mutant p53 model of accelerated aging. Mech. Ageing Dev. 2009;130:262–271. doi: 10.1016/j.mad.2009.01.001. [DOI] [PMC free article] [PubMed] [Google Scholar]
- 5.Geng Y.Q., Guan J.T., Xu X.H., Fu Y.C. Senescence-associated beta-galactosidase activity expression in aging hippocampal neurons. Biochem. Biophys. Res. Commun. 2010;396:866–869. doi: 10.1016/j.bbrc.2010.05.011. [DOI] [PubMed] [Google Scholar]
- 6.Kassem M., Marie P.J. Senescence-associated intrinsic mechanisms of osteoblast dysfunctions. Aging cell. 2011;10:191–197. doi: 10.1111/j.1474-9726.2011.00669.x. [DOI] [PubMed] [Google Scholar]
- 7.Le Maitre C.L., Freemont A.J., Hoyland J.A. Accelerated cellular senescence in degenerate intervertebral discs: a possible role in the pathogenesis of intervertebral disc degeneration. Arthritis Res. Ther. 2007;9:R45. doi: 10.1186/ar2198. [DOI] [PMC free article] [PubMed] [Google Scholar]
- 8.Jeyapalan J.C., Ferreira M., Sedivy J.M., Herbig U. Accumulation of senescent cells in mitotic tissue of aging primates. Mech. Ageing Dev. 2007;128:36–44. doi: 10.1016/j.mad.2006.11.008. [DOI] [PMC free article] [PubMed] [Google Scholar]
- 9.Paradis V., Youssef N., Dargere D., Ba N., Bonvoust F., Deschatrette J., Bedossa P. Replicative senescence in normal liver, chronic hepatitis C, and hepatocellular carcinomas. Hum. Pathol. 2001;32:327–332. doi: 10.1053/hupa.2001.22747. [DOI] [PubMed] [Google Scholar]
- Erusalimsky J.D., Kurz D.J. Cellular senescence in vivo: its relevance in ageing and cardiovascular disease. Exp. Gerontol. 2005;40:634–642. doi: 10.1016/j.exger.2005.04.010. [DOI] [PubMed] [Google Scholar]
- 11.Martin J.A., Buckwalter J.A. The role of chondrocyte senescence in the pathogenesis of osteoarthritis and in limiting cartilage repair. J. Bone Joint Surg. Am. 2003;85-A(Suppl 2):S106–S110. doi: 10.2106/00004623-200300002-00014. [DOI] [PubMed] [Google Scholar]
- 12.Roberts S., Evans E.H., Kletsas D., Jaffray D.C., Eisenstein S.M. Senescence in human intervertebral discs. Eur. Spine J. 2006;15(Suppl 3):S312–S316. doi: 10.1007/s00586-006-0126-8. [DOI] [PMC free article] [PubMed] [Google Scholar]
- 13.Haruna Y., Kashihara N., Satoh M., Tomita N., Namikoshi T., Sasaki T., Fujimori T., Xie P., Kanwar Y.S. Amelioration of progressive renal injury by genetic manipulation of Klotho gene. Proc. Natl. Acad. Sci. USA. 2007;104:2331–2336. doi: 10.1073/pnas.0611079104. [DOI] [PMC free article] [PubMed] [Google Scholar]
- 14.Halloran P.F., Melk A. Renal senescence, cellular senescence, and their relevance to nephrology and transplantation. Adv. Nephrol. Necker Hosp. 2001;31:273–283. [PubMed] [Google Scholar]
- 15.Melk A., Halloran P.F. Cell senescence and its implications for nephrology. J. Am. Soc. Nephrol. 2001;12:385–393. doi: 10.1681/ASN.V122385. [DOI] [PubMed] [Google Scholar]
- 16.Hayflick L. The cell biology of aging. Clin. Geriatr. Med. 1985;1:15–27. [PubMed] [Google Scholar]
- 17.Tchkonia T., Zhu Y., van Deursen J., Campisi J., Kirkland J.L. Cellular senescence and the senescent secretory phenotype: therapeutic opportunities. J. Clin. Investig. 2013;123:966–972. doi: 10.1172/JCI64098. [DOI] [PMC free article] [PubMed] [Google Scholar]
- 18.Campisi J. Cellular senescence and apoptosis: how cellular responses might influence aging phenotypes. Exp. Gerontol. 2003;38:5–11. doi: 10.1016/s0531-5565(02)00152-3. [DOI] [PubMed] [Google Scholar]
- 19.Coppe J.P., Desprez P.Y., Krtolica A., Campisi J. The senescence-associated secretory phenotype: the dark side of tumor suppression. Annu. Rev. Pathol. 2010;5:99–118. doi: 10.1146/annurev-pathol-121808-102144. [DOI] [PMC free article] [PubMed] [Google Scholar]
- 20.Wagner G. Towards a life prolonging pill? Small molecules with anti-ageing properties. Curr. Drug Targets. 2006;7:1531–1537. doi: 10.2174/1389450110607011531. [DOI] [PubMed] [Google Scholar]
- 21.Naylor R.M., Baker D.J., van Deursen J.M. Senescent cells: a novel therapeutic target for aging and age-related diseases. Clin. Pharmacol. Ther. 2013;93:105–116. doi: 10.1038/clpt.2012.193. [DOI] [PMC free article] [PubMed] [Google Scholar]
- 22.Atamna H., Mackey J., Dhahbi J.M. Mitochondrial pharmacology: electron transport chain bypass as strategies to treat mitochondrial dysfunction. BioFactors. 2012;38:158–166. doi: 10.1002/biof.197. [DOI] [PMC free article] [PubMed] [Google Scholar]
- 23.Atamna H., Nguyen A., Schultz C., Boyle K., Newberry J., Kato H., Ames B.N. Methylene blue delays cellular senescence and enhances key mitochondrial biochemical pathways. FASEB J. 2008;22:703–712. doi: 10.1096/fj.07-9610com. [DOI] [PubMed] [Google Scholar]
- 24.Oz M., Lorke D.E., Petroianu G.A. Methylene blue and Alzheimer's disease. Biochem. Pharmacol. 2009;78:927–932. doi: 10.1016/j.bcp.2009.04.034. [DOI] [PubMed] [Google Scholar]
- 25.Roy Choudhury G., Winters A., Rich R.M., Ryou M.G., Gryczynski Z., Yuan F., Yang S.H., Liu R. Methylene blue protects astrocytes against glucose oxygen deprivation by improving cellular respiration. PLoS One. 2015;10:e0123096. doi: 10.1371/journal.pone.0123096. [DOI] [PMC free article] [PubMed] [Google Scholar]
- 26.Da-Silva S.S., Sajan I.S., Underwood J.P., 3rd Congenital methemoglobinemia: a rare cause of cyanosis in the newborn—a case report. Pediatrics. 2003;112:e158–161. doi: 10.1542/peds.112.2.e158. [DOI] [PubMed] [Google Scholar]
- 27.Callaway N.L., Riha P.D., Bruchey A.K., Munshi Z., Gonzalez-Lima F. Methylene blue improves brain oxidative metabolism and memory retention in rats. Pharmacol. Biochem. Behav. 2004;77:175–181. doi: 10.1016/j.pbb.2003.10.007. [DOI] [PubMed] [Google Scholar]
- 28.Stack C., Jainuddin S., Elipenahli C., Gerges M., Starkova N., Starkov A.A., Jove M., Portero-Otin M., Launay N., Pujol A., Kaidery N.A., Thomas B., Tampellini D., Beal M.F., Dumont M. Methylene blue upregulates Nrf2/ARE genes and prevents tau-related neurotoxicity. Hum. Mol. Genet. 2014;23:3716–3732. doi: 10.1093/hmg/ddu080. [DOI] [PMC free article] [PubMed] [Google Scholar]
- 29.Haluzik M., Nedvidkova J., Skrha J. The influence of NO synthase inhibitor and free oxygen radicals scavenger–methylene blue–on streptozotocin-induced diabetes in rats. Physiol. Res. 1998;47:337–341. [PubMed] [Google Scholar]
- 30.Dierks E.A., Burstyn J.N. The deactivation of soluble guanylyl cyclase by redox-active agents. Arch. Biochem. Biophys. 1998;351:1–7. doi: 10.1006/abbi.1997.0408. [DOI] [PubMed] [Google Scholar]
- 31.Forsyth N.R., Evans A.P., Shay J.W., Wright W.E. Developmental differences in the immortalization of lung fibroblasts by telomerase. Aging cell. 2003;2:235–243. doi: 10.1046/j.1474-9728.2003.00057.x. [DOI] [PubMed] [Google Scholar]
- 32.Jenkins N.C., Liu T., Cassidy P., Leachman S.A., Boucher K.M., Goodson A.G., Samadashwily G., Grossman D. The p16(INK4A) tumor suppressor regulates cellular oxidative stress. Oncogene. 2011;30:265–274. doi: 10.1038/onc.2010.419. [DOI] [PMC free article] [PubMed] [Google Scholar]
- 33.Parrinello S., Samper E., Krtolica A., Goldstein J., Melov S., Campisi J. Oxygen sensitivity severely limits the replicative lifespan of murine fibroblasts. Nat. Cell Biol. 2003;5:741–747. doi: 10.1038/ncb1024. [DOI] [PMC free article] [PubMed] [Google Scholar]
- 34.Ziegler D.V., Wiley C.D., Velarde M.C. Mitochondrial effectors of cellular senescence: beyond the free radical theory of aging. Aging Cell. 2015;14:1–7. doi: 10.1111/acel.12287. [DOI] [PMC free article] [PubMed] [Google Scholar]
- 35.Gomez-Cabrera M.C., Sanchis-Gomar F., Garcia-Valles R., Pareja-Galeano H., Gambini J., Borras C., Vina J. Mitochondria as sources and targets of damage in cellular aging. Clin. Chem. Lab. Med.: CCLM/FESCC. 2012;50:1287–1295. doi: 10.1515/cclm-2011-0795. [DOI] [PubMed] [Google Scholar]
- 36.Mileykovskaya E., Dowhan W. Cardiolipin membrane domains in prokaryotes and eukaryotes. Biochim. Biophys. Acta. 2009;1788:2084–2091. doi: 10.1016/j.bbamem.2009.04.003. [DOI] [PMC free article] [PubMed] [Google Scholar]
- 37.Mattiasson G., Friberg H., Hansson M., Elmer E., Wieloch T. Flow cytometric analysis of mitochondria from CA1 and CA3 regions of rat hippocampus reveals differences in permeability transition pore activation. J. Neurochem. 2003;87:532–544. doi: 10.1046/j.1471-4159.2003.02026.x. [DOI] [PubMed] [Google Scholar]
- 38.LeBel C.P., Ischiropoulos H., Bondy S.C. Evaluation of the probe 2′,7′-dichlorofluorescin as an indicator of reactive oxygen species formation and oxidative stress. Chem. Res. Toxicol. 1992;5:227–231. doi: 10.1021/tx00026a012. [DOI] [PubMed] [Google Scholar]
- 39.Di Stefano G., Manerba M., Vettraino M. NAD metabolism and functions: a common therapeutic target for neoplastic, metabolic and neurodegenerative diseases. Curr. Top Med. Chem. 2013;13:2918–2929. doi: 10.2174/15680266113136660207. [DOI] [PubMed] [Google Scholar]
- 40.Salminen A., Kaarniranta K. AMP-activated protein kinase (AMPK) controls the aging process via an integrated signaling network. Ageing Res. Rev. 2012;11:230–241. doi: 10.1016/j.arr.2011.12.005. [DOI] [PubMed] [Google Scholar]
- 41.Sohal R.S. Aging. cytochrome oxidase activity, and hydrogen peroxide release by mitochondria. Free Radic. Biol. Med. 1993;14:583–588. doi: 10.1016/0891-5849(93)90139-l. [DOI] [PubMed] [Google Scholar]
- 42.Han D., Williams E., Cadenas E. Mitochondrial respiratory chain-dependent generation of superoxide anion and its release into the intermembrane space. Biochem. J. 2001;353:411–416. doi: 10.1042/0264-6021:3530411. [DOI] [PMC free article] [PubMed] [Google Scholar]
- 43.Zhao Y., Wang Z.B., Xu J.X. Effect of cytochrome c on the generation and elimination of - and H2O2 in mitochondria. J. Biol. Chem. 2003;278:2356–2360. doi: 10.1074/jbc.M209681200. [DOI] [PubMed] [Google Scholar]
- 44.Rice L., Phoenix D.A., Wainwright M., Waring J.J. Effect of increasing methylation on the ability of methylene blue to cause diaphorase-catalysed oxidation of NADH. Biochem. Soc. Trans. 1998;26:S319. doi: 10.1042/bst026s319. [DOI] [PubMed] [Google Scholar]
- 45.Merker M.P., Bongard R.D., Linehan J.H., Okamoto Y., Vyprachticky D., Brantmeier B.M., Roerig D.L., Dawson C.A. Pulmonary endothelial thiazine uptake: separation of cell surface reduction from intracellular reoxidation. Am. J. Physiol. 1997;272:L673–680. doi: 10.1152/ajplung.1997.272.4.L673. [DOI] [PubMed] [Google Scholar]
- 46.Canto C., Auwerx J. NAD+ as a signaling molecule modulating metabolism. Cold Spring Harb. Symp. Quant. Biol. 2011;76:291–298. doi: 10.1101/sqb.2012.76.010439. [DOI] [PMC free article] [PubMed] [Google Scholar]
- 47.Fernandez-Marcos P.J., Auwerx J. Regulation of PGC-1alpha, a nodal regulator of mitochondrial biogenesis. Am. J. Clin. Nutr. 2011;93:884S–890. doi: 10.3945/ajcn.110.001917. [DOI] [PMC free article] [PubMed] [Google Scholar]
- 48.Suwa M., Nakano H., Kumagai S. Effects of chronic AICAR treatment on fiber composition, enzyme activity, UCP3, and PGC-1 in rat muscles. J. Appl. Physiol. 2003;95:960–968. doi: 10.1152/japplphysiol.00349.2003. [DOI] [PubMed] [Google Scholar]
- 49.Winder W.W., Holmes B.F., Rubink D.S., Jensen E.B., Chen M., Holloszy J.O. Activation of AMP-activated protein kinase increases mitochondrial enzymes in skeletal muscle. J. Appl. Physiol. (1985) 2000;88:2219–2226. doi: 10.1152/jappl.2000.88.6.2219. [DOI] [PubMed] [Google Scholar]
- 50.Zhang H., Davies K.J., Forman H.J. Oxidative stress response and Nrf2 signaling in aging. Free Radic. Biol. Med. 2015 doi: 10.1016/j.freeradbiomed.2015.05.036. in press. [DOI] [PMC free article] [PubMed] [Google Scholar]
- 51.Atamna H., Paler-Martinez A., Ames B.N. N-t-butyl hydroxylamine, a hydrolysis product of alpha-phenyl-N-t-butyl nitrone, is more potent in delaying senescence in human lung fibroblasts. J. Biol. Chem. 2000;275:6741–6748. doi: 10.1074/jbc.275.10.6741. [DOI] [PubMed] [Google Scholar]
- 52.Ido Y., Duranton A., Lan F., Cacicedo J.M., Chen T.C., Breton L., Ruderman N.B. Acute activation of AMP-activated protein kinase prevents H2O2-induced premature senescence in primary human keratinocytes. PLoS ONE. 2012;7:e35092. doi: 10.1371/journal.pone.0035092. [DOI] [PMC free article] [PubMed] [Google Scholar]
- 53.Wang W., Yang X., Lopez de Silanes I., Carling D., Gorospe M. Increased AMP:ATP ratio and AMP-activated protein kinase activity during cellular senescence linked to reduced HuR function. J. Biol. Chem. 2003;278:27016–27023. doi: 10.1074/jbc.M300318200. [DOI] [PubMed] [Google Scholar]
- 54.Sung J.Y., Woo C.H., Kang Y.J., Lee K.Y., Choi H.C. AMPK induces vascular smooth muscle cell senescence via LKB1 dependent pathway. Biochem. Biophys. Res. Commun. 2011;413:143–148. doi: 10.1016/j.bbrc.2011.08.071. [DOI] [PubMed] [Google Scholar]
- 55.Jiang P., Gan M., Ebrahim A.S., Castanedes-Casey M., Dickson D.W., Yen S.H. Adenosine monophosphate-activated protein kinase overactivation leads to accumulation of alpha-synuclein oligomers and decrease of neurites. Neurobiol. Aging. 2013;34:1504–1515. doi: 10.1016/j.neurobiolaging.2012.11.001. [DOI] [PMC free article] [PubMed] [Google Scholar]
- 56.Park S., Kim da S., Kang S., Shin B.K. Chronic activation of central AMPK attenuates glucose-stimulated insulin secretion and exacerbates hepatic insulin resistance in diabetic rats. Brain Res. Bull. 2014;108:18–26. doi: 10.1016/j.brainresbull.2014.08.002. [DOI] [PubMed] [Google Scholar]
- 57.Corton J.M., Gillespie J.G., Hawley S.A., Hardie D.G. 5-aminoimidazole-4-carboxamide ribonucleoside. A specific method for activating AMP-activated protein kinase in intact cells? Eur. J. Biochem./FEBS. 1995;229:558–565. doi: 10.1111/j.1432-1033.1995.tb20498.x. [DOI] [PubMed] [Google Scholar]
- 58.Liu L., Trimarchi J.R., Smith P.J., Keefe D.L. Mitochondrial dysfunction leads to telomere attrition and genomic instability. Aging Cell. 2002;1:40–46. doi: 10.1046/j.1474-9728.2002.00004.x. [DOI] [PubMed] [Google Scholar]
- 59.Parihar M.S., Brewer G.J. Mitoenergetic failure in Alzheimer disease. Am. J. Physiol. Cell Physiol. 2007;292:C8–23. doi: 10.1152/ajpcell.00232.2006. [DOI] [PubMed] [Google Scholar]
- 60.Davidson S.M., Duchen M.R. Endothelial mitochondria: contributing to vascular function and disease. Circ. Res. 2007;100:1128–1141. doi: 10.1161/01.RES.0000261970.18328.1d. [DOI] [PubMed] [Google Scholar]
- 61.Fukae J., Mizuno Y., Hattori N. Mitochondrial dysfunction in Parkinson's disease. Mitochondrion. 2007;7:58–62. doi: 10.1016/j.mito.2006.12.002. [DOI] [PubMed] [Google Scholar]
- 62.Harrison D.E., Strong R., Allison D.B., Ames B.N., Astle C.M., Atamna H., Fernandez E., Flurkey K., Javors M.A., Nadon N.L., Nelson J.F., Pletcher S., Simpkins J.W., Smith D., Wilkinson J.E., Miller R.A. Acarbose, 17-alpha-estradiol, and nordihydroguaiaretic acid extend mouse lifespan preferentially in males. Aging cell. 2014;13:273–282. doi: 10.1111/acel.12170. [DOI] [PMC free article] [PubMed] [Google Scholar]