

Abstract
Much of the computational power of the retina derives from the activity of amacrine cells, a large and diverse group of GABAergic and glycinergic inhibitory interneurons. Here, we identify an ON-type orientation-selective, wide-field, polyaxonal amacrine cell (PAC) in the rabbit retina and demonstrate how its orientation selectivity arises from the structure of the dendritic arbor and the pattern of excitatory and inhibitory inputs. Excitation from ON bipolar cells and inhibition arising from the OFF pathway converge to generate a quasi-linear integration of visual signals in the receptive field center. This serves to suppress responses to high spatial frequencies, thereby improving sensitivity to larger objects and enhancing orientation selectivity. Inhibition also regulates the magnitude and time course of excitatory inputs to this PAC through serial inhibitory connections onto the presynaptic terminals of ON bipolar cells. This presynaptic inhibition is driven by graded potentials within local microcircuits, similar in extent to the size of single bipolar cell receptive fields. Additional presynaptic inhibition is generated by spiking amacrine cells on a larger spatial scale covering several hundred microns. The orientation selectivity of this PAC may be a substrate for the inhibition that mediates orientation selectivity in some types of ganglion cells.
SIGNIFICANCE STATEMENT The retina comprises numerous excitatory and inhibitory circuits that encode specific features in the visual scene, such as orientation, contrast, or motion. Here, we identify a wide-field inhibitory neuron that responds to visual stimuli of a particular orientation, a feature selectivity that is primarily due to the elongated shape of the dendritic arbor. Integration of convergent excitatory and inhibitory inputs from the ON and OFF visual pathways suppress responses to small objects and fine textures, thus enhancing selectivity for larger objects. Feedback inhibition regulates the strength and speed of excitation on both local and wide-field spatial scales. This study demonstrates how different synaptic inputs are regulated to tune a neuron to respond to specific features in the visual scene.
Keywords: amacrine cell, neural circuits, orientation selectivity, receptive field, retina, synaptic transmission
Introduction
Synaptic inhibition plays a critical role in shaping the spatiotemporal properties of neurons. In cortex, both local feedback and longer-range feedforward afferents modulate excitatory signals by altering synaptic gain, exerting temporal control, and sharpening stimulus selectivities. In particular, cortical feedback inhibition has been shown to function locally, as in the temporal control of principal neuron excitation, and globally, as in the pacing of gamma oscillations across populations of interneurons and pyramidal cells (for review, see Isaacson and Scanziani, 2011). The array of different functions seen in cortical inhibitory circuits is dependent on the diverse morphology, stratification, and specific connectivity of inhibitory interneurons.
As in the cortex, the retina utilizes a variety of inhibitory interneurons to regulate the spatiotemporal properties of excitatory signals both locally and globally. This diverse group of interneurons, the amacrine cells, comprise upward of 30 different morphological subtypes (MacNeil and Masland, 1998; MacNeil et al., 1999) and are thought to perform inhibitory tasks over a wide range of spatial scales. GABAergic amacrine cells shape many of the feature selectivities found in retinal ganglion cells (RGCs), such as direction of motion (Caldwell et al., 1978; Ariel and Daw, 1982; Kittila and Massey, 1997), orientation (Venkataramani and Taylor, 2010), spatiotemporal frequency (Russell and Werblin, 2010; Venkataramani et al., 2014), and local object motion (Olveczky et al., 2003, 2007; Baccus et al., 2008). Many of these inhibitory roles require spatial integration over large areas, which is thought to be the province of wide-field amacrine cells (WFACs). However, WFACs can also be specialized for local dendritic processing, as in the reciprocal feedback circuitry between A17 amacrine cells and rod bipolar cells (Hartveit, 1999; Chávez et al., 2006; Grimes et al., 2010). Moreover, retinal inhibitory circuits often use serial GABAergic synapses between amacrine cells (Dowling and Boycott, 1966; Dowling, 1968; Chun and Wässle, 1989; Pourcho and Owczarzak, 1989; Koontz and Hendrickson, 1990; Marc and Liu, 2000), which are important for the spatial and temporal regulation of bipolar cell outputs (Zhang et al., 1997; Eggers and Lukasiewicz, 2010, 2011).
Of the ∼30 morphologically described amacrine cells in the rabbit retina, the majority of functional recordings have come from only three cell types: a narrow-field glycinergic cell (AII amacrine cell) and two wide-field GABAergic cells (starburst and A17 amacrine cells). Here, we identified a morphologically distinct type of WFAC in the rabbit retina that can be further classified as a polyaxonal amacrine cell (PAC). PACs were originally identified in the rabbit by Famiglietti (1992a,b,c), and are characterized by their multiple, thin axon-like processes that have been shown in the primate to transmit signals for millimeters across the retina (Greschner et al., 2014). However, unlike these previous examples, the PAC described here displays strong orientation selectivity due to its dendritic structure and the arrangement of its synaptic inputs, and may represent a major source of orientation-selective (OS) signaling in the retina. We used voltage-clamp recordings and pharmacological manipulations to elucidate the synaptic mechanisms that produce the spatiotemporal receptive field (RF) properties of these neurons.
Materials and Methods
Tissue preparation.
Experiments involving animals were done in accordance with the National Institutes of Health guidelines, and all procedures were approved by the Oregon Health and Science University Institutional Animal Care and Use Committee. Pigmented rabbits aged 5 weeks and older of either sex were dark adapted for at least 1 h before isolating the retina. After dark adaptation, all procedures were performed under dim red or infrared illumination. Rabbits received an intramuscular injection of ketamine (50 mg/kg) and xylazine (10 mg/kg). Surgical anesthesia was induced by intravenous delivery of sodium pentobarbital, and both eyes were removed. After surgery, the animal was euthanized by intravenous overdose of sodium pentobarbital (40 mg/kg) followed by 2.5 ml of potassium chloride (3 m). A piece of inferior retina ∼2 cm2 was placed in a recording chamber (∼0.5 ml volume), photoreceptor side down, and continuously perfused at ∼4–5 ml/min with Ames medium (Ames and Nesbett, 1981; U.S. Biologicals) equilibrated with carbogen (95% O2/5% CO2) at ∼34°C, pH 7.4. For all experiments, the orientation of the retina was adjusted such that a horizontal stimulus on a CRT computer monitor was parallel to the visual streak.
PA1/3 cell identification and electrophysiology.
PA1/3 cells were visualized with either a 20× (0.95 NA) or a 40× (0.8 NA) water immersion objective, using a video camera mounted on an upright Olympus BX-51 microscope with infrared (900 nm) differential interference contrast optics. The 40× objective was only used to locate PA1/3 somas, and was switched to a 10× (0.3 NA) water-immersion objective for visual stimulation covering a field of view ∼2 mm diameter. The 20× objective was used for visual stimuli during initial experiments and receptive field mapping. For extracellular recordings, a 5× objective was used to generate area response curves out to a stimulus area of ∼4.5 mm diameter. PA1/3 cells were initially identified based on their small, oblong somas (∼10–15 μm diameter, major axis), oriented roughly parallel to the visual streak. They were physiologically identified using extracellular spike recordings and often whole-cell voltage-clamp recordings, and the morphology of many cells was visually confirmed after recording by including 0.4% Alexa Fluor-488/594 hydrazide in the recording pipette.
Patch electrodes were pulled from borosilicate glass to a final resistance of 4–6 MΩ and were wrapped in Parafilm to reduce pipette capacitance. For voltage-clamp recordings, pipettes were filled with an intracellular solution containing the following (in mm): 128 Cs-methanesulphonate, 6 CsCl, 10 Na-HEPES, 5 phosphocreatine-Na2, 1 EGTA, 2 Mg-ATP, 1 Na-GTP, and 3 QX-314 chloride. The solution was adjusted to pH 7.3 using CsOH. Cesium was included in place of potassium to block voltage-gated potassium currents, thereby improving the voltage clamp at positive potentials. QX-314 was included to block voltage-gated sodium channels and abolish spiking activity. For current-clamp recordings, all solution components were the same except potassium was used in place of cesium, and QX-314 was not included. For extracellular spike recordings, the pipettes were filled with Ames medium. Currents were sampled at 10 kHz and filtered at 2 kHz through the four-pole Bessel filter in an EPC-10 patch clamp amplifier (HEKA). Further filtering was performed off-line during data analysis. Voltages were corrected for a liquid junction potential of −13 mV. Series resistance errors were compensated up to 70% online. The average series resistance was 16.7 ± 0.46 MΩ (n = 103). Pharmacological agents were added directly to the superfusion solution. The following drugs were used: 6-imino-3-(4-methoxyphenyl)-1(6H)-pyridazinebutanoic acid hydrobromide [SR-95531 (SR); 10 μm; Tocris Bioscience, catalog #1262], (1,2,5,6-tetrahydropyridin-4-yl)methylphosphinic acid (TPMPA; 100 μm; Tocris Bioscience, catalog #1040), strychnine (1 μm; Sigma, catalog # S-8753), l-(+)-2-amino-4-phophonobutyric acid (l-AP4; 25 μm; Tocris Bioscience, catalog #0103), d-(−)-2-amino-5-phophonopentanoic acid (d-AP5; 50 μm; Abcam Biochemicals, catalog #120003), 1-(4-aminophenyl)-3-methylcarbamyl-4-methyl-3,4-dihydro-7,8-methylenedioxy-5H-2,3-benzodiazepine hydrochloride [GYKI-53655 (GYKI); 50 μm; Tocris Bioscience catalog #2555), and tetrodotoxin citrate (TTX; 200 nm; Abcam Biochemicals, #120055).
Data analysis.
Light-evoked synaptic conductances were calculated as described previously (Taylor and Vaney, 2002), with a few modifications. Briefly, current–voltage (I–V) relations were measured at 10 ms intervals over a range of voltage steps from −103 to +17 mV in 20 mV increments. The total light-evoked conductance was calculated as the difference between the I–V relation at each time point and the “leak” I–V relation measured just before the onset of the light stimulus. To avoid errors in calculating the net light-evoked currents due to a sloping baseline during positive voltage steps, a single exponential trend was subtracted from the current traces for each voltage step before the leak subtraction. The excitatory and inhibitory conductances could then be calculated at each time point using the observed I–V reversal potential along with the cation and chloride reversal potentials (Taylor and Vaney, 2002).
Accurate calculation of the inhibitory and excitatory conductance components is dependent on the values assigned to the cation and chloride reversal potentials. PA1/3 cells have extensive dendritic processes, and the estimation of inputs located distally to the voltage-clamped soma is particularly susceptible to space-clamp errors. Space-clamp errors cause the membrane potential at points remote from the recording electrode to lie between the command potential and the zero-current or resting potential, with the result that there is a positive shift in the measured cation reversal potential. We measured the magnitude of such positive shifts by blocking all inhibitory inputs with strychnine, SR-95531, and TPMPA and recording the isolated excitatory currents in response to flashed annuli and spots. The measured excitatory reversal potential became more positive as the annulus diameter was increased and more distal inputs were activated. In the same experiments, at the largest diameters (≥600 μm), the maximum positive shift in the reversal potentials measured for the spot stimuli (average, ∼8 mV; 600 μm diameter; n = 3) was considerably less than for the annuli (average, ∼26 mV; 600 μm diameter; n = 3). This is to be expected since the bulk of the synaptic conductance is activated at diameters less than ∼600 μm (see area-response measurements below) where the voltage-clamp errors are smaller. To partially mitigate the effects of space-clamp errors, we used the cation reversal potential appropriate for each stimulus spot diameter, as this was the primary stimulus used in this study. This procedure obviated the erroneous calculation of negative inhibitory conductances that arises when the measured synaptic reversal potential is more positive than the reversal potential assigned to excitation. The chloride reversal potential (ECl) was calculated to be −70 mV. Because ECl lies close to the resting membrane potential of the cell, where the total membrane current is generally small, space-clamp errors will not be as large, and the actual membrane potential will be closer to the command potential. Therefore, we did not attempt to correct the values of ECl during the conductance analysis.
As shown below, PA1/3 cells receive synaptic inputs mediated by NMDA receptors. To account for the I–V relations, the excitation was modeled as the sum of a linear AMPA I–V relation and a nonlinear NMDA I–V relation. The nonlinear NMDA conductance used the same reversal potentials as the linear excitatory conductance and was calculated as described previously (Venkataramani and Taylor, 2010).
Conductances were normalized according to the equation Gnorm = (Gavg/Gcell) * Gdiam, where Gnorm is the normalized conductance for a particular stimulus diameter, Gcell is the average peak conductance across all stimulus diameters for a single cell under control conditions, Gavg is the mean Gcell across all cells, and Gdiam is the peak conductance for a particular stimulus diameter. Excitatory conductances were normalized using the peak excitatory conductance during a bright flash, whereas inhibitory conductances were normalized using the peak inhibitory conductance during a dark flash. The normalization factor, Gavg/Gcell, obtained under control conditions, was used to normalize the conductances during drug applications.
Receptive field sizes were estimated from area-response data and fit to a difference of Gaussians function:
where R is the spike rate (or peak conductance) evoked by a stimulus of diameter s, Kexc and Kinh are the amplitudes of the excitatory and inhibitory Gaussians, respectively, and σexc and σinh are their space constants. For conductance area response curves, points were taken at either the peak conductance for either the dark or bright flash, or at the time point most relevant for the particular drug application. All area response curves were generated using normalized conductance data.
The contribution of the tonic excitatory input in producing quasi-linear responses was estimated from the ratio of the magnitude of the integrated excitatory conductance during the negative (OFF) and positive (ON) phases of the visual stimuli (see Fig. 9C). For spiking responses, the change in frequency doubling with increasing spatial frequency was calculated by dividing the integral of the peristimulus spike time histogram (PSTH) during the second half of the contrast-reversing cycle by the integral over the full cycle (see Fig. 9F). An integral ratio of 1 indicates no frequency doubling, whereas a ratio of 0.5 indicates complete frequency doubling, with no response at the fundamental frequency.
Figure 9.

OFF inhibition and tonic ON excitation contribute to a quasi-linear summation of contrast. A contrast-reversing grating was used to probe the linearity of the input summation. A, PSTHs for a single contrast-reversing cycle at different phases (grating positions relative to the soma; n = 8). Gratings were oriented in the “preferred” orientation, parallel to the visual streak. B, Normalized integral of PSTH versus phase angle under control conditions and with inhibitory blockade (10 μm SR + 1 μm strychnine; pink; n = 6). C, Integrated excitatory conductance during positive versus negative contrast stimuli (includes 7 stimulus diameters out to 2 mm; n = 58–72). The reduction of the excitatory conductance in response to negative contrast is 35.9% of its increase in response to positive contrast (red fitted line). Colored rings indicate the stimulus spot size (100–2000 μm). D, Fourier analysis of voltage responses produced by a sine wave, contrast-reversing grating, with the phase set to the null point (0°). The contrast reversal was sine wave modulated at 0.5 Hz. Blocking inhibition (pink) produced a significant increase in the amplitude at 1 Hz (p = 0.02, n = 8). Inset, Sample voltage responses from a single cell. E, PSTHs in response to contrast-reversing gratings with antinodes centered over the soma (phase, 90°) for both preferred (parallel to the visual streak, black) and null (perpendicular to the visual streak, red) orientations over a range of spatial frequencies (n = 9). F, Integral ratio (∫PSTHhalf cycle/∫PSTHwhole cycle) versus spatial frequency for both null and preferred oriented gratings (n = 25). Open circles are a subtraction between preferred and null oriented gratings, and are fit with a Gaussian function. *p < 0.05, Student's t test.
Visual stimulation.
Light stimuli were generated on a CRT computer monitor at a refresh rate of 85 Hz. The monitor screen was projected onto the retina through a water-immersion objective, as described above, and focused onto the photoreceptors. Contrast was defined as C = 100(Lmax − Lmin)/(Lmax + Lmin), where Lmax and Lmin are the maximum and minimum intensities of the stimulus, respectively. The standard stimulus comprised a circular spot centered over the soma of the cell and square-wave modulated at 0.5 Hz on a steady background of ∼103 photons/μm2/s, well above the scotopic range.
For the oriented bar stimuli, a 150 × 1000 μm flashing bar was presented at angles in 30 degree increments and was square-wave modulated at 0.5 Hz. All extracellular recordings were done at 80% contrast. The contrast-reversing grating stimulus was a sine-wave grating that was square-wave modulated at 0.5 Hz. RF mapping was done under voltage clamp at a holding potential of −73 mV, using 60 μm squares of light presented for 0.5 s at 80% contrast. Unless specified otherwise, voltage-clamp recordings using flashing spot stimuli were done at 40% contrast. Higher contrast was used for the RF mapping because the measured currents were small.
Intracellular labeling.
PA1/3 cells were dye filled by including 0.4% Alexa Fluor-488/594 hydrazide in the recording pipette. Retinas were fixed in 4% paraformaldehyde for 45 min, followed by two 5 min washes in 0.1 m PBS, pH 7.4. Confocal micrographs were obtained on an Olympus FV1000 confocal microscope with a 40× oil-immersion objective (1.3 NA). Images displaying cellular morphology are maximum intensity Z-projections of an image stack. Figure 1D–F are single frames from an image stack. Primary antibodies against choline acetyltransferase (goat-anti-ChAT; Millipore, AB144P) were detected with anti-goat Alexa Fluor-594-conjugated secondary antibodies to measure the stratification depth of PA1/3 cells. For immunostaining, fixed retinas were blocked for 3 h in 3% normal horse serum (NHS), 0.5% Triton X-100, and 0.025% NaN3 in PBS, pH 7.4. Primary antibodies were diluted in the same solution and applied for 4 d at ∼25°C. After two 15 min washes in PBS, secondary antibodies were applied in 3% NHS, 0.025% NaN3 in PBS, pH 7.4, overnight at room temperature.
Figure 1.

A polyaxonal amacrine cell in the rabbit retina. A, A polyaxonal amacrine cell (PA1/3) filled with Alexa Fluor-488 fluorescent dye, with asterisks marking axonal branches. B, Enlarged view of the demarcated area in A, showing multiple axons branching from thicker proximal dendrites. C, X–Z image stack of a PA1/3 cell (green) with staining for ChAT (red) showing dendritic stratifications in layers S1 and S3 of the IPL. D–F, Images of the main dendritic stratification levels in the GCL (D), S3 (E), and S1 (F) for the same cell as in C. Yellow dendrites correspond to those seen in C. G, A reconstruction of a PA1/3 cell filled with 0.3% Neurobiotin, revealing a network of electrically coupled cells.
In some cells, 0.3% Neurobiotin was included in the recording pipette to test for coupling via gap junctions. A whole-cell patch-clamp recording was maintained for 10–20 min to allow the dye to fill the neuron, before gently pulling the pipette off the cell. To allow additional time for the dye to spread throughout the cell, the retina was held in the recording chamber with constant perfusion for an additional 2–3 h before fixing.
Computer reconstruction and image analysis.
A few representative cells that had been filled with Alexa Fluor dye or Neurobiotin were morphologically reconstructed using the Neuromantic neuronal reconstruction tool (Myatt et al., 2012). Analysis of confocal image stacks was done using Fiji (ImageJ; Schindelin et al., 2012).
Statistics.
Error bars in figures represent ± SEM, as do the shaded areas on the conductance traces. Statistical comparisons were made between control and drug conditions using two-tailed Student's t tests in Igor Pro 6.3. Results were considered significant if p < 0.05.
Results
Anatomical properties of a displaced polyaxonal amacrine cell
The PAC that we targeted had a soma displaced to the ganglion cell layer and was initially identified by extracellular spike recordings. The cells typically had small, oblong somas (10–15 μm diameter, major axis) that were oriented roughly parallel to the visual streak. The size and shape of the soma, the distinct spiking pattern, the physiological receptive field size, the dendritic morphology, and the characteristics of the synaptic inputs defined the cell type. We visualized the dendritic morphology by filling the cells with a fluorescent dye, Alexa Fluor-488, during the recordings. Two types of processes could be distinguished: thicker, spiny dendrites that arose from the soma, and thinner, aspiny, putative axons. The axons always branched off a dendrite and extended for millimeters across the retina, far beyond the reach of the larger-caliber dendritic arbor (Fig. 1A,B). Overall, the dendritic arbors tended to be elongated parallel to the visual streak, with a maximum extension of 729 ± 24 μm (n = 10).
We measured the vertical stratification depth of the dendrites to determine whether the cells are likely to receive inputs from ON or OFF bipolar cells. The stratification depth was determined relative to the dendrites of ON and OFF starburst amacrine cells, which were revealed by staining retinas with antibodies against choline acetyltransferase (ChAT). The ON and OFF ChAT bands narrowly stratify in layers S2 and S4 of the inner plexiform layer (IPL; Fig. 1C). Typically, the PACs had two or three primary dendrites, which extended along the ganglion cell layer for 115 ± 9 μm (n = 9) before rising to stratify in S3, just above the ON-ChAT band, and in S1, just above the OFF-ChAT band (Fig. 1C–F). In all cases (n = 9), the dendrites first branched to S3 before transitioning to S1, with the result that the S1 dendritic segments tended to be more distal than those in S3. Occasionally, a dendrite would return to S3 after branching in S1 (Fig. 1C). The transitions between S3 and S1 were typically abrupt, leaving little dendritic length for potential synaptic contacts in intervening layers. This stratification pattern implies convergent input from the two major signaling pathways in the retina, as layers S3 and S1 contain ON and OFF bipolar cell axon terminals, respectively. Furthermore, the putative axons narrowly stratified to the S3/S4 border, suggesting that their postsynaptic targets are likely ON-type cells.
PACs with elongated dendritic arbors have been described in previous morphological surveys in the rabbit retina, namely, PA3 and type V cells (Famiglietti, 1992c; Völgyi et al., 2001). These cells share many features with the PAC described here, but later we will discuss some key differences. Because of our uncertainty as to its novelty, we will refer to this cell type as PA1/3 after its dendritic bistratification and axonal processes.
Tracer coupling
Electrical or tracer coupling via gap junctions has been observed in many cell types in the retina (Raviola and Gilula, 1973; Lamb and Simon, 1976; Smith and Vardi, 1995; Vardi and Smith, 1996; DeVries et al., 2002), including PACs (Völgyi et al., 2001; Wright and Vaney, 2004; Greschner et al., 2014), and has been shown to produce correlated firing between coupled cells (Vardi and Smith, 1996; for review, see Bloomfield and Völgyi, 2009). The addition of 0.3% Neurobiotin to the recording electrode revealed that PA1/3 cells are tracer coupled to a number of other cells in close proximity (Fig. 1G). Many of the coupled cells appear to be morphologically uniform, with two or three primary dendrites that extend for several hundred microns. Although the tracer fills were limited, the cells appear to be morphologically similar to PA1/3 cells. However, it was not possible to clearly identify them.
An orientation-biased receptive field
The stratification of the dendrites to S3 and S1 indicate that PA1/3 cells are positioned to receive inputs from both ON and OFF bipolar and amacrine cells. To test this, we first recorded extracellular action potentials in PA1/3 cells in response to a spot, centered on the soma and square-wave flickered at 0.5 Hz with 80% contrast. Under photopic background illumination of 103 photons/μm2/s, PA1/3 cells fired tonically at 4.6 ± 1.7 Hz (n = 154). During the positive contrast phase of the flicker stimulus, the cells fired a transient burst of spikes (74.7 ± 3.2 Hz, 600 μm diameter spot) that rapidly declined (∼80 ms time constant) to a maintained level of 11.0 ± 2.1 Hz (Fig. 2A). The cells did not respond to the negative contrast phase of the stimulus. Therefore, despite the consistent dendritic stratification in the OFF sublamina, PA1/3 cells can be classified as ON-type cells. The extent of the physiological RF was estimated by plotting the number of spikes elicited over a range of stimulus spot diameters (area response curve, Fig. 2B). Fitting the data to a difference of Gaussians function indicated that the physiological RF had a spatial extent of ∼636 μm (2λ), which closely matches the average maximal extent of PA1/3 dendritic arbors (∼730 μm), indicating that the excitatory input is delineated by the dendritic arbor.
Figure 2.
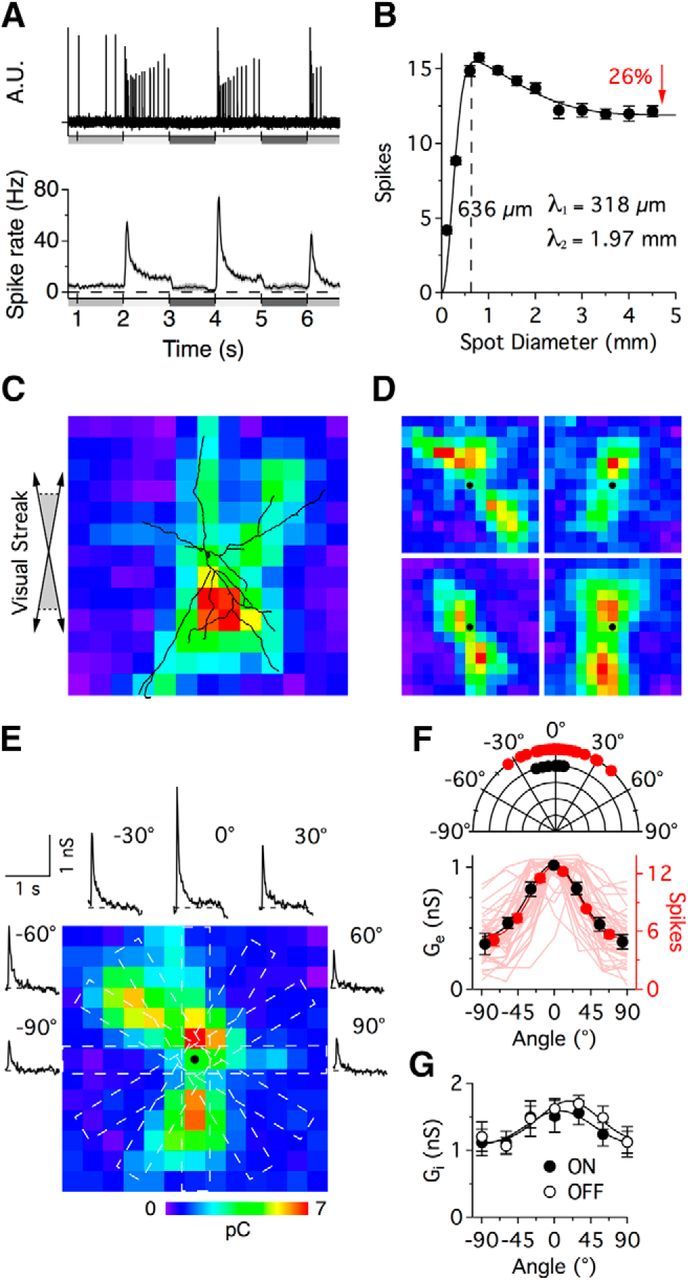
Receptive field properties of PA1/3 cells. A, Example extracellular recording (top) and average peristimulus spike time histogram (bottom, n = 128) showing action potentials in response to a 600 μm diameter flashing spot stimulus. Luminance is indicated by the shaded bars underneath the traces. B, Spike count in response to a flashing spot ranging from 100–4500 μm diameter (n = 128) is fit with a difference of Gaussians function; the two Gaussians have space constants of 318 μm and 1.97 mm. Surround suppression was limited to a 26% reduction in the spike output. C–E, Receptive field mapping of the excitatory inputs using a 60 × 60 μm flashing square stimulus, with black dots indicating the soma position. In C, the dendrites of the recorded cell were reconstructed and overlaid on the receptive field map. Angled arrows (left) portray uncertainties in the exact orientation of the retina between recording and imaging. E, Excitatory conductance measurements in response to an angled flashing bar stimulus (portrayed by white dotted bars) encircle the RF map and correspond to the indicated stimulus angle. F, Bottom, Average peak excitatory conductances (black, n = 9) and spike counts (red, n = 37) versus stimulus angle, with 0° corresponding to the maximal response. The individual spike tuning curves shown in the background are not normalized to 0°. Top, Preferred stimulus angle for individual spike tuning curves (red), obtained by taking the peak of a Gaussian fit to the data. The dominant orientations of the dendritic arbors in a separate population of cells are shown in black and were obtained using the Directionality algorithm in ImageJ. G, Inhibitory conductances recorded during both the bright and dark flashes were tuned similarly to the excitatory inputs. Each pixel on the RF maps is 60 × 60 μm.
The sparse branching and elongated dendritic arbor suggested that the structure of the excitatory receptive field might show marked asymmetries. Thus, we mapped the excitatory receptive field at higher spatial resolution under voltage clamp (Vhold = −73 mV) using an array of 60 μm squares arranged in a checkerboard (60 μm x and y offsets). We presented the stimulus at each location in isolation and estimated the response as the integral of the light-evoked EPSCs. The spatial structure of the resulting response maps correlated closely with the dendritic arbors of the cells (Fig. 2C) and were elongated parallel to the visual streak (Fig. 2D). It is noteworthy that the maps did not show excitatory input beyond the limits of the dendritic arbor, suggesting that potential inputs onto axonal processes do not contribute to the excitatory drive. Typically the response maps showed two “hot spots” located in the dendrites on either side of the soma (Fig. 2D). The generally weaker input over the soma is consistent with the finding noted in the anatomical analysis above, that the primary dendrites extended for ∼115 μm in the GCL before rising to stratify in S3, where they can first receive inputs from bipolar cells.
The asymmetry of the excitatory receptive field could confer orientation sensitivity on PA1/3 cells, and thus provide a substrate for orientation selectivity in rabbit RGCs, which has been shown to arise presynaptically from the activity of unspecified GABAergic amacrine cells (Venkataramani and Taylor, 2010). To test this, we centered a flashing bar (150 × 1000 μm) over the soma and varied its orientation. We found that the spike output was maximal for stimuli that were parallel to the major axis of the cell (n = 37; Fig. 2F, red). The preferred orientation was calculated as the angle at the peak of a Gaussian fit to the data. Measurements of the dominant orientation of the dendritic arbors, obtained using the “Directionality” algorithm (Liu, 1991; Tinevez, 2010) provided in ImageJ (Schindelin et al., 2012), indicated that the morphological orientation was similar to the preferred orientation obtained from the spiking data (Fig. 2F, top). The excitatory conductances in a subset of cells exhibited similar orientation tuning (n = 9; Fig. 2E,F, black). The inhibitory conductances showed weak orientation tuning along the same axis as the excitatory conductances (Fig. 2G), an arrangement that would be expected to countermand rather than enhance orientation tuning. Thus, OS responses are likely not due to inhibition, but to the asymmetry of the dendritic arbor and the arrangement of the excitatory inputs.
PA1/3 cells receive ON excitation and ON–OFF inhibition
The spiking responses suggest that PA1/3 cells receive a net excitatory drive through their dendrites in the ON sublamina. However, since these cells are bistratified, it is possible that they receive synaptic input from both the ON and OFF pathways. To determine which visual pathways drive the synaptic conductances, PA1/3 cells were voltage clamped to a series of holding potentials between −103 and +17 mV. At each voltage, light-evoked currents were recorded in response to a flashing spot of different sizes. Current traces from a single cell and population averages are shown in Figure 3. Current–voltage relationships were calculated at 10 ms intervals during the voltage steps, and at each time point, the excitatory and inhibitory conductances were calculated from best-fit I–V curves (see Materials and Methods). We incorporated an NMDA-mediated conductance to account for a nonlinearity in the I–V relations (Venkataramani and Taylor, 2010; see Materials and Methods). This analysis revealed an excitatory conductance that was activated during steps of positive contrast and suppressed with negative contrast (Fig. 3C,F, green), whereas inhibitory conductances occurred during both positive and negative contrast steps (Fig. 3C,F, red). These results agree with the spiking observed during the ON phase of the stimulus (positive contrast) and its sharp cessation during the OFF phase (negative contrast). Together, these data suggest that excitation arises from the ON pathway, whereas both ON and OFF pathways contribute inhibition. This hypothesis is consistent with the effects of applying the mGluR6 receptor agonist l-AP4, which selectively blocks signal transmission through ON bipolar cells (Slaughter and Miller, 1981). Blocking ON bipolar cells completely suppressed the excitatory conductance for all tested stimulus diameters (Fig. 4A,C). Inhibition was suppressed during the ON phase, whereas the OFF phase inhibition was unaffected (Fig. 4B,D).
Figure 3.
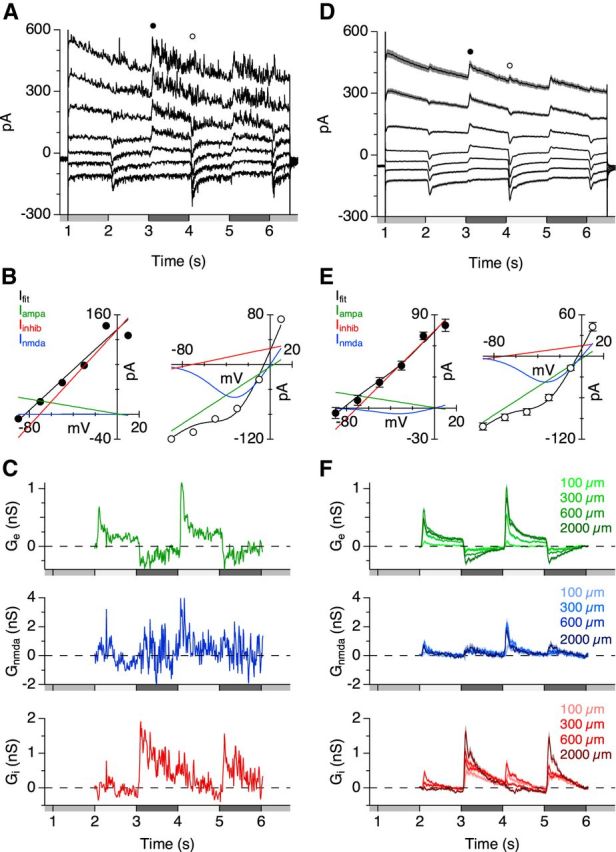
Conductance measurements allow for the separation of inhibitory, AMPA/kainate-mediated, and NMDA-mediated inputs. A–C, Data from a single cell for a 600 μm diameter flashing spot stimulus. D–F, Average data (n = 49–91). A, D, Light-evoked currents in PA1/3 cells during a series of voltage steps from −103 to +17 mV. B, E, The resulting I–V relations at the indicated time points in A and D during dark (left) and bright (right) light flashes. The solid lines indicate component fits to linear excitatory (AMPA/kainate, green), linear inhibitory (red), and NMDA-mediated (blue) currents. The black line is the total fit, which is a summation of the three components. C, F, Conductance calculations from the I–V curves measured every 10 ms during the light stimulus for AMPA/kainate receptor-mediated excitation (top), NMDA receptor-mediated excitation (middle), and inhibition (bottom). A range of stimulus diameters is shown for the average traces in F.
Figure 4.
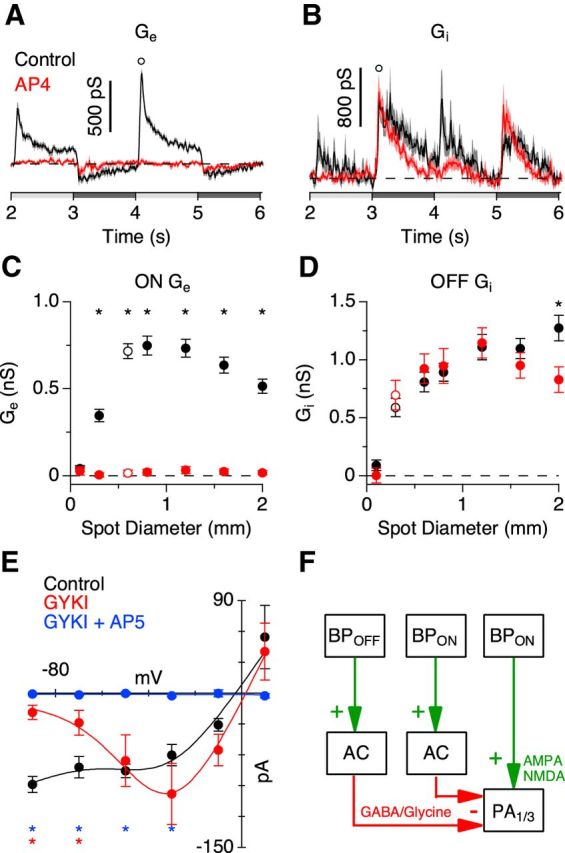
Excitatory inputs are ON pathway driven, whereas inhibitory inputs use both the ON and OFF pathways. A–D, Conductance traces (A, B) correspond to the stimulus diameters indicated by the open symbols in the area response curves (C, D). Data points were taken at the indicated time points in the conductance traces. Excitatory (A, C) and inhibitory (B, D) conductances in the presence of the mGluR6 agonist l-AP4 in response to a flashing spot stimulus (n = 19). E, I–V curve of the excitatory currents in response to a 600 μm diameter bright spot in the presence of the AMPA/kainate receptor antagonist GYKI-53655 and the NMDA receptor antagonist d-AP5 (n = 5). F, Proposed circuitry outlining the inhibitory and excitatory inputs to PA1/3 cells. BP, bipolar; AC, amacrine cell. *p < 0.05, Student's t test.
As noted above, the nonlinearity in the I–V relations was accounted for by including an NMDA component in the conductance analysis (Fig. 3B,E). We reasoned that if ON bipolar cells activate NMDA receptors on PA1/3 cells, then bath applying GYKI, an AMPA receptor antagonist, should limit the excitatory inputs to those mediated by NMDA receptors. In the presence of GYKI, the nonlinearity of the I–V relations was enhanced (Fig. 4E), as the inward current was strongly reduced at more negative potentials, consistent with the suppression of a linear AMPA receptor-mediated input. Addition of the NMDA receptor antagonist d-AP5 abolished the excitatory conductance seen in the presence of GYKI (Fig. 4E). These results establish a minimal model for the synaptic inputs to PA1/3 cells, which is illustrated in Figure 4F.
Presynaptic inhibition modulates the excitatory inputs
The spiking responses to a flashing spot of increasing diameter revealed that PA1/3 cells receive surround inhibition, which suppressed spiking by ∼26% for wide-field stimulation (Fig. 2B). Surround inhibition has been shown to originate from WFACs, which can produce strong, presynaptic suppression of both excitatory and inhibitory inputs to RGCs (Taylor, 1999; Flores-Herr et al., 2001; Buldyrev and Taylor, 2013; Venkataramani et al., 2014). Such presynaptic inhibition contributes to generating the center-surround organization of receptive fields in the retina, which enhances sensitivity to local contrast (Cook and McReynolds, 1998; Taylor, 1999; Flores-Herr et al., 2001; Völgyi et al., 2002). However, horizontal cells in the outer plexiform layer (OPL) can also produce presynaptic suppression in response to wide-field stimuli (Mangel, 1991; Dacey et al., 2000; Kamermans et al., 2001; McMahon et al., 2004; Ichinose and Lukasiewicz, 2005; Davenport et al., 2008; Babai and Thoreson, 2009). We sought to determine whether the observed surround inhibition in PA1/3 cells could be attributed to amacrine cells in the IPL or horizontal cells in the OPL. To distinguish between these two possibilities, we tested the effect of TTX, a voltage-gated sodium channel blocker, on light-evoked currents, because several studies showed that IPL-mediated surround inhibition in bipolar cells and RGCs is sensitive to TTX (Taylor, 1999; Demb et al., 2001; Flores-Herr et al., 2001; Shields and Lukasiewicz, 2003; Vigh et al., 2011; Buldyrev and Taylor, 2013; Venkataramani et al., 2014). TTX should have no effect on the excitatory conductance if the surround is mediated by the OPL, because horizontal cells do not fire action potentials, and they hyperpolarize in response to positive contrast. Bath application of TTX increased the peak ON excitatory conductance for spot diameters ≥600 μm (Fig. 5A). This result suggests that feedback inhibition from spiking amacrine cells onto bipolar cell axon terminals contributes to the inhibitory surround of the receptive field.
Figure 5.
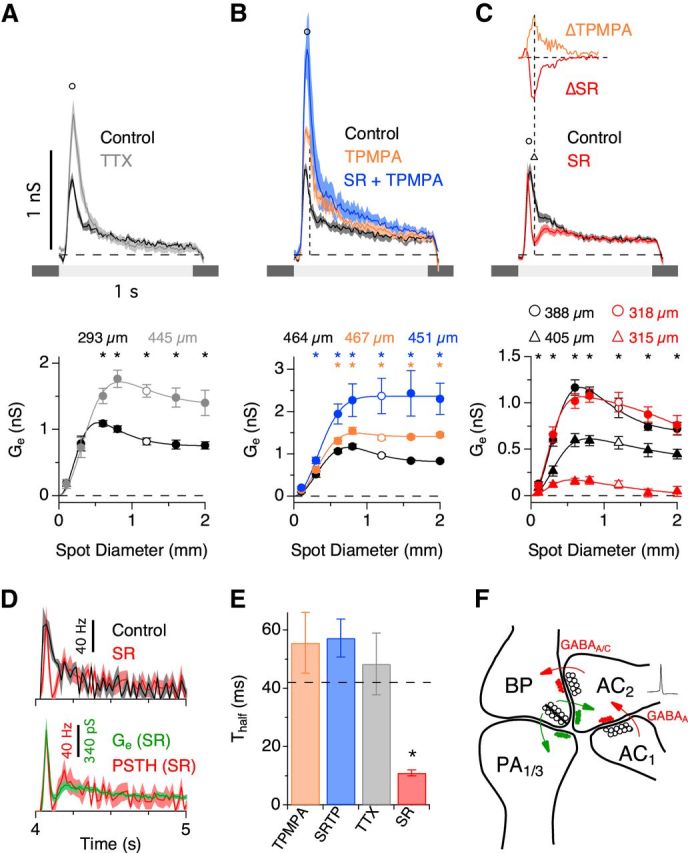
Serial GABAergic feedback inhibition modulates the temporal and spatial receptive field properties of PA1/3 cells. A–C, Excitatory conductance traces (top) corresponding to the stimulus diameters indicated by the open symbols in the area response curves (bottom). Data points were taken at the indicated time points in the conductance traces. The excitatory conductances in the presence of the voltage-gated sodium channel antagonist TTX (A; n = 5–7), the GABAC receptor antagonist TPMPA (B, orange; n = 7), the GABAA receptor antagonist SR-95531 (C, red; n = 16), and both GABAA and GABAC receptor antagonists together (B, blue; n = 6) are shown. Space constants for difference of Gaussian fits (solid lines) are shown above the area response curves. In C, the significance markers (asterisks) refer to the area response measurement taken at the delayed time point, 120 ms after light onset (triangles). C, Inset (top), Comparison of the time courses of the change in conductance for SR and TPMPA applications. D, Spike rate in the presence of SR versus control (top; n = 5) and spike rate versus the excitatory conductance, both in the presence of SR (bottom). E, Measurements of time to 50% decay (Thalf) for the different drug applications. F, Minimal circuit that could account for proposed serial feedback inhibition onto bipolar cell terminals. Note that AC2 is a wide-field spiking amacrine cell. BP, bipolar; AC, amacrine cell. *p < 0.05, Student's t test.
Bipolar cell axon terminals are known to express GABAC receptors (Feigenspan et al., 1993; Lukasiewicz and Werblin, 1994; Zhang and Slaughter, 1995; Lukasiewicz and Wong, 1997; Zhang et al., 1997; Dong and Werblin, 1998; Euler and Wässle, 1998; Lukasiewicz and Shields, 1998; Wässle et al., 1998; Shields et al., 2000; Vigh and von Gersdorff, 2005; Vigh et al., 2011), and in some cases GABAA receptors (Lukasiewicz and Shields, 1998; Völgyi et al., 2002; Vigh and von Gersdorff, 2005; Eggers and Lukasiewicz, 2006; Eggers et al., 2007; Russell and Werblin, 2010). We selectively blocked different GABA receptor subtypes to determine which receptor types were mediating feedback inhibition of bipolar cell terminals. Application of the GABAC receptor antagonist TPMPA potentiated the excitatory conductance and tended to increase its duration for spot diameters >300 μm (Fig. 5B,E, orange). In contrast, the excitatory conductance was attenuated in the presence of the GABAA receptor antagonist SR-95531 and displayed a rapidly damped oscillation that substantially reduced the duration (p = 0.0006, n = 16) of the excitatory response (Fig. 5C,E, red). During extracellular recordings, SR had the same effect on the spike rate as it did on the excitatory conductance (Fig. 5D), indicating that changes in the kinetics of the excitatory conductance have equivalent effects on the spike output.
The attenuated excitatory response during GABAA receptor blockade and the potentiated response during GABAC receptor blockade are suggestive of a feedback loop involving serial inhibition between two amacrine cells. A simple model that would account for our data is illustrated in Figure 5F. Here, blocking GABAA receptors disinhibits GABAC receptor-mediated feedback inhibition, causing the observed oscillatory and attenuated excitatory response (Fig. 5C, red). Conversely, blocking GABAC receptors disinhibits bipolar cell terminals, causing a potentiation of the excitatory response (Fig. 5B, orange). In support of this model, the change in conductance produced by GABAA or GABAC receptor blockade had the same delayed time course (Fig. 5C, inset), suggesting that serial feedback inhibition modulates the amount of GABA released onto bipolar cell terminals. Serial synapses such as this have been described in both electron microscopy (Dowling and Boycott, 1966; Dowling, 1968; Chun and Wässle, 1989; Pourcho and Owczarzak, 1989; Koontz and Hendrickson, 1990; Marc and Liu, 2000) and functional studies (Zhang et al., 1997; Eggers and Lukasiewicz, 2010, 2011; Chen et al., 2011).
If GABAC receptors are solely responsible for presynaptic suppression of bipolar cell terminals, then coapplication of SR and TPMPA should produce effects similar to the application of TPMPA alone. However, we found that blocking both GABAA and GABAC receptors caused a much larger increase in the excitatory conductance than that achieved with GABAC receptor blockade alone (Fig. 5B, blue). Together, these results support the hypothesis that a spiking WFAC (Fig. 5F, AC2) produces surround inhibition by activating both GABAA and GABAC receptors on bipolar cell terminals. Our data suggest that the relative strength of the two inhibitory serial synapses controls both the time course and the magnitude of the excitatory conductance, which in turn modifies the spiking output of PA1/3 cells.
Excitation is modulated by local microcircuits
The data in Figure 5 indicate that GABAergic feedback inhibition is highly active during wide-field visual stimulation (area-response curves). Upon close examination, however, the effects produced by the GABA receptor antagonists SR and TPMPA appear to be active on a smaller spatial scale than those produced by TTX. This seems reasonable, given that TTX blocks only action potential generation, and not the active postsynaptic receptors. Subthreshold depolarizations may still be able to trigger feedback inhibition onto cone bipolar cell terminals, as is the case with reciprocal feedback inhibition from A17 amacrine cells onto rod bipolar cells (Hartveit, 1999; Chávez et al., 2006; Grimes et al., 2010). Consistently, TTX did not potentiate the excitatory conductance nearly as much as SR plus TPMPA (Fig. 5A,B), suggesting that a portion of the feedback inhibition remained unblocked even though action potentials had been silenced. Thus, we hypothesized that feedback inhibition onto bipolar cell terminals can be activated on both local and wide-field spatial scales using spike-independent and spike-dependent mechanisms, respectively (Bieda and Copenhagen, 1999). We tested this by comparing the effects of TTX and GABA receptor blockade (SR plus TPMPA) on the excitatory conductance over a range of spatial scales. Blocking GABA receptors enhanced the excitatory conductance for both very small and large stimulus diameters (Fig. 6A), whereas TTX had no effect on the excitatory conductance unless the stimulus was ≥600 μm in diameter (Fig. 6B). These findings are consistent with the idea that the TTX-sensitive feedback inhibition is mediated by spiking in WFACs that require a relatively extensive stimulus to reach spike threshold. In contrast, the effects of blocking GABA receptors raise the possibility that inhibitory feedback can also operate on small spatial scales similar in size to the receptive field of a single bipolar cell in the rabbit retina (Mills and Massey, 1992; MacNeil et al., 2004), where it could be activated by graded potentials rather than spiking activity.
Figure 6.
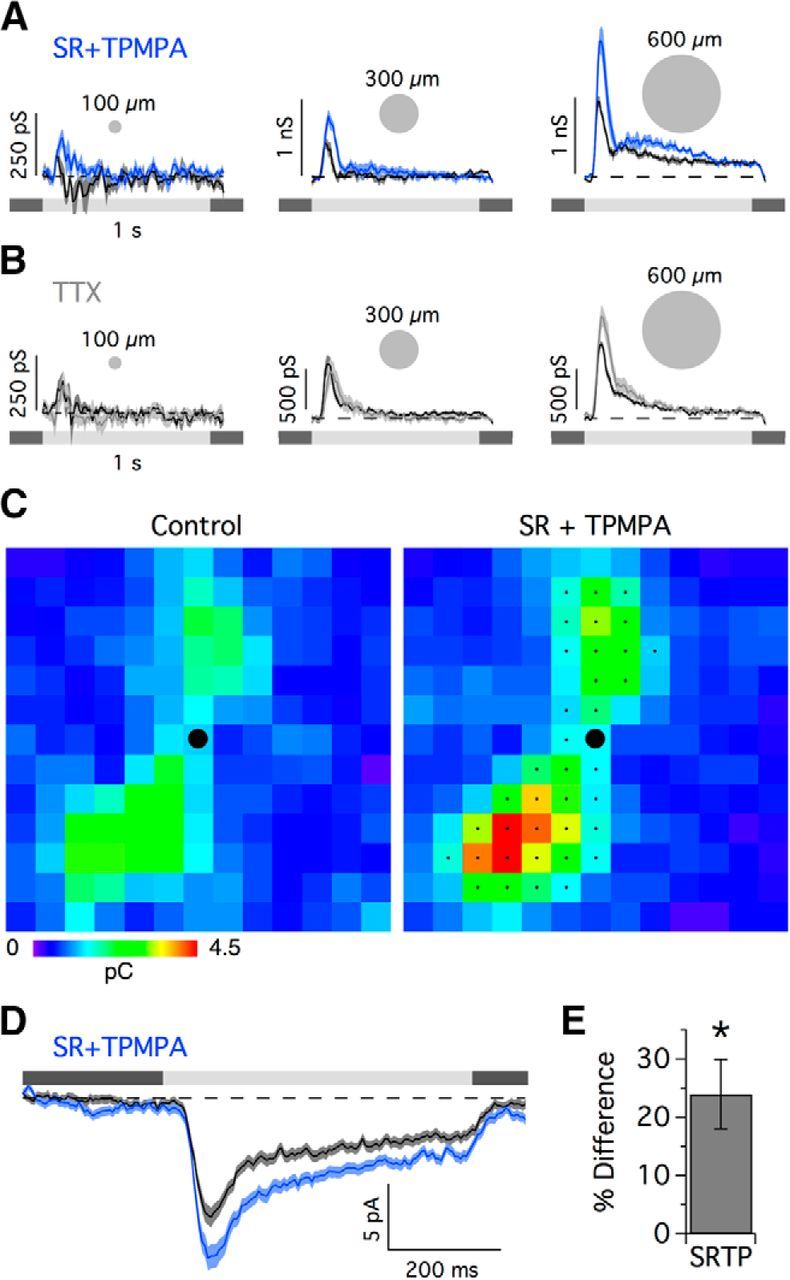
GABAergic feedback inhibition can operate locally without using action potentials. A, B, Excitatory conductance for the 100, 300, and 600 μm diameter stimulus spots in the presence of SR+TPMPA (A) and TTX (B). C, Receptive field map of the excitatory charge transfer (Vhold = −73mV) under control conditions (left) and with GABAergic blockade (right). D, For each cell, EPSCs from stimulus positions that passed greater charge than the average charge transfer across all stimulus positions were selected and averaged. The selected positions for the cell in C are indicated by the small black dots (n = 203 stimulus positions across 9 cells). E, Percentage difference in charge transfer for control versus SR+TPMPA for the selected stimulus positions (n = 9). *p < 0.05, Student's t test.
We tested whether single bipolar cells can activate feedback inhibition by mapping the excitatory inputs to PA1/3 cells as described previously, before and after GABAergic blockade (Fig. 6C,E). Since bipolar cell receptive fields in mammalian retinas are typically ∼20–60 μm in diameter (Famiglietti, 1981; Mills and Massey, 1992; Berntson and Taylor, 2000; MacNeil et al., 2004; Schwartz et al., 2012), each 60 μm stimulus square is large enough to activate only one or two bipolar cells of a given type at each location. The narrow stratification of the dendrites and the finding that excitation is driven exclusively through the ON pathway make it likely that only one or two of the five types of ON bipolar cells make input to PA1/3 cells. At each stimulus location, the average excitatory charge transfer (∫IEPSCdt) measured from EPSCs was 24.0 ± 5.9% larger in the presence of SR plus TPMPA compared to control (Fig. 6E). Thus, the total stimulus area required to evoke TTX-sensitive feedback (283,000 μm2; 600 μm diameter spot) is ∼80× larger than that needed to evoke SR/TPMPA-sensitive feedback (3600 μm2; 60 μm square). These data suggest that each bipolar cell activates local reciprocal GABAergic feedback inhibition that limits the strength of feedforward excitation. Serial GABAergic inhibition from other WFACs can further modulate the feedback strength (Fig. 5B,C).
Feedforward glycinergic and GABAergic inhibition operate on different spatial scales
In addition to modulating the excitatory inputs, inhibition also acts directly on PA1/3 cells through both the OFF and ON pathways. To determine the neurotransmitters involved and examine the spatial scale of the inhibition, we recorded light-evoked inhibitory currents in the presence of different receptor antagonists.
OFF inhibition was mediated by both GABAA and glycine receptors, since their respective antagonists (SR and strychnine) reduced the OFF inhibitory conductance (Fig. 7A,B), whereas applying both antagonists together fully eliminated it (Fig. 7A, inset). A difference of Gaussians function was fit to the area response plots to estimate the spatial extent of the inhibition. The glycinergic and GABAA inhibitory components had different spatial dimensions. The glycinergic component, recorded in the presence of SR, had a spatial extent of ∼534 μm (2λ; Fig. 7A), which is similar in size to the PA1/3 receptive field (2λ = 636 μm; Fig. 2B). Assuming the glycinergic inputs arise from numerous overlying amacrine cells, and not a single concentric cell, this result suggests that the receptive fields of the glycinergic amacrine cells are narrow relative to the dendritic arbor of PA1/3 cells. Thus, similar to the excitatory inputs from presynaptic bipolar cells, the extent of the glycinergic input is delineated by the PA1/3 dendritic arbor. If the receptive fields of the glycinergic neurons were comparable to or larger than the RF center of PA1/3 cells, then the glycinergic input would be activated over a correspondingly more extensive area, as is observed for the GABAergic inhibitory inputs. GABAergic inhibition was recorded in the presence of the glycine receptor antagonist strychnine and had a spatial extent of ∼1.5 mm (2λ; Fig. 7B), suggesting that it originates from overlapping WFACs that also cover large surrounding regions. These data are consistent with expectations from previous studies that have showed WFACs in mammalian retinas to be mostly GABAergic (Pourcho and Goebel, 1983), and narrow-field amacrine cells to be mostly glycinergic (Pourcho and Goebel, 1985; Menger et al., 1998).
Figure 7.
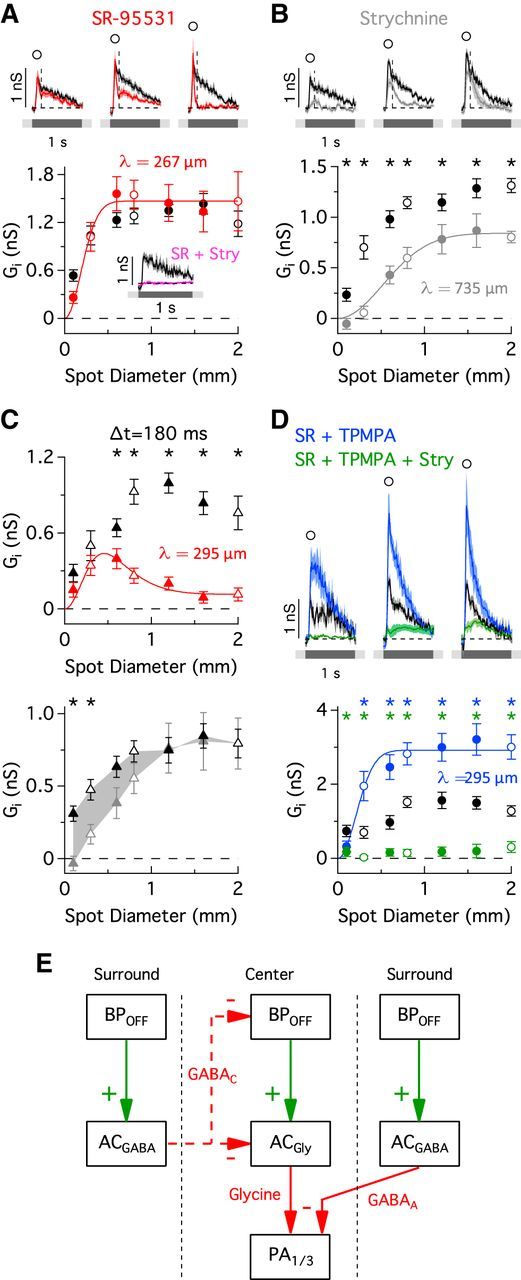
GABAergic and glycinergic OFF inhibitory inputs. A–D, Inhibitory conductances (top) are shown for stimulus diameters indicated by the open symbols in the area response curves (bottom) during application of SR (A, C, red; n = 16), strychnine (B, C, gray; n = 12), SR and TPMPA (D, blue; n = 5–7), and SR, TPMPA, and strychnine (D, green; n = 5–7). Data points were taken at the indicated time points in the conductance traces. A, Inset, Excitatory conductance in the presence of SR and strychnine (pink; n = 6) in response to a 600-μm-diameter stimulus spot. Difference of Gaussians fits to the area response curves were used to estimate the spatial extent (space constant, λ) of the inhibitory inputs. C, Area response curves for SR (top) and strychnine (bottom) applications at a delayed time point, 180 ms after onset of a dark spot when SR had its greatest effect (the time point is indicated by the vertical dashed lines on the conductance traces in A and B). E, Proposed minimal circuit diagram that can account for the effects that the GABAergic and glycinergic antagonists have on the OFF inhibitory conductance. Dashed red lines indicate alternative possibilities for mediating surround inhibition of the glycinergic inputs. BP, bipolar; AC, amacrine cell. *p < 0.05, Student's t test.
GABAC-mediated surround inhibition regulates the ON and OFF glycinergic inputs
The OFF glycinergic conductance, recorded during GABAA receptor blockade, became more transient as the size of the stimulus increased (Fig. 7A, red traces). This behavior is illustrated by plotting the amplitude of the inhibitory conductance at a fixed time point 180 ms after light offset, when SR had its greatest effect (Fig. 7C, top, red). The resulting area-response plot demonstrates that the glycinergic conductance is reduced to nearly zero in response to wide-field stimulation, and thus is subject to strong, but delayed, surround suppression. In support of this finding, strychnine blocked inhibition only for small spot diameters at the delayed time point, indicating that the glycinergic conductance was not present during wide-field stimulation (Fig. 7C, bottom). This putative surround inhibition of the glycinergic input was abolished by blocking GABAC receptors, which enhanced the OFF inhibition (Fig. 7D, blue). Subsequent application of strychnine strongly suppressed this conductance, indicating that it was largely glycinergic. It is noteworthy that the estimate of the spatial extent of the glycinergic conductance was similar (λ = 250–300 μm) under several experimental conditions (GABAA receptor blockade in Fig. 7A,C, red; GABAA/C receptor blockade in Fig. 7D, blue). Together, these data demonstrate that surround suppression of the OFF glycinergic inhibition is mediated by GABAC receptors, similar to the presynaptic suppression of excitation described above. A circuit model summarizing the data is shown in Figure 7E.
The inhibition observed during the ON phase of the stimulus was smaller and more variable across cells. The ON inhibition was completely suppressed by blocking glycine receptors (Fig. 8A) and displayed a strong receptive field surround that was blocked by applying GABA receptor antagonists (Fig. 8B). Although TPMPA alone did increase the inhibitory conductance for large stimulus diameters (data not shown), blocking both GABAA and GABAC receptors produced a larger and more reliable effect. A circuit model summarizing the ON glycinergic inputs is shown in Figure 8C. We should emphasize that the circuit diagrams proposed in Figures 5, 7, and 8 are preliminary and were constructed to contain the smallest number of connections that are consistent with the data.
Figure 8.

GABAergic inhibition controls the spatial extent of the ON glycinergic inputs. A, B, ON Inhibitory conductances in the presence of strychnine (A; n = 12) and SR+TPMPA (B; n = 6). The time point when the drug had the greatest effect was used for the area response curves. In A, it corresponds to the peak conductance (100 ms after light onset), whereas in B it corresponds to a slightly delayed time point (160 ms after light onset). C, Proposed minimal circuit diagram. Dashed red lines indicate alternative possibilities for mediating surround inhibition of the glycinergic inputs. BP, bipolar; AC, amacrine cell. *p < 0.05, Student's t test.
Together, these data demonstrate that PA1/3 cells receive feedforward glycinergic inhibition via both the ON and OFF pathways. Similar to the ON excitatory inputs, the OFF glycinergic inhibition was suppressed by a GABAC mediated surround. In the case of the ON glycinergic inhibition, its surround receptive field is likely mediated by both GABAA and GABAC receptors. The extent of the presynaptic surround for the glycinergic inhibitory inputs was similar to that seen for the excitation.
Receptive field organization
Transmission from photoreceptors through bipolar cells is inherently nonlinear since bipolar cells typically display low levels of maintained glutamate release during steady background illumination. Therefore, increases in release during preferred contrast stimulation tend to be larger than decreases in release during nonpreferred contrasts. Such rectification of bipolar cell output has been shown to produce nonlinear, “frequency-doubled” responses in Y-type ganglion cells during stimulation with a contrast-reversing grating (Enroth-Cugell and Robson, 1966; Hochstein and Shapley, 1976; Troy et al., 1989; Demb et al., 2001). These nonlinear response properties allow Y cells to respond to movement of fine textures with spatial dimensions smaller than the RF center, which enhances their sensitivity to motion. If PA1/3 cells are like Y cells, they will respond to randomly oriented fine textures in the visual scene indiscriminately, as null and preferred oriented gratings of high spatial frequency would provide approximately the same amount of positive contrast to drive the cell. In general, this would reduce the signal-to-noise ratio for orientation signals. A potential solution to this problem is to sum contrast within the RF center linearly, so that positive and negative contrast signals cancel, producing little or no response to high spatial frequency stimulation.
To test the linearity of the contrast summation in PA1/3 cells, we used a sinusoidal contrast-reversing grating stimulus where the phase of the grating was systematically adjusted from one trial to the next (Fig. 9A). For a purely linear system, there should be a null point for the phase, at which positive and negative contrast regions are equal and thus sum to zero. For each stimulus phase, spiking responses in PA1/3 cells were measured as the integral of the PSTH during a single contrast-reversing cycle. PSTHs were accumulated for multiple cycles over several trials. As expected for linear summation, the response amplitude passed through a minimum when the bright and dark areas over the RF were approximately equal (phase, 0°; Fig. 9A,B). However, a residual response at the null position was frequency doubled, with the response at each half-cycle being approximately equal, as expected for nonlinear summation of contrast (Fig. 9A). Spiking at the null point was reduced by 59.1 ± 5.8% (n = 6) relative to the phase that gave the maximal response (90° out of phase; Fig. 9B), indicating a quasi-linear summation of contrast.
Mechanisms for generating a quasi-linear summation of contrast
The reduction in spiking at the null point in Figure 9B could be due to a spike threshold in PA1/3 cells, partial linear summation of the synaptic inputs, or a combination of these and other mechanisms. A spike threshold could reduce responses at the null point, because a null-phase grating drives half of the receptive field with positive contrast at a given time, and therefore will produce smaller EPSPs than a grating at the optimal phase, which delivers positive contrast across the entire receptive field, and thus is more likely to generate EPSPs that reach spike threshold. The quasi-linear summation of contrast may also result from postsynaptic summation of excitatory inputs, since the data in Figure 3F (green) show that the excitatory conductance is modulated above and below a baseline level during positive and negative contrast phases of the stimulus, respectively. The reduction in the excitatory conductance during the negative phase was 35.9% as large as the increase during the positive phase (Fig. 9C), indicating that the net excitatory input will be partially rectified, obviating perfect cancellation.
The inhibitory inputs show similar but opposite rectification, since the amount of inhibition activated by negative contrast is larger than that activated by positive contrast (Fig. 3F, red). Previous studies have shown that crossover inhibition between the ON and OFF pathways is capable of producing more linear summation of contrast by effectively canceling concurrent excitatory inputs (Molnar et al., 2009; Werblin, 2010). To examine the potential role of crossover inhibition from the OFF pathway in generating quasi-linear summation of contrast in these ON-type PA1/3 cells, we applied SR and strychnine to block GABAA and glycine receptors. Blocking inhibition caused an increase in the baseline spike rate from 1.0 ± 0.27 Hz to 6.4 ± 0.67 Hz (n = 6, p = 0.0001), but it also reduced the attenuation of the normalized spike rate at the null point (34.3 ± 3.0% attenuation vs 59.1 ± 5.8% under control conditions, p = 0.0004, n = 6; Fig. 9B), suggesting that inhibition contributes to generating a more linear summation of contrast. Consistently, the addition of SR plus strychnine during current-clamp recordings increased the strength of frequency doubling at the null point, as evident from a significant increase in the response amplitude measured at the second harmonic of the stimulus frequency (p = 0.02, n = 8; Fig. 9D). Overall, our data suggest that modulation of tonic excitatory input from the ON pathway and crossover inhibitory inputs from the OFF pathway enable PA1/3 cells to integrate positive and negative contrast signals more linearly.
Orientation-selective responses depend on stimulus structure
The elongation of the dendritic arbor and the quasi-linear summation of contrast just described underlie the orientation selectivity of PA1/3 cells. It is obvious that PA1/3 cells will be insensitive to the orientation of objects that are large relative to their dendritic extent (low spatial frequency limit). Similarly, high spatial frequency stimuli that are much finer than the dimensions of the receptive field center will produce similar activation regardless of the orientation; however, the quasi-linear summation of contrast will reduce the overall responsiveness, resulting in a low-pass characteristic as a function of spatial frequency. The low-pass corner frequency will differ as a function of orientation due to the elongation of the receptive field, and therefore OS responses will be strongest over an intermediate range of frequencies, and thus are expected to display a bandpass characteristic as a function of spatial frequency.
To determine the range of spatial frequencies that produce OS responses, we tested the spatial frequency tuning along the major and minor axes of PA1/3 cells. Spiking responses to sine-wave contrast-reversing gratings, with antinodes centered over the soma (phase, 90°), were recorded from PA1/3 cells for spatial frequencies ranging from 0.33 to 5 cycles/mm. PSTHs at four spatial frequencies are shown in Figure 9E. As expected, the spike rate was insensitive to orientation for the lowest and highest spatial frequencies. However, the responses were OS over intermediate frequencies, where spike rates were larger and less frequency doubled for preferred versus null oriented gratings. We estimated the range of spatial frequencies that produced OS responses by comparing the relative strength of frequency-doubled responses. For both preferred and null oriented gratings, we calculated the integral of the PSTH over the second half of the contrast-reversing cycle as a fraction of the integral over the whole cycle. An integral ratio of 0.5 indicates a fully frequency-doubled response, whereas a value of 1 indicates responses in phase with the fundamental stimulus frequency. As expected, the transition from fundamental to frequency-doubled responses occurred at lower spatial frequencies for null oriented gratings (Fig. 9F). The difference between the preferred and null tuning curves indicates a bandpass characteristic for orientation selectivity, with an optimal frequency of about 1.37 mm−1. This corresponds to a bar width of ∼365 μm, which is close to the typical width along the minor axis of the dendritic arbor.
Discussion
The results demonstrate that orientation-selective responses in PA1/3 cells arise from the elongation of the dendritic arbor, the arrangement of the excitatory inputs, and a quasi-linear summation of contrast in the RF center. We found that both local and wide-field serial feedback inhibition regulate the kinetics, gain, and spatial extent of the excitatory inputs. Direct inhibitory inputs from the OFF pathway contributed to the suppression of responses to high spatial frequencies, which optimized the generation of OS signals. The data demonstrate how synaptic inputs from the ON and OFF visual pathways can combine to tune neural responses to specific information in the visual input.
Anatomical comparison with other studies
PACs represent a well-conserved amacrine cell type that have been identified in primate, mouse, salamander, and rabbit retinas (Dacey, 1989; Famiglietti, 1992a,b,c; Stafford and Dacey, 1997; Völgyi et al., 2001; Olveczky et al., 2003, 2007; Lin and Masland, 2006). In the rabbit retina, Famiglietti (1993a,b,c) morphologically identified four different types of PACs (PA1–PA4), which differed in dendritic and axonal arbor size, branching, orientation, stratification depth, and soma position. Subsequently, Völgyi et al. (2001) surveyed the morphology and provided the first recordings of six different types of PACs (types I–VI). PA1/3 cells show the closest resemblance to the Famiglietti (1993c) PA3 and the Völgyi et al. (2001) type V cells, although each has features not found in PA1/3 cells. The main differences lie in the stratification of PA1/3 dendrites in S3 (not found in type V cells), the narrow axonal stratification to the S3/4 border (PA3 cell axons stratify to multiple layers of the IPL), and the lack of spiking in response to negative contrast (exhibited by type V cells). Thus, PA3 cells show the closest resemblance to PA1/3 cells; however, the differences in axonal stratification suggest that PA1/3 cells likely represent a novel population.
Functional roles for PA1/3 cells
Previous studies have shown that OS signals in ganglion cells are generated by the activity of presynaptic GABAergic amacrine cells (Venkataramani and Taylor, 2010). OS amacrine cells have been reported in the mammalian retina (Bloomfield, 1994), but here we describe the first example of an OS polyaxonal amacrine cell, which could be the source of the inhibition that drives OS responses in some ON-type ganglion cells (Levick, 1967). We show that orientation selectivity relies on two key properties of PA1/3 cells. First is the morphology of the dendritic arbors, which are elongated parallel to the preferred orientation. Second is the quasi-linear summation of the synaptic inputs, which depends on the tonic excitatory drive from the ON pathway as well as inhibitory signals that cross over from the OFF pathway (Molnar et al., 2009; Werblin, 2010). The quasi-linear summation of contrast suppresses responses to high spatial frequencies, thereby preventing randomly oriented fine textures in the visual environment from inappropriately driving PA1/3 cells.
An alternative functional role for PA1/3 cells is suggested by the area-response measurements, which demonstrate that these cells have relatively weak surround receptive fields (Fig. 2B). Consequently, they respond strongly to low spatial frequencies (Fig. 9), where the responses are independent of orientation. Together, these receptive field properties would allow PA1/3 cells to contribute to surround suppression in ganglion cells that have concentric center-surround receptive fields. This idea is in line with studies showing that surround suppression depends on spiking activity in WFACs (Cook and McReynolds, 1998; Taylor, 1999; Flores-Herr et al., 2001).
Previous analyses have concluded that PACs are involved in suppressing responses to global background motion in so-called objection motion sensitive (OMS) ganglion cells, namely, the ON brisk transient and ON–OFF direction-selective ganglion cells in the rabbit and the fast OFF ganglion cells in the salamander (Olveczky et al., 2003, 2007; Baccus et al., 2008). To subserve this function, PACs should have sparse and transient signaling, nonlinear input summation, and large receptive fields that are likely electrically coupled to other PACs, and receive little surround inhibition. PA1/3 cells fulfill several of these requirements, except that they summate inputs quasi-linearly, and thus respond weakly to the high spatial frequency stimuli that have been shown to trigger OMS inhibition in the rabbit (Fig. 9E; Olveczky et al., 2003). Overall, it seems unlikely that generating OMS signals is the primary role of these cells.
Our discussion of the possible functional roles for PA1/3 cells is based on data obtained under photopic background illumination. Previous work showed that background illumination is a strong determinant of neural response properties in the retina (Tikidji-Hamburyan et al., 2015). For instance, the strength of surround inhibition (Hoggarth et al., 2015) and the linearity of a cell's response to contrast (Grimes et al., 2014) can vary dramatically depending on whether the light levels are in the scotopic or photopic range. Since morphological features largely determine OS sensitivity in PA1/3 cells, it seems likely that this receptive field property would be robust against changes in background illumination; however, we cannot rule out the possibility that the characteristics of contrast summation in the RF center may change.
Inhibitory circuits in the ON and OFF pathways
The results show that inhibitory inputs to PA1/3 cells arise from the ON and OFF pathways and consist of glycinergic and GABAergic components. The ON and OFF glycinergic inputs are restricted to the receptive field center and receive GABAC receptor-mediated surround inhibition (Figs. 7, 8). GABAC receptors are found primarily on bipolar cell axon terminals, and are rarely observed on postsynaptic dendrites (Wässle et al., 1998). Therefore, it is likely that the GABAC-mediated surround inhibition of the ON and OFF glycinergic inputs is formed via feedback onto presynaptic bipolar cell terminals, rather than by serial inhibitory connections.
We propose that the OFF inhibition contributes to a quasi-linear summation of contrast within the RF center such that negative contrast activates inhibition that reduces the cell's excitability and cancels excitatory input activated by positive contrast. For such a mechanism to work effectively at the highest spatial frequencies, the excitatory bipolar cells and inhibitory amacrine cells should have approximately equal spatial resolution. In this context, a possible role for the inhibitory surround observed for the OFF glycinergic amacrine cells is to adjust their spatial tuning to higher frequencies to better match the spatial frequency tuning of the excitatory bipolar cell inputs.
Mechanisms of GABAergic feedback inhibition
The opposing effects of GABAA and GABAC receptor antagonists on the excitatory conductance provided strong evidence for serial inhibition, which is commonly observed in the retina (Dowling and Boycott, 1966, 1968; Chun and Wässle, 1989; Pourcho and Owczarzak, 1989; Koontz and Hendrickson, 1990; Zhang et al., 1997; Marc and Liu, 2000; Eggers and Lukasiewicz, 2010, 2011; Chen et al., 2011). Blocking GABAA receptors reduced the duration of the excitatory inputs, whereas blocking both GABAA and GABAC receptors increased the amplitude of the excitatory inputs and tended to extend their duration. We propose that these effects occur through serial inhibitory connections, such that disinhibition of a second amacrine cell enhances GABAergic feedback onto bipolar cell terminals (Fig. 5F). Under GABAergic blockade, changes in the amplitude and duration of the excitatory inputs were reflected in altered spike rates, demonstrating considerable scope for serial GABAergic feedback to modulate physiological function. Since bipolar cell signals diverge onto multiple types of postsynaptic cells (Asari and Meister, 2014), the effects of feedback inhibition identified here likely influence the functional properties of many other amacrine and ganglion cells.
The effects of TTX revealed an additional spatial dimension to the control of excitatory inputs to PA1/3 cells. Blocking action potentials enhanced the excitatory conductance only for large stimuli (≥600 μm), whereas blocking GABAergic transmission enhanced excitatory inputs for stimuli similar in size to single bipolar cells (Fig. 6). These results indicate that feedback inhibition onto cone bipolar cells presynaptic to PA1/3 cells is active on two spatial scales. Short-range inhibition is contributed by local microcircuits that use graded potentials, and long-range inhibition is driven by spiking WFACs in the surround. These characteristics are reminiscent of GABAergic inhibition onto rod bipolar cell terminals, which receive reciprocal feedback via graded potentials in A17 amacrine cells (Hartveit, 1999; Chávez et al., 2006; Grimes et al., 2010), as well as longer-range lateral feedback inhibition from amacrine cells in the surround (Chávez et al., 2010). Having both local and wide-field inhibition regulate glutamate release from bipolar cells may allow for dynamic regulation of the gain and kinetics of bipolar cell output over a wide range of spatial scales.
Footnotes
This work was supported by NIH Grants R01 EY014888, T32 EY023211, P30 EY010572, and P30 NS061800; and by unrestricted departmental funding from Research to Prevent Blindness (New York, NY).
References
- Ames A, III, Nesbett FB. In vitro retina as an experimental model of the central nervous system. J Neurochem. 1981;37:867–877. doi: 10.1111/j.1471-4159.1981.tb04473.x. [DOI] [PubMed] [Google Scholar]
- Ariel M, Daw NW. Pharmacological analysis of directionally sensitive rabbit retinal ganglion cells. J Physiol. 1982;324:161–185. doi: 10.1113/jphysiol.1982.sp014105. [DOI] [PMC free article] [PubMed] [Google Scholar]
- Asari H, Meister M. The projective field of retinal bipolar cells and its modulation by visual context. Neuron. 2014;81:641–652. doi: 10.1016/j.neuron.2013.11.029. [DOI] [PubMed] [Google Scholar]
- Babai N, Thoreson WB. Horizontal cell feedback regulates calcium currents and intracellular calcium levels in rod photoreceptors of salamander and mouse retina. J Physiol. 2009;587:2353–2364. doi: 10.1113/jphysiol.2009.169656. [DOI] [PMC free article] [PubMed] [Google Scholar]
- Baccus SA, Olveczky BP, Manu M, Meister M. A retinal circuit that computes object motion. J Neurosci. 2008;28:6807–6817. doi: 10.1523/JNEUROSCI.4206-07.2008. [DOI] [PMC free article] [PubMed] [Google Scholar]
- Berntson A, Taylor WR. Response characteristics and receptive field widths of on-bipolar cells in the mouse retina. J Physiol. 2000;524:879–889. doi: 10.1111/j.1469-7793.2000.00879.x. [DOI] [PMC free article] [PubMed] [Google Scholar]
- Bieda MC, Copenhagen DR. Sodium action potentials are not required for light-evoked release of GABA or glycine from retinal amacrine cells. J Neurophysiol. 1999;81:3092–3095. doi: 10.1152/jn.1999.81.6.3092. [DOI] [PubMed] [Google Scholar]
- Bloomfield SA. Orientation-sensitive amacrine and ganglion cells in the rabbit retina. J Neurophysiol. 1994;71:1672–1691. doi: 10.1152/jn.1994.71.5.1672. [DOI] [PubMed] [Google Scholar]
- Bloomfield SA, Völgyi B. The diverse functional roles and regulation of neuronal gap junctions in the retina. Nat Rev Neurosci. 2009;10:495–506. doi: 10.1038/nrn2636. [DOI] [PMC free article] [PubMed] [Google Scholar]
- Buldyrev I, Taylor WR. Inhibitory mechanisms that generate centre and surround properties in ON and OFF brisk-sustained ganglion cells in the rabbit retina. J Physiol. 2013;591:303–325. doi: 10.1113/jphysiol.2012.243113. [DOI] [PMC free article] [PubMed] [Google Scholar]
- Caldwell JH, Daw NW, Wyatt HJ. Effects of picrotoxin and strychnine on rabbit retinal ganglion cells: lateral interactions for cells with more complex receptive fields. J Physiol. 1978;276:277–298. doi: 10.1113/jphysiol.1978.sp012233. [DOI] [PMC free article] [PubMed] [Google Scholar]
- Chávez AE, Singer JH, Diamond JS. Fast neurotransmitter release triggered by Ca influx through AMPA-type glutamate receptors. Nature. 2006;443:705–708. doi: 10.1038/nature05123. [DOI] [PubMed] [Google Scholar]
- Chávez AE, Grimes WN, Diamond JS. Mechanisms underlying lateral GABAergic feedback onto rod bipolar cells in rat retina. J Neurosci. 2010;30:2330–2339. doi: 10.1523/JNEUROSCI.5574-09.2010. [DOI] [PMC free article] [PubMed] [Google Scholar]
- Chen X, Hsueh HA, Werblin FS. Amacrine-to-amacrine cell inhibition: Spatiotemporal properties of GABA and glycine pathways. Vis Neurosci. 2011;28:193–204. doi: 10.1017/S0952523811000137. [DOI] [PubMed] [Google Scholar]
- Chun MH, Wässle H. GABA-like Immunoreactivity in the Cat Retina: Electron Microscopy. J Comp Neurol. 1989;279:55–67. doi: 10.1002/cne.902790106. [DOI] [PubMed] [Google Scholar]
- Cook PB, McReynolds JS. Lateral inhibition in the inner retina is important for spatial tuning of ganglion cells. Nat Neurosci. 1998;1:714–719. doi: 10.1038/3714. [DOI] [PubMed] [Google Scholar]
- Dacey DM. Axon-bearing amacrine cells of the macaque monkey retina. J Comp Neurol. 1989;284:275–293. doi: 10.1002/cne.902840210. [DOI] [PubMed] [Google Scholar]
- Dacey D, Packer OS, Diller L, Brainard D, Peterson B, Lee B. Center surround receptive field structure of cone bipolar cells in primate retina. Vision Res. 2000;40:1801–1811. doi: 10.1016/S0042-6989(00)00039-0. [DOI] [PubMed] [Google Scholar]
- Davenport CM, Detwiler PB, Dacey DM. Effects of pH buffering on horizontal and ganglion cell light responses in primate retina: evidence for the proton hypothesis of surround formation. J Neurosci. 2008;28:456–464. doi: 10.1523/JNEUROSCI.2735-07.2008. [DOI] [PMC free article] [PubMed] [Google Scholar]
- Demb JB, Zaghloul K, Haarsma L, Sterling P. Bipolar cells contribute to nonlinear spatial summation in the brisk-transient (Y) ganglion cell in mammalian retina. J Neurosci. 2001;21:7447–7454. doi: 10.1523/JNEUROSCI.21-19-07447.2001. [DOI] [PMC free article] [PubMed] [Google Scholar]
- DeVries SH, Qi X, Smith R, Makous W, Sterling P. Electrical coupling between mammalian cones. Curr Biol. 2002;12:1900–1907. doi: 10.1016/S0960-9822(02)01261-7. [DOI] [PubMed] [Google Scholar]
- Dong CJ, Werblin FS. Temporal contrast enhancement via GABAC feedback at bipolar terminals in the tiger salamander retina. J Neurophysiol. 1998;79:2171–2180. doi: 10.1152/jn.1998.79.4.2171. [DOI] [PubMed] [Google Scholar]
- Dowling JE. Synaptic organization of the frog retina: an electron microscopic analysis comparing the retinas of frogs and primates. Proc R Soc Lond B Biol Sci. 1968;170:205–228. doi: 10.1098/rspb.1968.0034. [DOI] [PubMed] [Google Scholar]
- Dowling JE, Boycott BB. Organization of the primate retina: electron microscopy. Proc R Soc Lond B Biol Sci. 1966;166:80–111. doi: 10.1098/rspb.1966.0086. [DOI] [PubMed] [Google Scholar]
- Eggers ED, Lukasiewicz PD. Receptor and transmitter release properties set the time course of retinal inhibition. J Neurosci. 2006;26:9413–9425. doi: 10.1523/JNEUROSCI.2591-06.2006. [DOI] [PMC free article] [PubMed] [Google Scholar]
- Eggers ED, Lukasiewicz PD. Interneuron circuits tune inhibition in retinal bipolar cells. J Neurophysiol. 2010;103:25–37. doi: 10.1152/jn.00458.2009. [DOI] [PMC free article] [PubMed] [Google Scholar]
- Eggers ED, Lukasiewicz PD. Multiple pathways of inhibition shape bipolar cell responses in the retina. Vis Neurosci. 2011;28:95–108. doi: 10.1017/S0952523810000209. [DOI] [PMC free article] [PubMed] [Google Scholar]
- Eggers ED, McCall MA, Lukasiewicz PD. Presynaptic inhibition differentially shapes transmission in distinct circuits in the mouse retina. J Physiol. 2007;582:569–582. doi: 10.1113/jphysiol.2007.131763. [DOI] [PMC free article] [PubMed] [Google Scholar]
- Enroth-Cugell C, Robson JG. The contrast sensitivity of retinal ganglion cells of the cat. J Physiol. 1966;187:517–552. doi: 10.1113/jphysiol.1966.sp008107. [DOI] [PMC free article] [PubMed] [Google Scholar]
- Euler T, Wässle H. Different contributions of GABAA and GABAC receptors to rod and cone bipolar cells in a rat retinal slice preparation. J Neurophysiol. 1998;79:1384–1395. doi: 10.1152/jn.1998.79.3.1384. [DOI] [PubMed] [Google Scholar]
- Famiglietti EV. Functional architecture of cone bipolar cells in mammalian retina. Vision Res. 1981;21:1559–1563. doi: 10.1016/0042-6989(81)90032-8. [DOI] [PubMed] [Google Scholar]
- Famiglietti EV. Polyaxonal amacrine cells of rabbit retina: morphology and stratification of PA1 cells. J Comp Neurol. 1992a;316:391–405. doi: 10.1002/cne.903160402. [DOI] [PubMed] [Google Scholar]
- Famiglietti EV. Polyaxonal amacrine cells of rabbit retina: size and distribution of PA1 cells. J Comp Neurol. 1992b;316:406–421. doi: 10.1002/cne.903160403. [DOI] [PubMed] [Google Scholar]
- Famiglietti EV. Polyaxonal amacrine cells of rabbit retina: PA2, PA3, and PA4 cells. Light and electron microscopic studies with a functional interpretation. J Comp Neurol. 1992c;316:422–446. doi: 10.1002/cne.903160404. [DOI] [PubMed] [Google Scholar]
- Feigenspan A, Wässle H, Bormann J. Pharmacology of GABA receptor Cl− channels in rat retinal bipolar cells. Nature. 1993;361:159–162. doi: 10.1038/361159a0. [DOI] [PubMed] [Google Scholar]
- Flores-Herr N, Protti DA, Wässle H. Synaptic currents generating the inhibitory surround of ganglion cells in the mammalian retina. J Neurosci. 2001;21:4852–4863. doi: 10.1523/JNEUROSCI.21-13-04852.2001. [DOI] [PMC free article] [PubMed] [Google Scholar]
- Greschner M, Field GD, Li PH, Schiff ML, Gauthier JL, Ahn D, Sher A, Litke AM, Chichilnisky EJ. A polyaxonal amacrine cell population in the primate retina. J Neurosci. 2014;34:3597–3606. doi: 10.1523/JNEUROSCI.3359-13.2014. [DOI] [PMC free article] [PubMed] [Google Scholar]
- Grimes WN, Zhang J, Graydon CW, Kachar B, Diamond JS. Retinal parallel processors: more than 100 independent microcircuits operate within a single interneuron. Neuron. 2010;65:873–885. doi: 10.1016/j.neuron.2010.02.028. [DOI] [PMC free article] [PubMed] [Google Scholar]
- Grimes WN, Schwartz GW, Rieke F. The synaptic and circuit mechanisms underlying a change in spatial encoding in the retina. Neuron. 2014;82:460–473. doi: 10.1016/j.neuron.2014.02.037. [DOI] [PMC free article] [PubMed] [Google Scholar]
- Hartveit E. Reciprocal synaptic interactions between rod bipolar cells and amacrine cells in the rat retina. J Neurophysiol. 1999;81:2923–2936. doi: 10.1152/jn.1999.81.6.2923. [DOI] [PubMed] [Google Scholar]
- Hochstein S, Shapley RM. The linear and nonlinear spatial subunits in Y cat retinal ganglion cells. J Physiol. 1976;262:265–284. doi: 10.1113/jphysiol.1976.sp011595. [DOI] [PMC free article] [PubMed] [Google Scholar]
- Hoggarth A, McLaughlin AJ, Ronellenfitch K, Trenholm S, Vasandani R, Sethuramanujam S, Schwab D, Briggman KL, Awatramani GB. Specific wiring of distinct amacrine cells in the directionally selective retinal circuit permits independent coding of direction and size. Neuron. 2015;86:1–16. doi: 10.1016/j.neuron.2015.03.053. [DOI] [PubMed] [Google Scholar]
- Ichinose T, Lukasiewicz PD. Inner and outer retinal pathways both contribute to surround inhibition of salamander ganglion cells. J Physiol. 2005;565:517–535. doi: 10.1113/jphysiol.2005.083436. [DOI] [PMC free article] [PubMed] [Google Scholar]
- Isaacson JS, Scanziani M. How inhibition shapes cortical activity. Neuron. 2011;72:231–243. doi: 10.1016/j.neuron.2011.09.027. [DOI] [PMC free article] [PubMed] [Google Scholar]
- Kamermans M, Fahrenfort I, Schultz K, Janssen-Bienhold U, Sjoerdsma T, Weiler R. Hemichannel-mediated inhibition in the outer retina. Science. 2001;292:1178–1180. doi: 10.1126/science.1060101. [DOI] [PubMed] [Google Scholar]
- Kittila CA, Massey SC. Pharmacology of directionally selective ganglion cells in the rabbit retina. J Neurophysiol. 1997;77:675–689. doi: 10.1152/jn.1997.77.2.675. [DOI] [PubMed] [Google Scholar]
- Koontz MA, Hendrickson AE. Distribution of GABA-immunoreactive amacrine cell synapses in the inner plexiform layer of macaque monkey retina. Vis Neurosci. 1990;5:17–28. doi: 10.1017/S0952523800000043. [DOI] [PubMed] [Google Scholar]
- Lamb TD, Simon EJ. The relation between intercellular coupling and electrical noise in turtle photoreceptors. J Physiol. 1976;263:257–286. doi: 10.1113/jphysiol.1976.sp011631. [DOI] [PMC free article] [PubMed] [Google Scholar]
- Levick WR. Receptive fields and trigger features of ganglion cells in the visual streak of the rabbit's retina. J Physiol. 1967;188:285–307. doi: 10.1113/jphysiol.1967.sp008140. [DOI] [PMC free article] [PubMed] [Google Scholar]
- Lin B, Masland RH. Populations of wide-field amacrine cells in the mouse retina. J Comp Neurol. 2006;499:797–809. doi: 10.1002/cne.21126. [DOI] [PubMed] [Google Scholar]
- Liu ZQ. Scale space approach to directional analysis of images. Appl Opt. 1991;30:1369–1373. doi: 10.1364/AO.30.001369. [DOI] [PubMed] [Google Scholar]
- Lukasiewicz PD, Shields CR. Different combinations of GABAA and GABAC receptors confer distinct temporal properties to retinal synaptic responses. J Neurophysiol. 1998;79:3157–3167. doi: 10.1152/jn.1998.79.6.3157. [DOI] [PubMed] [Google Scholar]
- Lukasiewicz PD, Werblin FS. A novel GABA receptor modulates synaptic transmission from bipolar to ganglion and amacrine cells in the tiger salamander retina. J Neurosci. 1994;14:1213–1223. doi: 10.1523/JNEUROSCI.14-03-01213.1994. [DOI] [PMC free article] [PubMed] [Google Scholar]
- Lukasiewicz PD, Wong RO. GABAC receptors on ferret retinal bipolar cells: a diversity of subtypes in mammals? Vis Neurosci. 1997;14:989–994. doi: 10.1017/S095252380001169X. [DOI] [PubMed] [Google Scholar]
- MacNeil MA, Masland RH. Extreme diversity among amacrine cells: implications for function. Neuron. 1998;20:971–982. doi: 10.1016/S0896-6273(00)80478-X. [DOI] [PubMed] [Google Scholar]
- MacNeil MA, Heussy JK, Dacheux RF, Raviola E, Masland RH. The shapes and numbers of amacrine cells: matching of photofilled with Golgi-stained cells in the rabbit retina and comparison with other mammalian species. J Comp Neurol. 1999;413:305–326. doi: 10.1002/(SICI)1096-9861(19991018)413:2. 3.0.CO;2-E. [DOI] [PubMed] [Google Scholar]
- MacNeil MA, Heussy JK, Dacheux RF, Raviola E, Masland RH. The population of bipolar cells in the rabbit retina. J Comp Neurol. 2004;472:73–86. doi: 10.1002/cne.20063. [DOI] [PubMed] [Google Scholar]
- Mangel SC. Analysis of the horizontal cell contribution to the receptive field surround of ganglion cells in the rabbit retina. J Physiol. 1991;442:211–234. doi: 10.1113/jphysiol.1991.sp018790. [DOI] [PMC free article] [PubMed] [Google Scholar]
- Marc RE, Liu W. Fundamental GABAergic amacrine cell circuitries in the retina: nested feedback, concatenated inhibition, and axosomatic synapses. J Comp Neurol. 2000;425:560–582. doi: 10.1002/1096-9861(20001002)425:4. 3.0.CO;2-D. [DOI] [PubMed] [Google Scholar]
- McMahon MJ, Packer OS, Dacey DM. The classical receptive field surround of primate parasol ganglion cells is mediated primarily by a non-GABAergic pathway. J Neurosci. 2004;24:3736–3745. doi: 10.1523/JNEUROSCI.5252-03.2004. [DOI] [PMC free article] [PubMed] [Google Scholar]
- Menger N, Pow DV, Wässle H. Glycinergic amacrine cells of the rat retina. J Comp Neurol. 1998;401:34–46. doi: 10.1002/(SICI)1096-9861(19981109)401:13.0.CO%3B2-P. [DOI] [PubMed] [Google Scholar]
- Mills SL, Massey SC. Morphology of bipolar cells labelled by DAPI in the rabbit retina. J Comp Neurol. 1992;321:133–149. doi: 10.1002/cne.903210112. [DOI] [PubMed] [Google Scholar]
- Molnar A, Hsueh HA, Roska B, Werblin FS. Crossover inhibition in the retina: circuitry that compensates for nonlinear rectifying synaptic transmission. J Comput Neurosci. 2009;27:569–590. doi: 10.1007/s10827-009-0170-6. [DOI] [PMC free article] [PubMed] [Google Scholar]
- Myatt DR, Hadlington T, Ascoli GA, Nasuto SJ. Neuromantic–from semi-manual to semi-automatic reconstruction of neuron morphology. Front Neuroinform. 2012;6:1–14. doi: 10.3389/fninf.2012.00004. [DOI] [PMC free article] [PubMed] [Google Scholar]
- Olveczky BP, Baccus SA, Meister M. Segregation of object and background motion in the retina. Nature. 2003;423:401–408. doi: 10.1038/nature01652. [DOI] [PubMed] [Google Scholar]
- Olveczky BP, Baccus SA, Meister M. Retinal adaptation to object motion. Neuron. 2007;56:689–700. doi: 10.1016/j.neuron.2007.09.030. [DOI] [PMC free article] [PubMed] [Google Scholar]
- Pourcho RG, Goebel DJ. Neuronal subpopulations in cat retina which accumulate the GABA agonist, (3H)muscimol: a combined Golgi and autoradiographic study. J Comp Neurol. 1983;219:25–35. doi: 10.1002/cne.902190104. [DOI] [PubMed] [Google Scholar]
- Pourcho RG, Goebel DJ. A combined Golgi and autoradiographic study of (3H)glycine-accumulating amacrine cells in the cat retina. J Comp Neurol. 1985;233:473–480. doi: 10.1002/cne.902330406. [DOI] [PubMed] [Google Scholar]
- Pourcho RG, Owczarzak MT. Distribution of GABA immunoreactivity in the cat retina: A light- and electron-microscopic study. Vis Neurosci. 1989;2:425–435. doi: 10.1017/S0952523800012323. [DOI] [PubMed] [Google Scholar]
- Raviola E, Gilula NB. Gap junctions between photoreceptor cells in the vertebrate retina. Proc Natl Acad Sci U S A. 1973;70:1677–1681. doi: 10.1073/pnas.70.6.1677. [DOI] [PMC free article] [PubMed] [Google Scholar]
- Russell TL, Werblin FS. Retinal synaptic pathways underlying the response of the rabbit local edge detector. J Neurophysiol. 2010;103:2757–2569. doi: 10.1152/jn.00987.2009. [DOI] [PMC free article] [PubMed] [Google Scholar]
- Schindelin J, Arganda-Carreras I, Frise E, Kaynig V, Longair M, Pietzsch T, Preibisch S, Rueden C, Saalfeld S, Schmid B, Tinevez JY, White DJ, Hartenstein V, Eliceiri K, Tomancak P, Cardona A. Fiji: an open-source platform for biological-image analysis. Nat Methods. 2012;9:676–682. doi: 10.1038/nmeth.2019. [DOI] [PMC free article] [PubMed] [Google Scholar]
- Schwartz GW, Okawa H, Dunn FA, Morgan JL, Kerschensteiner D, Wong RO, Rieke F. The spatial structure of a nonlinear receptive field. Nat Neurosci. 2012;15:1572–1580. doi: 10.1038/nn.3225. [DOI] [PMC free article] [PubMed] [Google Scholar]
- Shields CR, Lukasiewicz PD. Spike-dependent GABA inputs to bipolar cell axon terminals contribute to lateral inhibition of retinal ganglion cells. J Neurophysiol. 2003;89:2449–2458. doi: 10.1152/jn.00916.2002. [DOI] [PubMed] [Google Scholar]
- Shields CR, Tran MN, Wong RO, Lukasiewicz PD. Distinct ionotropic GABA receptors mediate presynaptic and postsynaptic inhibition in retinal bipolar cells. J Neurosci. 2000;20:2673–2682. doi: 10.1523/JNEUROSCI.20-07-02673.2000. [DOI] [PMC free article] [PubMed] [Google Scholar]
- Slaughter MM, Miller RF. 2-amino-4-phosphonobutyric acid: a new pharmacological tool for retina research. Science. 1981;211:182–185. doi: 10.1126/science.6255566. [DOI] [PubMed] [Google Scholar]
- Smith RG, Vardi N. Simulation of the AII amacrine cell of mammalian retina: Functional consequences of electrical coupling and regenerative membrane properties. Vis Neurosci. 1995;12:851–860. doi: 10.1017/S095252380000941X. [DOI] [PubMed] [Google Scholar]
- Stafford DK, Dacey DM. Physiology of the A1 amacrine: A spiking, axon-bearing interneuron of the macaque monkey retina. Vis Neurosci. 1997;14:507–522. doi: 10.1017/S0952523800012165. [DOI] [PubMed] [Google Scholar]
- Taylor WR. TTX attenuates surround inhibition in rabbit retinal ganglion cells. Vis Neurosci. 1999;16:285–290. doi: 10.1017/s0952523899162096. [DOI] [PubMed] [Google Scholar]
- Taylor WR, Vaney DI. Diverse synaptic mechanisms generate direction selectivity in the rabbit retina. J Neurosci. 2002;22:7712–7720. doi: 10.1523/JNEUROSCI.22-17-07712.2002. [DOI] [PMC free article] [PubMed] [Google Scholar]
- Tikidji-Hamburyan A, Reinhard K, Seitter H, Hovhannisyan A, Procyk CA, Allen AE, Schenk M, Lucas RJ, Münch TA. Retinal output changes qualitatively with every change in ambient illuminance. Nat Neurosci. 2015;18:66–74. doi: 10.1038/nn.3891. [DOI] [PMC free article] [PubMed] [Google Scholar]
- Tinevez JY. Directionality Fiji Image J. 2010. http://fiji.sc/wiki/index.php/Directionality.
- Troy JB, Einstein G, Schuurmans RP, Robson JG, Enroth-Cugell C. Responses to sinusoidal gratings of two types of very nonlinear retinal ganglion cells of cat. Vis Neurosci. 1989;3:213–223. doi: 10.1017/S0952523800009974. [DOI] [PubMed] [Google Scholar]
- Vardi N, Smith RG. The AII amacrine network: coupling can increase correlated activity. Vision Res. 1996;36:3743–3757. doi: 10.1016/0042-6989(96)00098-3. [DOI] [PubMed] [Google Scholar]
- Venkataramani S, Taylor WR. Orientation selectivity in rabbit retinal ganglion cells is mediated by presynaptic inhibition. J Neurosci. 2010;30:15664–15676. doi: 10.1523/JNEUROSCI.2081-10.2010. [DOI] [PMC free article] [PubMed] [Google Scholar]
- Venkataramani S, Van Wyk M, Buldyrev I, Sivyer B, Vaney DI, Taylor WR. Distinct roles for inhibition in spatial and temporal tuning of local Edge detectors in the rabbit retina. PLoS One. 2014;9:e88560. doi: 10.1371/journal.pone.0088560. [DOI] [PMC free article] [PubMed] [Google Scholar]
- Vigh J, von Gersdorff H. Prolonged reciprocal signaling via NMDA and GABA receptors at a retinal ribbon synapse. J Neurosci. 2005;25:11412–11423. doi: 10.1523/JNEUROSCI.2203-05.2005. [DOI] [PMC free article] [PubMed] [Google Scholar]
- Vigh J, Vickers E, von Gersdorff H. Light-evoked lateral GABAergic inhibition at single bipolar cell synaptic terminals is driven by distinct retinal microcircuits. J Neurosci. 2011;31:15884–15893. doi: 10.1523/JNEUROSCI.2959-11.2011. [DOI] [PMC free article] [PubMed] [Google Scholar]
- Völgyi B, Xin D, Amarillo Y, Bloomfield SA. Morphology and physiology of the polyaxonal amacrine cells in the rabbit retina. J Comp Neurol. 2001;125:109–125. doi: 10.1002/cne.1373. [DOI] [PubMed] [Google Scholar]
- Völgyi B, Xin D, Bloomfield SA. Feedback inhibition in the inner plexiform layer underlies the surround-mediated responses of AII amacrine cells in the mammalian retina. J Physiol. 2002;539:603–614. doi: 10.1113/jphysiol.2001.013133. [DOI] [PMC free article] [PubMed] [Google Scholar]
- Wässle H, Koulen P, Brandstätter JH, Fletcher EL, Becker CM. Glycine and GABA receptors in the mammalian retina. Vision Res. 1998;38:1411–1430. doi: 10.1016/S0042-6989(97)00300-3. [DOI] [PubMed] [Google Scholar]
- Werblin FS. Six different roles for crossover inhibition in the retina: correcting the nonlinearities of synaptic transmission. Vis Neurosci. 2010;27:1–8. doi: 10.1017/S0952523810000076. [DOI] [PMC free article] [PubMed] [Google Scholar]
- Wright LL, Vaney DI. The type 1 polyaxonal amacrine cells of the rabbit retina: a tracer coupling study. Vis Neurosci. 2004;21:145–155. doi: 10.1017/s0952523804042063. [DOI] [PubMed] [Google Scholar]
- Zhang J, Slaughter MM. Preferential suppression of the ON pathway by GABAC receptors in the amphibian retina. J Neurophysiol. 1995;74:1583–1592. doi: 10.1152/jn.1995.74.4.1583. [DOI] [PubMed] [Google Scholar]
- Zhang J, Jung CS, Slaughter MM. Serial inhibitory synapses in retina. Vis Neurosci. 1997;14:553–563. doi: 10.1017/S0952523800012219. [DOI] [PubMed] [Google Scholar]