

Abstract
Pancreatic ductal adenocarcinoma (PDAC) is the fourth-leading cause of cancer death in the United States. The TGF-β signaling protein SMAD family member 4 is lost in 60% of PDAC, and this has been associated with poorer prognosis. However, the mechanisms by which SMAD4 loss promotes PDAC development are not fully understood. We expressed SMAD4 in human PDAC cell lines BxPC3 and CFPAC1 by selection of stable clones containing an inducible SMAD4 tetracycline inducible expression system construct. After 24 hours of SMAD4 expression, TGF-β signaling-dependent G1 arrest was observed in BxPC3 cells with an increase in the G1 phase fraction from 48.9% to 71.5%. Inhibition of cyclin-dependent kinase inhibitor 1A by small interfering RNA eliminated the antiproliferative effect, indicating that up-regulation of cyclin-dependent kinase inhibitor 1A/p21 by TGF-β signaling is necessary for the phenotype. SMAD4 expression had no impact on invasion in BxPC3 cells, but reduced migration. Microarray analysis of gene expression at 8, 24, and 48 hours after SMAD4 expression characterized the regulatory impact of SMAD4 expression in a SMAD4-null PDAC cell line and identified novel targets of TGF-β signaling. Among the novel TGF-β targets identified are anthrax toxin receptor 2 (3.58× at 8 h), tubulin, β-3 class III (7.35× at 8 h), cell migration inducing protein, hyaluronan binding (8.07× at 8 h), IL-1 receptor-like 1 (0.403× at 8 h), regulator of G protein signaling 4 (0.293× at 8 h), and THAP domain containing 11 (0.262× at 8 h). The gene expression changes we observed upon restoration of TGF-β signaling provide numerous new targets for future investigations into PDAC biology and progression.
Pancreatic ductal adenocarcinoma (PDAC) is the twelfth most common cancer in the US, but is the fourth leading cause of cancer death with approximately 37 000 deaths each year (1). For patients who present with advanced stage disease, the 5-year survival rate is less than 2% (2). SMAD family member 4 (SMAD4) is lost in around 60% of PDAC and loss correlates with higher metastatic burden (3), suggesting that SMAD4 loss is an important event in PDAC development.
SMAD4 is a critical member of the TGF-β signaling pathway. TGF-β is a growth factor that regulates many developmental programs and promotes homeostasis in mature tissues. Activation of the signaling pathway begins when TGF-β dimers interact with the heterodimeric transforming growth factor receptor (TGFBR2) 2/R1 receptor complex, which phosphorylates SMAD2 and SMAD3. Phosphorylated SMAD2 and SMAD3 can then bind to SMAD4 to form a complex that accumulates in the nucleus where it associates with various cofactors, binds DNA, and regulates gene expression.
Given the critical role SMAD4 plays in facilitating canonical TGF-β signaling, considerable interest has been paid to how SMAD4 loss alters responses to TGF-β in cancer.
For premalignant cancers, TGF-β is a potent inhibitor that promotes cytostasis, differentiation, apoptosis, and inflammation (4, 5). However, for many advanced and metastatic cancers, TGF-β is a powerful ally that promotes epithelial-to-mesenchymal transition, metastasis, extravasation of colonization sites, and escape from immune surveillance (4, 5). These disparate responses to TGF-β signals are enabled by 2 different features of the pathway. First, the genes regulated by activated SMAD2/3-SMAD4 complexes are determined by a variable set of cell type and state dependent cofactors (4). Second, TGF-β signals can stimulate SMAD4-independent pathways to drive responses that are unrelated to or even opposed to the SMAD4-dependent pathway (6–9). The frequent loss of SMAD4 and infrequent mutation of TGF-β-receptors in PDAC (8, 10) suggest that selective inactivation of SMAD4-dependent TGF-β signaling allows PDAC to escape the SMAD4-dependent inhibitory effects of TGF-β while preserving SMAD4-independent protumor effects.
Although this is an attractive hypothesis, the changes in gene expression and cancer phenotype that are enabled by SMAD4 loss in PDAC have proven elusive. Studies in mouse models of PDAC have supported a role for SMAD4 loss in promoting the development of PDAC in the context of activating Kirsten rat sarcoma viral oncogene homolog (KRAS) mutations (11, 12), but offered few mechanistic insights beyond the suggestion that SMAD4 loss removes the growth-inhibitory effects of TGF-β signaling. Abolition of TGF-β signaling by TGFBR2 knockout in the context of activating KRAS mutation produced a similar tumorigenic phenotype to SMAD4 loss in the mouse (13), suggesting that the mouse models have not fully captured the role of SMAD4 loss in PDAC progression. Studies using human PDAC cell lines have produced frustratingly contradictory results. With respect to the role of SMAD4 loss in tumorigenesis, reports have alternatively suggested that SMAD4 loss relaxes the antiproliferative effects of TGF-β signaling (14–17), removes an antiproliferative effect of SMAD4 that is independent of TGF-β signaling (18–20), or has no effect on proliferation (21–23). Similarly, reports have disagreed on the role for SMAD4 loss in metastasis-associated phenotypes with suggestions that SMAD4 loss promotes angiogenesis without altering invasiveness (21, 22) or has no impact on angiogenesis (20), or that SMAD4 loss primarily increases invasiveness (17, 23–25). A major limitation of these studies is that each relied on either transient manipulation of SMAD4 expression levels or the selection of a stable clone with constitutively altered SMAD4 levels.
To address the role of SMAD4 loss in PDAC progression and provide a more granular view of the impact of SMAD4 loss on gene expression and cancer phenotypes, we employed a novel approach and generated SMAD4-null PDAC cell lines containing a SMAD4 cDNA under the control of an inducible tetracycline expression system (Tet-ON) promoter. Using this system, we assessed the effects of SMAD4 expression in SMAD4-null PDAC.
Materials and Methods
Cell culture
BxPC3, CFPAC1, and 293T cell lines were obtained from the American Type Culture Collection. BxPC3 was cultured in RPMI 1640 media (Life Technologies) with 10% tetracycline-free fetal bovine serum (FBS) (Clontech) and 1% penicillin-streptomycin (Life Technologies). CFPAC1 was cultured in Iscove's Modified Dulbecco's media (Life Technologies) with 10% tetracycline-free FBS (Clontech) and 1% penicillin-streptomycin (Life Technologies). 293T was cultured in Dulbecco's Modified Eagle's Medium media (Life Technologies) with 10% tetracycline-free FBS (Clontech) and 1% penicillin-streptomycin (Life Technologies). Penicillin-streptomycin was excluded from cell culture media for experiments including transfection. Adherent cells were dissociated using 0.025% trypsin-EDTA (Life Technologies). Cells were visualized using a Primovert inverted light microscope (Zeiss) and counted using a TC20 Automated Cell Counter (Bio-Rad).
Generation of inducible cell lines
The pDONOR-SMAD4 plasmid was obtained from Dr Kenneth Scott and cloned into pINDUCER-Puro (26) using Gateway LR Clonase II Enzyme Mix (Invitrogen) following the manufacturer's protocol. The resulting pINDUCER-SMAD4-Puro plasmid was verified by DNA sequencing (Beckman Coulter Genomics). Virus was generated by transfection of 293T cells grown to 60% confluence in a 6-well tissue culture plate (Corning) with 500 ng each of packaging factors VSV-G, Tat, Gag, and Pol along with 3 μg of pINDUCER-SMAD4-Puro plasmid using Lipofectamine 2000 (Invitrogen) following the manufacturer's transfection protocol. Eight hours after transfection, the media in each well were replaced with 2.5-ml fresh media. After 48 hours of viral production, virus-containing media were collected, pooled, filtered through a 0.45-μm polyvinylidene difluoride membrane (Millex), and added to either BxPC3 or CFPAC1 cells at 60% confluence in 10-cm tissue culture dishes (Corning). Infection was allowed to proceed for 7 hours, and then the media were replaced. A second round of virus collection and infection was performed 24 hours after the initial infection. After a 24-hour recovery period, infected cells were selected with 1-μg/mL puromycin (Invitrogen) for 72 hours, at which time the selection was reduced to a maintenance level of 100 ng/mL. Clones were isolated by cloning cylinder (Corning) and transferred to individual wells of a 12-well plate (Corning) for expansion.
Real-time PCR
Gene expression was analyzed by RT-qPCR using a 500 Fast Real-time System (Applied Biosystems) and SYBR Green PCR Master Mix (Invitrogen). All RT-quantitative PCR (qPCR) experiments were performed with technical triplicates and repeated in 3 independent experiments. Changes in gene expression were normalized to the endogenous control ACTB and calculated using the 2−ΔΔCt method with error reported as ±SEM.
Western blot analysis
Protein was isolated by lysing cells with radio immunoprecipitation assay lysis buffer (Pierce) supplemented by cOmplete EDTA-free protease inhibitor (Roche) and extracting the supernatant after high-speed centrifugation at 4°C. Protein quantification was performed using the Pierce BCA Protein Assay kit following the manufacturer's protocol. Isolated proteins were prepared for SDS-PAGE separation by dilution with 4× NuPAGE Sample buffer (Invitrogen), addition of 2-mercapaethanol (Sigma), boiling, and cooling. Isolated proteins were then analyzed by Western blotting. Protein separation via SDS-PAGE was performed on a NuPAGE 4%–12% Bis-Tris gel (Life Technologies) with NuPAGE MES SDS Running buffer (Life Technologies). Proteins were transferred to a polyvinylidene difluoride membrane, blocked with 3% milk in tris-buffered saline and tween 20, probed with protein-specific antibodies, incubated with horseradish peroxidase-conjugated secondary antibodies, and visualized via enhanced chemiluminescence using the SuperSignal West Pico Chemiluminescent Substrate (Thermo Scientific). Primary antibodies used in this study include: SMAD4 AF2097 antigoat by R&D Systems at 1:2000 dilution, ACTIN A3853 antimouse by Sigma-Aldrich at 1:5000 dilution, and p21 (C-19) sc-397-G antigoat at 1:200 dilution. All antibodies were diluted in 3% milk in tris-buffered saline and tween 20. Quantification was performed using ImageJ gel analysis tool and normalized to ACTB.
Senescence
BxPC3-pINS4c5 cells were seeded to reach 70% confluence at 24 hours in Nunc Lab-Tek II Chamber Slides with Cover (Sigma-Aldrich). After 24 hours, cells in the experimental condition were treated with 1-μg/mL doxycycline. Seventy-two hours later, the samples were stained using the Senescence β-Galactosidase Staining kit (Cell Signaling) following the manufacturer's protocol. Slides were photographed using a PowerShot G12 digital camera (Canon) attached to a Primovert inverted light microscope (Zeiss) with the objective set to ×10.
Cell cycle
BxPC3-pINS4c5 or CFPAC1-pINS4c3 cells were seeded in 6-well plates. After 24 hours, 1-μg/mL doxycycline was added to experimental wells. Twenty-four hours after doxycycline treatment, cells were fixed with 70% ethanol (EtOH) and stained with 40-μg/mL propidium iodide (PI). Flow cytometry was performed using a BD FACSCanto II (BD Biosciences) with at least 10 000 events observed for each sample. Flow cytometry results were analyzed using FlowJo 7.6.5, and the Cell Cycle module with Watson model was used to determine the cell cycle phase distribution of each sample. Two modified versions of this protocol were used. In the first assay, experimental cells were treated with 1-μg/mL SB-505124 (Sigma-Aldrich) 2 hours before doxycycline addition. In the second assay, experimental cells were transfected with small interfering RNAs (siRNAs) 24 hours before doxycycline addition.
siRNA transfection
BxPC3-pINS4c5 cells were seeded in 24-well plates. After 24 hours, cells were transfected with 5 pmol/well siGENOME siRNA SMARTpool (GE Healthcare) against either cyclin-dependent kinase inhibitor 1A (CDKN1A) or nontargeting (NT) using Lipofectamine RNAiMAX (Invitrogen) diluted in serum-free Opti-MEM media (Life Technologies) following the manufacturer's transfection protocol. Knockdown was verified 24 and 48 hours after transfection using RT-qPCR and Western blotting for CDKN1A/p21.
Invasion
Matrigel invasion assays were performed using experimental BioCoat Matrigel Invasion Chambers (Corning) and control BioCoat Control Inserts (Corning) following the manufacturer's protocol. In brief, BxPC3-pINS4c5 cells were pretreated with 1-μg/mL doxycycline for 24 hours, collected, washed with PBS and serum-free RPMI 1640 media, diluted to 4E4 cells/mL in FBS-free RPMI 1640 media, and added in 500-μL aliquots to triplicate experimental and control inserts suspended in wells of a 24-well plate (Corning) containing 750-μL RPMI 1640 media with 10% FBS to act as a chemoattractant. The cells were incubated for 16 hours before analysis. To analyze the number of invading cells, each insert was fixed in 10% formalin and stained with Crystal violet. Each inset was then photographed 3 times using a PowerShot G12 digital camera (Canon) attached to a Primovert inverted light microscope (Zeiss) with the objective set to ×10. The number of invading cells in each photograph were counted manually, summed to give a total for the insert, and averaged across the triplicate wells for each condition. The invasion ratio for each experimental condition was calculated by dividing the average of the experimental inserts by the average of the control inserts, with a higher ratio indicating greater invasiveness in the assay.
Migration
BxPC3-pINS4 cells at confluence in a 6-well plate (Corning) were treated with either control media or experimental media with 1-μg/mL doxycycline (Sigma-Aldrich). After a 3-hour incubation, each well was scratched in vertical line with a P200 pipette tip and photographed. The same regions of each well were photographed again after 21.5 hours. For each time point, each scratch was photographed at 4 points using a PowerShot G12 digital camera (Canon) attached to a Primovert inverted light microscope (Zeiss) with the objective set to ×10. The area of the scratch in each photograph was measured by area tracing with area calculation using ImageJ, the area of the scratch in each photograph were summed for each well, and averaged across the 3 wells of each condition. Error is reported as ±SEM.
Microarray
BxPC3-pINS4c5 cells were seeded in 6-well plates to reach 60% confluence. After 24 hours, 1-μg/mL doxycycline was added to experimental wells. 8, 24, and 48 hours after doxycycline treatment, RNA was isolated using RNeasy Mini kit (QIAGEN) with deoxyribonuclease I treatment from 3 wells at each time point and from 3 untreated wells. Gene expression analysis was performed on an Illumina Human HT12_4 array by the Microarray Core Lab at University of Texas Health Science Center. Array data are available through the Gene Expression Omnibus (accession GSE70940). Analysis of the microarray was performed using GenomeStudio software (Illumina) and included quality control checks of hybridization and signal generation using sample-independent controls, background subtraction, and array normalization using quantile. Differential expression analysis was performed to identify genes with significantly altered expression (≥2-fold change in expression with P < .01) at each of the time points. Transcripts with signal less than 50 for both time points in a pairwise comparison were excluded. The set of top differential genes found for any treatment group were clustered, using a supervised approach as described elsewhere (27). Expression patterns were visualized as color maps using Java TreeView (28). Select genes with significantly altered expression were validated by RT-qPCR.
Results
Inducible expression of SMAD4 in PDAC cell lines
Because loss of SMAD4 expression is thought to be a late event in pancreatic cancer progression, we sought to interrogate the tumor suppressive role of SMAD4 by restoring its expression in human PDAC cell lines. To this end, we generated stable cell lines in which expression of a SMAD4 cDNA sequence is placed under the control of a Tet-ON promoter (so that addition of doxycycline to the cell culture media induces expression of SMAD4) by transfection of the cell lines with a pINDUCER-SMAD4-Puro construct (Figure 1A). The 2 SMAD4-null cell lines that formed the basis for our inducible cell lines are BxPC3, which was isolated from the primary tumor of a female patient aged 61 years without metastasis (29), and CFPAC1, which was isolated from a liver metastasis of a male patient aged 26 years (30). BxPC3 is wild type (WT) for KRAS, has a 220 Cys tumor protein P53 (TP53) mutation, homozygous deletion of CDKN2A/p16, and homozygous deletion of SMAD4 (31). CFPAC1 has a 12 Val mutation in KRAS, is WT for TP53, WT for CDKN2A/p16, and has homozygous deletion of SMAD4 (31). This genotype information on BxPC3 and CFPAC1 is summarized in Table 1. The stable clones of BxPC3 and CFAPC1 expressing the pINDUCER-SMAD4-Puro construct, designated BxPC3-pINS4c5 and CFPAC1-pINS4c3 respectively, were assessed for induction of SMAD4 expression by RT-qPCR to detect SMAD4 mRNA expression (data not shown) and Western blotting to confirm SMAD4 protein expression (Figure 1, B and C). Restoration of TGF-β signaling after induction of SMAD4 expression was assessed by RT-qPCR for the TGF-β signaling-inducible gene plasminogen-activator inhibitor-1 (PAI1). BxPC3-pINS4c5 showed 14× induction of PA1 expression 24 hours after addition of 1-μg/mL doxycycline (Figure 1D) and CFAPC1-pINS4c3 showed 2× induction (data not shown). To verify that this effect was specific to the restoration of TGF-β signaling and not a consequence of SMAD4 overexpression, we cotreated the BxPC3-pINS4c5 and CFAPC1-pINS4c3 cell lines with 1-μg/mL doxycycline and 1-μg/mL SB-505124, an activin receptor-like kinase 4/5/7 inhibitor, (Figure 1D), and found this eliminated the induction of PAI1. Having verified the restoration of TGF-β signaling in our inducible cell lines upon expression of SMAD4, we sought to characterize the phenotypic effects of SMAD4 expression.
Figure 1.
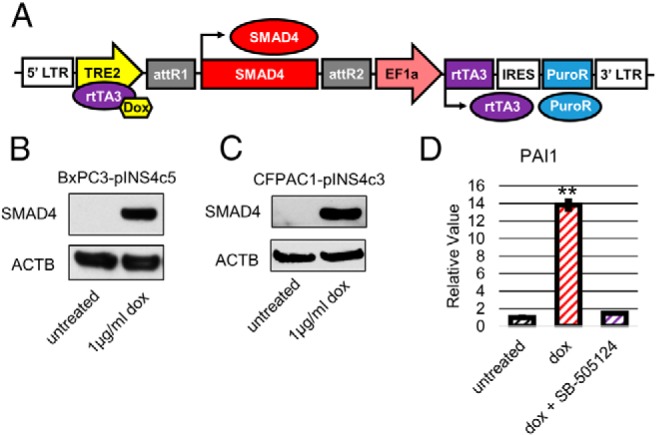
Generation of SMAD4-null PDAC cell lines with inducible expression of SMAD4. A, pINDUCER-SMAD4-Puro construct. pINDUCER is a lentiviral system that drives constitutive expression of the inducible transactivator rtTA3 and a puromycin resistance gene by the EF1a promoter while placing SMAD4 under the control of the Dox+rtTA3 inducible TRE2 promoter. SMAD4 is expressed after doxycycline treatment. Stable clones of the pancreatic cancer cell lines BxPC3 and CFPAC1 were selected by puromycin. B, Addition of doxycycline induces SMAD4 protein expression. Western blotting was performed on 15 μg of total protein isolated from BxPC3-pINS4c5 cells after a 24-hour culture with or without 1-μg/mL doxycycline. Addition of doxycycline induced SMAD4 protein expression. C, Addition of doxycycline induces SMAD4 protein expression. Western blotting was performed on 30 μg of total protein isolated from CFPAC1-pINS4c3 cells after a 24-hour culture with or without 1-μg/mL doxycycline. Addition of doxycycline induced SMAD4 protein expression. D, SMAD4 expression restores TGF-β signaling in BxPC3. Expression of TGF-β-inducible gene PAI1 was compared between untreated BxPC3-pINS4c5, BxPC3-pINS4c5 treated for 24 hours with 1-μg/mL doxycycline, and BxPC3-pINS4c5 treated for 24 hours with 1-μg/mL dox + 1-μg/mL TGF-β inhibitor SB-505124. PAI1 expression levels were normalized to ACTB and compared with BxPC3-pINS4c5 without doxycycline treatment. Error bars are ±SEM for technical triplicates. Comparisons are Student's 2-tailed paired t test with ***, P ≤ .001; **, P ≤ .005; *, P ≤ .05.
Table 1.
Genotype of PDAC Cell Lines BxPC3 and CFPAC1
| Gene | BxPC3 | CFPAC1 |
|---|---|---|
| KRAS | WT | 12 Val |
| TP53 | 220 Cys | WT |
| CDKN2A/p16 | HD | WT |
| SMAD4 | HD | HD |
Prominent mutations in PDAC cell lines BxPC3 and CFPAC1. HD, homozygous deleted. Data on status of each gene are summarized from Ref. 31.
SMAD4 expression attenuates proliferation and induces senescence in PDAC cell line BxPC3
Fluorescence-activated cell sorting (FACS) analysis of BxPC3-pINS4c5 and CFAPC1-pINS4c3 cell lines treated for 24 hours with 1-μg/mL doxycycline and stained with PI showed that expression of SMAD4 induces G1 arrest in BxPC3-pINS4c5 (Figure 2A); however, no arrest was observed for CFPAC1-pINS4c3 (Supplemental Figure 1A). We verified that this arrest phenotype was due to restoration of TGF-β signaling by FACS analysis of BxPC-pINS4c5 cells cotreated with 1-μg/mL doxycycline and 1-μg/mL SB-505124, which eliminated the arrest phenotype (Figure 2B). To further characterize the G1 arrest phenotype, we tested for senescence by β-galactosidase staining of BxPC-pINS4c5 cells treated with 1-μg/mL doxycycline for 72 hours and by assessing the expression of Lamin B1 (LMNB1), a gene repressed in senescent cells (32), after 24 hours of 1-μg/mL doxycycline treatment. Both positive β-galactosidase staining (Figure 2C) and senescence-associated repression of LMNB1 expression (Figure 2D) were observed, indicating that SMAD4 expression induces senescence in BxPC3-pINS4c5.
Figure 2.

Restoration of TGF-β signaling induces G1 arrest and senescence in PDAC cell line BxPC3. A, SMAD4 expression in BxPC3 induces G1 arrest 24 hours after doxycycline addition. A total of 1-μg/mL doxycycline was added to experimental wells. Twenty-four hours after doxycycline treatment, cells were fixed with 70% EtOH and stained with 40-μg/mL PI for flow cytometry to stratify cells by DNA content. FlowJo's Cell Cycle module with Watson model was used to determine the cell cycle phase distribution of each sample based on the PI staining. The increase in the G1 phase population after doxycycline treatment indicates G1 arrest. B, SMAD4-induced G1 arrest is dependent on TGF-β signaling. SB-505124, an Activin receptor-like kinase 4/5/7 inhibitor, was added to experimental wells at 1 μg/mL. After 2 hours, 1-μg/mL doxycycline was added to experimental wells. Twenty-four hours after doxycycline treatment, cells were fixed with 70% EtOH and stained with 40-μg/mL PI for flow cytometry to stratify cells by DNA content. FlowJo's Cell Cycle module with Watson model was used to determine the cell cycle phase distribution of each sample based on the PI staining. SB-505124 pretreatment eliminated the G1 arrest effect of SMAD4 expression seen in A. C, SMAD4 expression induces senescence in BxPC3-pINS4c5. BxPC3-pINS4c5 cells in the experimental condition were treated with 1-μg/mL doxycycline. Seventy-two hours later, the samples were stained using Senescence β-galactosidase Staining kit (Cell Signaling). The presence of blue-stained cells indicates senescence. D, SMAD4 expression induces senescence-associated repression of LMNB1 in BxPC3-pINS4c5. Expression of LMNB1, a gene repressed in senescent cells, was compared by RT-qPCR between untreated BxPC3-pINS4c5 and BxPC3-pINS4c5 treated for 24 hours with 1-μg/mL doxycycline. LMNB1 expression levels were normalized to ACTB and compared with BxPC3-pINS4c5 without doxycycline treatment. Error bars are ±SEM for technical triplicates. Comparisons are Student's 2-tailed paired t test with **, P ≤ .001; *, P ≤ .005.
CDKN1A/p21 up-regulation is necessary for the antiproliferative effect of SMAD4 expression in BxPC3
Because TGF-β signaling induces G1 arrest and senescence through induction of CDKN1A/p21 expression in several contexts (14, 33–36), we sought to characterize the role of CDKN1A/p21 induction in our PDAC cell lines. We transfected BxPC3-pINS4c5 with a siGENOME SMARTpool (GE Life Sciences) against CDKN1A or a NT-siRNA pool, waited 24 hours to allow for inhibition of CDKN1A/p21 expression, added 1-μg/mL doxycycline, waited another 24 hours, and then assessed expression of CDKN1A/p21 by RT-qPCR and Western blot analysis, cell cycle analysis by FACS with PI staining, and senescence analysis by RT-qPCR for LMNB1 repression. Expression of SMAD4 in BxPC3-pINS4c5 mildly increased CDKN1A/p21 mRNA expression (Figure 3A) and induced CDKN1A/p21 protein expression by approximately 7× (Figure 3, B and C). In the SMAD4-null PDAC cell line CFPAC1-pINS4c3, CDKN1A/p21 was not up-regulated by SMAD4 expression (Supplemental Figure 1B). Treatment with the CDKN1A-siRNAs reduced expression of CDKN1A/p21 mRNA by approximately 90% (Figure 3A) and eliminated the induction of CDKN1A/p21 protein expression in BxPC3-pINS4c5 by SMAD4 expression (Figure 3, B and C). The control NT-siRNA pool had no effect on either CDKN1A/p21 mRNA or protein expression (Figure 3, A–C) and no siRNA treatment impacted the restoration of TGF-β signaling as measured by induction of PAI1 expression (data not shown). Inhibition of CDKN1A/p21 induction by TGF-β signaling after SMAD4 expression eliminated the G1 arrest effect (Figure 4A) and senescence-associated repression of LMNB1 mRNA expression (Figure 4B), indicating that CDKN1A/p21 induction is necessary for the SMAD4-induced G1 arrest and senescence phenotypes in BxPC3.
Figure 3.

SMAD4 expression in PDAC Cell Line BxPC3 induces CDKN1A/p21 expression that can be specifically abolished by CDKN1A-siRNA transfection. A, SMAD4 expression mildly induces mRNA expression of CDKN1A in BxPC3-pINS4c5 and CDKN1A-siRNA eliminates expression. Expression of CDKN1A was compared between untreated BxPC3-pINS4c5 ± 1-μg/mL doxycycline, BxPC3-pINS4c5 transfected with pooled NT-siRNA ± 1-μg/mL doxycycline, and BxPC3-pINS4c5 transfected with pooled CDKN1A-siRNA ± 1-μg/mL doxycycline. Transfection was performed 24 hours before treatment with doxycycline, and mRNA was isolated 24 hours after doxycycline treatment. CDKN1A expression levels were normalized to ACTB and compared with BxPC3-pINS4c5 without doxycycline treatment. Error bars are ±SEM for technical triplicates. B, Expression of SMAD4 induces p21 protein expression in BxPC3-pINS4c5 and CDKN1A-siRNA abolishes p21 protein expression. CDKN1A/p21 protein levels were compared between untreated BxPC3-pINS4c5 ± 1-μg/mL doxycycline, BxPC3-pINS4c transfected with pooled NT-siRNA ± 1-μg/mL doxycycline, and BxPC3-pINS4c transfected with pooled CDKN1A-siRNA ± 1-μg/mL doxycycline. Transfection was performed 24 hours before treatment with doxycycline, and protein was isolated 24 hours after doxycycline treatment. Western blotting was performed on 30 μg of total protein, and CDKN1A/p21 protein levels were compared with ACTB. Addition of doxycycline induced CDKN1A/p21 protein expression and pooled CDKN1A-siRNA eliminated this induction. Comparisons are Student's 2-tailed paired t test with ***, P ≤ .001; **, P ≤ .005; *, P ≤ .05. C, Quantification of CDKN1A/p21 protein expression. Western blotting pictured in B was quantified using gel analysis tool in ImageJ, normalized to ACTB, and compared with the untreated sample.
Figure 4.

Up-regulation of CDKN1A/p21 is necessary for G1 arrest and senescence effects of SMAD4 expression in PDAC cell line BxPC3. A, SMAD4-induced G1 arrest in BxPC3 is dependent on up-regulation of CDKN1A/p21. BxPC3-pINSc5 cells were transfected with pooled CDKN1A-siRNA, pooled NT-siRNA, or a mock treatment. Twenty-four hours after transfection, experimental cells were treated with 1-μg/mL doxycycline. Twenty-four hours after doxycycline treatment, cells were fixed with 70% EtOH and stained with 40-μg/mL PI for flow cytometry to determine cell cycle status. FlowJo's Cell Cycle module with Watson model was used to determine the cell cycle phase distribution of each sample. CDKN1A/p21-siRNA eliminated the G1 arrest effect of SMAD4 expression. B, SMAD4-induced senescence in BxPC3 is dependent on up-regulation of CDKN1A/p21. BxPC3-pINSc5 cells were transfected with pooled CDKN1A-siRNA, pooled NT-siRNA, or mock treatment. Twenty-four hours after transfection, experimental cells were treated with 1-μg/mL doxycycline. Twenty-four hours after doxycycline treatment, mRNA was isolated. LMNB1 expression levels were assessed by RT-qPCR, normalized to ACTB, and compared with BxPC3-pINS4c5 mock transfected without doxycycline treatment. CDKN1A/p21-siRNA eliminated the senescence-associate repression of LMNB1 by SMAD4 expression. Error bars are ±SEM for technical triplicates. Comparisons are Student's 2-tailed paired t test with **, P ≤ .001; *, P ≤ .005.
Expression of SMAD4 does not impact invasiveness in PDAC cell line BxPC3 but decreases migration
We investigated the role that SMAD4 loss plays in PDAC progression by assessing the effects of SMAD4 expression on the metastasis-associated phenotypes of invasion and migration. For invasion, we performed a Matrigel invasion assay comparing untreated BxPC3-pINS4c5 cells with cells treated with 1-μg/mL doxycycline for 24 hours before the assay. We did not observe any effect of SMAD4 expression on invasion (Figure 5A and Supplemental Figure 2). To assess the effect of SMAD4 expression on migration, we performed a wound-closure assay after a 3-hour pretreatment with 1-μg/mL doxycycline. We observed a 71% decrease in wound-closure over the 24 hours after SMAD4 expression in BxPC3-pINS4c5, indicating that SMAD4 expression inhibited migration (Figure 5B).
Figure 5.
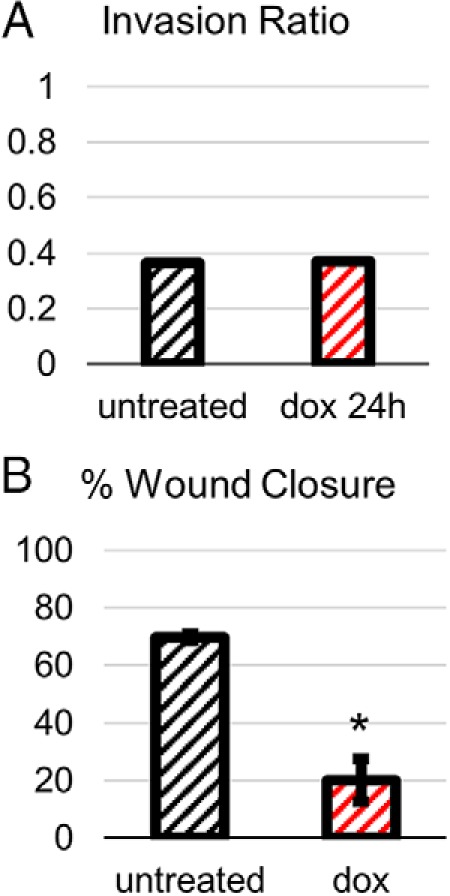
Expression of SMAD4 in BxPC3 does not impact invasiveness but decreases migration. A, Expression of SMAD4 has no effect on invasiveness of BxPC3. Invasiveness was measured by Matrigel invasion assay with invasion ratio calculated by dividing the number of invading cells in experimental Matrigel-coated inserts by the number of invading cells in the control inserts. Untreated BxPC3-pINS4c5 cells were compared with BxPC3-pINS4c5 cells treated with 1-μg/mL doxycycline 24 hours before the invasion assay. B, Expression of SMAD4 decreases migration of BxPC3 by 71%. Migration was measured by wound healing assay. Confluent wells of BxPC3-pINS4c5 ± 3-hour pretreatment with 1-μg/mL doxycycline were scratched with a P200 pipette tip and the scratches were photographed at 0- and 21.5-hour time points; % wound closure was calculated for triplicate wells by measuring the change in the area of the scratch using ImageJ. Error bars are ±SEM. Comparisons are Student's 2-tailed paired t test with ***, P ≤ .001; **, P ≤ .005; *, P ≤ .05.
Gene expression analysis in PDAC cell line BxPC3 after SMAD4 expression reveals time-dependent regulatory effects
To assess the impact of SMAD4 expression on global patterns of gene expression in a SMAD4-null PDAC over time, we isolated mRNA from untreated BxPC3-pINS4c5 cells and at 8, 24, and 48 hours after addition of 1-μg/mL doxycycline. Differentially expressed genes (P < .01, fold change > 2) were identified between each condition (Figure 6A, Tables 2–7, and Supplemental Tables 1–7). Most changes in gene expression occurred in the first 24 hours after SMAD4 expression with 312 genes differentially expressed by 8 hours and 1002 by 24 hours. GO term analysis (Figure 6A and Supplemental Table 8) supports the observation of G1 arrest by 24 hours with down-regulation of “cell proliferation” in the 24h+Dox and 48h+Dox conditions and “mitotic cell cycle” in all doxycycline treated conditions starting at 8h+Dox. For a set of 28 genes previously found induced in a SMAD4-dependent manner by Levy and Hill (7) (Figure 6B and Supplemental Table 9), 10 were within our set of genes induced at 8 hours (P < 5E-14, one-sided Fisher's exact test). We verified the patterns of gene expression change noted in the microarray using RT-qPCR and found agreement between the 2 methods (Figure 6C).
Figure 6.

Gene expression profiling of PDAC cell line BxPC3 after forced SMAD4 expression. A, Gene expression profiles of BxPC3-pINS4c5 cells were taken at 8, 24, and 48 hours after addition of 1-μg/mL doxycycline. Differentially expressed genes (P < .01, fold change > 2) were identified at each time point relative to untreated control. Genes were sorted according to time of induction or repression. Selected gene classes (by Gene Ontology) are indicated for genes regulated at 8 or 24 hours. B, For a set of 28 genes previously found induced in a SMAD4-dependent manner in a different model system (7), the corresponding patterns are shown for our BxPC3-pINS4c5 system. C, RT-qPCR was performed using mRNA from BxPC3-pINS4c5 cells untreated or treated with 1-μg/mL doxycycline for 8, 24, or 48 hours to validate gene expression changes observed in the microarray analysis. Patterns of expression change for chorionic gonadotropin, β-polypeptide 5 (CGB5), matrix metallopeptidase 13 (MMP13), ADAM metallopeptidase with thrombospondin type 1 motif, 1 (ADAMTS1), and IL-1 receptor-like 1 (IL1RL1) closely match those observed via microarray. Comparisons are Student's 2-tailed paired t test with ***, P ≤ .001; **, P ≤ .005; *, P ≤ .05.
Table 2.
Gene Expression Changes Observed After SMAD4 Expression in BxPC3
| Comparison | Up (Number of Genes) | Down (Number of Genes) |
|---|---|---|
| 8 h | 221 | 91 |
| 8–24 h | 264 | 233 |
| 24 h | 566 | 536 |
| 24–48 h | 105 | 49 |
| 48 h | 707 | 524 |
Number of expression changes at each time point. Transcripts with a signal of greater than 50 in the pairwise comparison that showed more than or equal to 2-fold change in expression with a P < .05 are included. Comparisons: 8 hours is untreated vs 8 hours + doxycycline; 8–24 hours is 8 hours + doxycycline vs 24 hours + doxycycline; 24 hours is untreated vs 24 hours + doxycycline; 24–48 hours is 24 hours + doxycycline vs 48 hours + doxycycline; untreated vs 48 hours + doxycycline.
Table 3.
Top 25 (Log-Ratio) Up- and Down-Regulated Transcripts in BxPC3 8 Hours After SMAD4 Expression
| Gene ID | P Value | Log-Ratio | Accession |
|---|---|---|---|
| SDPR | 4.65E-06 | −2.509 | NM_004657.4 |
| ZNF488 | 2.07E-07 | −2.407 | NM_153034.2 |
| TNNI2 | 8.69E-07 | −2.260 | NM_003282.2 |
| ADAMTS1 | 7.36E-38 | −2.248 | NM_006988.3 |
| SLC1A3 | 1.06E-25 | −2.090 | NM_004172.3 |
| C1ORF110 | 2.68E-10 | −1.955 | NM_178550.3 |
| THAP11 | 7.36E-38 | −1.933 | NM_020457.2 |
| SRGAP3 | 1.12E-11 | −1.885 | NM_001033117.1 |
| RGS4 | 7.36E-38 | −1.772 | NM_005613.3 |
| GAS1 | 4.03E-06 | −1.701 | NM_002048.1 |
| C2ORF55 | 6.36E-07 | −1.669 | NM_207362.2 |
| PRRT3 | 2.44E-05 | −1.630 | NM_207351.3 |
| C4ORF18 | 7.84E-04 | −1.619 | NM_016613.5 |
| SORBS2 | 2.65E-03 | −1.604 | NM_003603.4 |
| KRT15 | 1.87E-16 | −1.596 | NM_002275.2 |
| TGFBR3 | 8.40E-13 | −1.583 | NM_003243.2 |
| E2F2 | 7.36E-38 | −1.566 | NM_004091.2 |
| HS.560046 | 4.04E-03 | −1.565 | CR741628 |
| MOSC1 | 1.64E-20 | −1.545 | NM_022746.2 |
| FXYD3 | 8.16E-07 | −1.544 | NM_005971.2 |
| PCDH20 | 3.03E-15 | −1.538 | NM_022843.2 |
| SERPINB13 | 2.73E-24 | −1.535 | NM_012397.2 |
| CDCA7 | 7.36E-38 | −1.509 | NM_031942.4 |
| BDNF | 6.30E-12 | −1.468 | NM_001709.3 |
| LOC645249 | 1.94E-06 | −1.455 | XM_928291.3 |
| LHB | 3.68E-38 | 4.798 | NM_000894.2 |
| CGB5 | 3.68E-38 | 4.797 | NM_033043.1 |
| MMP13 | 3.68E-38 | 4.678 | NM_002427.2 |
| UBC | 1.43E-09 | 4.583 | NM_021009.3 |
| CGB8 | 3.68E-38 | 4.382 | NM_033183.2 |
| CGB1 | 3.68E-38 | 4.310 | NM_033377.1 |
| CGB | 3.68E-38 | 3.909 | NM_000737.2 |
| IL11 | 3.68E-38 | 3.555 | NM_000641.2 |
| ITGB6 | 1.58E-06 | 3.236 | NM_000888.3 |
| RASGRP3 | 2.09E-05 | 3.140 | NM_170672.1 |
| CEMIP | 3.68E-38 | 3.012 | NM_018689.1 |
| ADAM19 | 3.68E-38 | 3.006 | NM_033274.2 |
| SERPINE1 | 3.68E-38 | 2.902 | NM_000602.1 |
| TUBB3 | 3.68E-38 | 2.877 | NM_006086.2 |
| ANGPTL4 | 1.73E-06 | 2.849 | NM_139314.1 |
| SLC16A2 | 3.68E-38 | 2.845 | NM_006517.2 |
| ID3 | 3.68E-38 | 2.778 | NM_002167.2 |
| CENPT | 4.22E-15 | 2.762 | NM_025082.3 |
| EN1 | 4.43E-08 | 2.743 | NM_001426.3 |
| VLDLR | 2.90E-05 | 2.725 | NM_001018056.1 |
| GPC4 | 2.17E-03 | 2.619 | NM_001448.2 |
| GRB10 | 1.55E-11 | 2.585 | NM_005311.3 |
| CDKN2C | 3.68E-38 | 2.576 | NM_078626.2 |
| C16ORF56 | 7.77E-15 | 2.558 | NM_025082.1 |
| BMP6 | 4.18E-07 | 2.551 | NM_001718.4 |
Most dramatically regulated genes 8 hours after SMAD4 expression. Transcripts with a signal of greater than 50 in the pairwise comparison that showed more than or equal to 2-fold change in expression with a P < .05 are included sorted by log-ratio to include the top 25 down- and up-regulated transcripts. TUBB3, tubulin, β-3 class III; THAP11, THAP domain containing 11.
Table 4.
Top 25 (Log-Ratio) Up- and Down-Regulated Transcripts in BxPC3 8–24 Hours After SMAD4 Expression
| Gene ID | P Value | Log-Ratio | Accession |
|---|---|---|---|
| LOC100128765 | 4.06E-05 | −2.934 | XM_001723069.1 |
| MNS1 | 9.02E-06 | −2.575 | NM_018365.1 |
| OSBP2 | 1.33E-04 | −2.439 | NM_030758.3 |
| TRAF1 | 1.30E-13 | −2.331 | NM_005658.3 |
| SPINK4 | 3.64E-11 | −2.204 | NM_014471.1 |
| KIF24 | 1.66E-06 | −2.166 | NM_194313.2 |
| CENPI | 2.61E-08 | −2.165 | NM_006733.2 |
| AOX1 | 2.20E-05 | −2.044 | NM_001159.3 |
| PKMYT1 | 6.44E-07 | −2.021 | NM_182687.1 |
| C15ORF42 | 1.72E-02 | −2.000 | NM_152259.3 |
| UBE2C | 2.16E-09 | −1.902 | NM_181799.1 |
| ESM1 | 8.66E-22 | −1.853 | NM_007036.3 |
| CASC5 | 1.89E-07 | −1.842 | NM_144508.3 |
| ACYP1 | 3.80E-05 | −1.841 | NM_203488.1 |
| MKI67 | 5.31E-06 | −1.836 | NM_002417.3 |
| IL1RL1 | 4.65E-20 | −1.821 | NM_003856.2 |
| TNIK | 1.05E-03 | −1.778 | NM_015028.1 |
| TFF1 | 3.02E-04 | −1.745 | NM_003225.2 |
| BIRC5 | 2.62E-08 | −1.739 | NM_001012271.1 |
| SH2D5 | 2.09E-04 | −1.727 | XM_375698.3 |
| ESPL1 | 1.34E-07 | −1.721 | NM_012291.4 |
| NCAPG | 3.62E-22 | −1.708 | NM_022346.3 |
| LOC81691 | 1.57E-05 | −1.633 | NM_030941.1 |
| IL1R2 | 4.41E-04 | −1.613 | NM_173343.1 |
| PIF1 | 4.67E-08 | −1.610 | NM_025049.2 |
| LOC646743 | 3.45E-04 | 6.573 | XM_929693.1 |
| BMF | 3.68E-38 | 6.024 | NM_033503.3 |
| KRT81 | 6.66E-16 | 4.201 | NM_002281.2 |
| CDH15 | 3.68E-38 | 3.951 | NM_004933.2 |
| LOC644023 | 7.60E-04 | 3.502 | XM_937657.1 |
| CGB7 | 3.68E-38 | 3.441 | NM_033142.1 |
| DPP6 | 2.03E-08 | 3.354 | NM_001039350.1 |
| CGB | 3.68E-38 | 3.333 | NM_000737.2 |
| LHB | 3.68E-38 | 3.170 | NM_000894.2 |
| SNCG | 3.80E-07 | 3.138 | NM_003087.1 |
| LOXL4 | 3.68E-38 | 3.125 | NM_032211.6 |
| CGB5 | 3.68E-38 | 3.122 | NM_033043.1 |
| TP53INP1 | 2.49E-12 | 3.047 | NM_033285.2 |
| CGB8 | 3.68E-38 | 3.023 | NM_033183.2 |
| ZNF750 | 9.81E-09 | 2.996 | NM_024702.2 |
| LOC339352 | 1.15E-04 | 2.985 | XR_019601.2 |
| DBP | 1.38E-11 | 2.921 | NM_001352.2 |
| LOC642749 | 6.64E-09 | 2.843 | XM_931058.1 |
| TMEM140 | 3.01E-11 | 2.775 | NM_018295.2 |
| MMP7 | 3.68E-38 | 2.765 | NM_002423.3 |
| CLIC3 | 3.68E-38 | 2.677 | NM_004669.2 |
| MAMDC2 | 3.68E-38 | 2.620 | NM_153267.3 |
| LOC645732 | 2.29E-04 | 2.619 | XM_928743.1 |
| HS.576106 | 3.27E-09 | 2.605 | AK097377 |
| WIPI1 | 3.68E-38 | 2.573 | NM_017983.4 |
Most dramatically regulated genes between 8 and 24 hours after SMAD4 expression. Transcripts with a signal of greater than 50 in the pairwise comparison that showed more than or equal to 2-fold change in expression with a P < .05 are included sorted by log-ratio to include the top 25 down- and up-regulated transcripts.
Table 5.
Top 25 (Log-Ratio) Up- and Down-Regulated Transcripts in BxPC3 24 Hours After SMAD4 Expression
| Gene ID | P Value | Log-Ratio | Accession |
|---|---|---|---|
| TLN2 | 1.73E-07 | −3.696 | NM_015059.1 |
| RGS4 | 7.36E-38 | −3.307 | NM_005613.3 |
| CYB5RL | 1.81E-06 | −3.306 | NM_001031672.2 |
| SHISA3 | 1.69E-07 | −3.194 | NM_001080505.1 |
| MNS1 | 1.07E-09 | −3.183 | NM_018365.1 |
| MASTL | 2.30E-11 | −3.059 | NM_032844.1 |
| SPINK4 | 3.60E-24 | −2.990 | NM_014471.1 |
| OSBP2 | 1.44E-12 | −2.984 | NM_030758.3 |
| IL1RL1 | 7.36E-38 | −2.976 | NM_003856.2 |
| FAM111B | 2.92E-07 | −2.883 | NM_198947.1 |
| FAM27A | 2.63E-04 | −2.771 | NR_024060.1 |
| SH2D5 | 1.19E-19 | −2.695 | XM_375698.3 |
| MCM10 | 7.36E-38 | −2.580 | NM_018518.3 |
| ACYP1 | 1.49E-13 | −2.422 | NM_203488.1 |
| DLEU1 | 4.97E-06 | −2.420 | NR_002605.1 |
| MOSC1 | 2.41E-33 | −2.298 | NM_022746.2 |
| SPC25 | 4.92E-11 | −2.291 | NM_020675.3 |
| PCDH20 | 7.36E-38 | −2.287 | NM_022843.2 |
| IL17RB | 2.60E-08 | −2.264 | NM_018725.3 |
| AOX1 | 1.15E-07 | −2.257 | NM_001159.3 |
| MYBBP1A | 5.34E-05 | −2.209 | NM_014520.2 |
| ISM1 | 1.16E-04 | −2.198 | NM_080826.1 |
| UBE2C | 5.38E-37 | −2.185 | NM_181799.1 |
| C1ORF110 | 1.05E-13 | −2.179 | NM_178550.3 |
| PKMYT1 | 4.87E-07 | −2.178 | NM_182687.1 |
| GPR68 | 9.55E-15 | 8.486 | NM_003485.3 |
| LHB | 3.68E-38 | 7.968 | NM_000894.2 |
| CGB5 | 3.68E-38 | 7.919 | NM_033043.1 |
| CGB8 | 3.68E-38 | 7.405 | NM_033183.2 |
| CGB | 3.68E-38 | 7.242 | NM_000737.2 |
| CGB1 | 3.68E-38 | 6.725 | NM_033377.1 |
| FAM20C | 3.68E-38 | 6.635 | NM_020223.2 |
| VCAN | 3.68E-38 | 5.991 | NM_004385.2 |
| MMP13 | 3.68E-38 | 5.474 | NM_002427.2 |
| LOC642749 | 5.17E-11 | 5.225 | XM_931058.1 |
| CGB7 | 3.68E-38 | 5.224 | NM_033142.1 |
| VIP | 9.98E-10 | 5.048 | NM_003381.2 |
| C4ORF26 | 3.84E-07 | 4.961 | NM_178497.2 |
| OSBPL1A | 3.68E-38 | 4.912 | NM_018030.3 |
| WNT4 | 3.17E-08 | 4.789 | NM_030761.3 |
| ADAM19 | 3.68E-38 | 4.622 | NM_033274.2 |
| ADSSL1 | 1.18E-14 | 4.451 | NM_152328.3 |
| UBC | 6.14E-08 | 4.248 | NM_021009.3 |
| IL11 | 3.68E-38 | 4.164 | NM_000641.2 |
| HS.576106 | 3.69E-12 | 4.157 | AK097377 |
| CDH15 | 3.68E-38 | 4.126 | NM_004933.2 |
| DPP6 | 6.15E-09 | 4.083 | NM_001039350.1 |
| LOXL4 | 3.68E-38 | 3.957 | NM_032211.6 |
| BMF | 4.66E-15 | 3.945 | NM_001003943.1 |
| SNCG | 4.41E-07 | 3.874 | NM_003087.1 |
Most dramatically regulated genes 24 hours after SMAD4 expression. Transcripts with a signal of greater than 50 in the pairwise comparison that showed more than or equal to 2-fold change in expression with a P < .05 are included sorted by log-ratio to include the top 25 down- and up-regulated transcripts.
Table 6.
Top 25 (Log-Ratio) Up- and Down-Regulated Transcripts in BxPC3 24–48 Hours After SMAD4 Expression
| Gene ID | P Value | Log-Ratio | Accession |
|---|---|---|---|
| ESM1 | 3.31E-12 | −4.925 | NM_007036.2 |
| TNFRSF11B | 1.74E-12 | −1.890 | NM_002546.3 |
| STK32A | 5.92E-05 | −1.873 | NM_145001.2 |
| DKK4 | 3.88E-05 | −1.867 | NM_014420.2 |
| STC1 | 7.36E-38 | −1.823 | NM_003155.2 |
| CLDN10 | 7.85E-06 | −1.723 | NM_006984.3 |
| GNG11 | 2.49E-10 | −1.657 | NM_004126.3 |
| TMPRSS11D | 3.21E-10 | −1.637 | NM_004262.2 |
| CGA | 2.24E-15 | −1.541 | NM_000735.2 |
| SNORD16 | 1.54E-20 | −1.518 | NR_002440.1 |
| CDH15 | 8.00E-11 | −1.497 | NM_004933.2 |
| ARG2 | 1.93E-09 | −1.439 | NM_001172.3 |
| CDKN2C | 1.70E-08 | −1.412 | NM_078626.2 |
| SCG5 | 3.44E-07 | −1.387 | NM_003020.1 |
| PPP4R4 | 9.27E-04 | −1.376 | NM_020958.2 |
| LOC643272 | 1.36E-10 | −1.352 | XM_926633.1 |
| SLC7A2 | 6.58E-05 | −1.306 | NM_001008539.2 |
| SOCS1 | 3.01E-04 | −1.299 | NM_003745.1 |
| HS.574590 | 4.01E-03 | −1.237 | DA728582 |
| HS.211930 | 3.24E-03 | −1.182 | XM_374307 |
| LOC100130111 | 3.49E-12 | −1.173 | XM_001713911.1 |
| TM4SF19 | 4.59E-06 | −1.168 | NM_138461.2 |
| DHRS9 | 4.61E-03 | −1.159 | NM_005771.3 |
| LOC100131608 | 5.47E-04 | −1.146 | XM_001715126.1 |
| COL8A1 | 5.48E-09 | −1.136 | NM_020351.2 |
| TRIM22 | 2.26E-08 | 4.907 | NM_006074.3 |
| C1R | 2.70E-05 | 2.973 | NM_001733.4 |
| KRT23 | 7.44E-09 | 2.954 | NM_015515.3 |
| MUC20 | 1.27E-07 | 2.852 | NM_001098516.1 |
| SPRR2E | 7.24E-05 | 2.777 | NM_001024209.2 |
| SLC27A2 | 2.22E-08 | 2.483 | NM_003645.2 |
| KRT86 | 3.13E-07 | 2.426 | NM_002284.3 |
| IL1F9 | 2.22E-16 | 2.408 | NM_019618.2 |
| TNNC1 | 1.11E-06 | 2.185 | NM_003280.1 |
| MMP7 | 3.68E-38 | 2.062 | NM_002423.3 |
| KRT4 | 3.05E-12 | 2.036 | NM_002272.2 |
| KRT81 | 2.42E-10 | 2.015 | NM_002281.2 |
| PPP2R2B | 1.64E-14 | 2.013 | NM_181676.1 |
| OLFML2A | 3.68E-38 | 1.957 | NM_182487.2 |
| SLC1A3 | 3.68E-38 | 1.916 | NM_004172.3 |
| IL8 | 3.68E-38 | 1.836 | NM_000584.2 |
| FLJ41603 | 2.76E-07 | 1.831 | NM_001001669.2 |
| SAA1 | 2.61E-03 | 1.825 | NM_000331.3 |
| MUC1 | 3.68E-38 | 1.809 | NM_001044391.1 |
| SULT2B1 | 8.84E-05 | 1.797 | NM_004605.2 |
| SPRR2F | 1.02E-05 | 1.787 | NM_001014450.1 |
| CXXC5 | 3.68E-38 | 1.756 | NM_016463.7 |
| SPRR2D | 2.60E-14 | 1.756 | NM_006945.3 |
| ALDH3B1 | 5.43E-04 | 1.717 | NM_000694.2 |
| TRIM31 | 1.25E-05 | 1.709 | NM_007028.3 |
Most dramatically regulated genes between 24 and 48 hours after SMAD4 expression. Transcripts with a signal of greater than 50 in the pairwise comparison that showed more than or equal to 2-fold change in expression with a P < .05 are included sorted by log-ratio to include the top 25 down- and up-regulated transcripts.
Table 7.
Top 25 (Log-Ratio) Up- and Down-Regulated Transcripts in BxPC3 48 Hours After SMAD4 Expression
| Gene ID | P value | Log-ratio | Accession |
|---|---|---|---|
| SPINK4 | 1.87E-29 | −5.990 | NM_014471.1 |
| ESM1 | 7.68E-09 | −4.985 | NM_007036.2 |
| RGS4 | 7.36E-38 | −4.107 | NM_005613.3 |
| LOC284757 | 7.36E-38 | −3.943 | NM_001004305.1 |
| STC1 | 7.36E-38 | −3.649 | NM_003155.2 |
| IL1RL1 | 7.36E-38 | −3.548 | NM_003856.2 |
| LOC100130769 | 1.87E-09 | −3.375 | XR_039217.1 |
| SH2D5 | 4.56E-19 | −3.375 | XM_375698.3 |
| FAM27A | 4.42E-05 | −3.172 | NR_024060.1 |
| LOC100133312 | 3.07E-05 | −2.997 | XR_038222.1 |
| SNORD21 | 1.34E-10 | −2.906 | NR_000006.8 |
| PCDH20 | 7.36E-38 | −2.841 | NM_022843.2 |
| FLJ40194 | 4.73E-09 | −2.824 | NM_001007529.1 |
| SHISA3 | 2.17E-07 | −2.807 | NM_001080505.1 |
| OSBP2 | 3.08E-13 | −2.777 | NM_030758.3 |
| IL13RA2 | 6.15E-07 | −2.625 | NM_000640.2 |
| CGA | 7.36E-38 | −2.559 | NM_000735.2 |
| HS.579631 | 7.31E-06 | −2.551 | BU536065 |
| ADAMTS1 | 7.36E-38 | −2.534 | NM_006988.3 |
| DHRS9 | 3.98E-12 | −2.519 | NM_005771.3 |
| VSIG1 | 8.10E-06 | −2.475 | NM_182607.3 |
| LOC100130516 | 5.42E-08 | −2.474 | XM_001720343.1 |
| HS.560046 | 2.06E-03 | −2.467 | CR741628 |
| BCYRN1 | 2.57E-06 | −2.434 | NR_001568.1 |
| ACYP1 | 1.34E-14 | −2.393 | NM_203488.1 |
| LHB | 3.68E-38 | 8.716 | NM_000894.2 |
| GPR68 | 2.16E-12 | 8.652 | NM_003485.3 |
| CGB5 | 3.68E-38 | 8.480 | NM_033043.1 |
| CGB8 | 3.68E-38 | 7.976 | NM_033183.2 |
| CGB | 3.68E-38 | 7.970 | NM_000737.2 |
| FAM20C | 3.68E-38 | 7.348 | NM_020223.2 |
| CGB1 | 3.68E-38 | 7.087 | NM_033377.1 |
| VCAN | 1.86E-07 | 6.260 | NM_004385.2 |
| SSPN | 2.49E-07 | 6.152 | NM_005086.3 |
| LOC642749 | 7.60E-11 | 5.931 | XM_931058.1 |
| CGB7 | 8.72E-11 | 5.872 | NM_033142.1 |
| WNT4 | 3.68E-38 | 5.534 | NM_030761.3 |
| OSBPL1A | 1.11E-15 | 5.528 | NM_018030.3 |
| SULT2B1 | 5.94E-08 | 5.358 | NM_004605.2 |
| LOXL4 | 3.68E-38 | 5.202 | NM_032211.6 |
| MMP13 | 3.68E-38 | 5.166 | NM_002427.2 |
| MMP7 | 3.68E-38 | 5.076 | NM_002423.3 |
| KRT86 | 9.59E-10 | 5.028 | NM_002284.3 |
| MUC20 | 1.12E-09 | 5.006 | NM_001098516.1 |
| SNCG | 6.14E-12 | 4.977 | NM_003087.1 |
| VIP | 8.61E-11 | 4.812 | NM_003381.2 |
| SPRR2E | 5.98E-06 | 4.725 | NM_001024209.2 |
| DPP6 | 1.73E-09 | 4.692 | NM_001039350.1 |
| ADSSL1 | 4.88E-14 | 4.668 | NM_152328.3 |
| CXXC5 | 3.68E-38 | 4.508 | NM_016463.7 |
Most dramatically regulated genes 48 hours after SMAD4 expression. Transcripts with a signal of greater than 50 in the pairwise comparison that showed more than or equal to 2-fold change in expression with a P < .05 are included sorted by log-ratio to include the top 25 down- and up-regulated transcripts.
Discussion
In this study, we generated a novel inducible system for studying the effects of SMAD4 expression in SMAD4-null cells using the PDAC cell lines BxPC3 and CFPAC1. Using these inducible cell lines, we showed that expression of SMAD4 leads to G1 arrest and senescence dependent on up-regulation of CDKN1A/p21 in BxPC3, whereas in CFPAC1, there is no antiproliferative effect or up-regulation of CDKN1A/p21. One possible cause for this difference is KRAS status, BxPC3 is WT for KRAS, whereas CFPAC1 has an activating 12 Val mutation (31). Constitutively activated KRAS can act as a general damper on TGF-β signaling, inhibiting responses to canonical TGF-β signaling by negatively regulating SMAD2 and SMAD3 (37). In line with this hypothesis, we observed reduced or absent induction of TGF-β responsive genes after SMAD4 expression in CFPAC1 when compared with BxPC3 (data not shown). The standard model for PDAC tumorigenesis from pancreatic intraepithelial neoplasia (PanIN) lesions posits that KRAS activation is an initiating event for PanIN formation while SMAD4 loss is a late event (38–41). The absence of antiproliferative effects after SMAD4 expression in CFPAC1 supports this model because our observations suggest that activated KRAS eliminates the antiproliferative effect of TGF-β signaling, making SMAD4 loss superfluous for early PanIN development. Although more than or equal to 90% of PDACs have activating KRAS mutations (42, 43), a significant minority of PDACs, 5 of 99 in one recent study (42), have WT KRAS. For this minority of PDACs, our data in the KRAS WT cell line BxPC3 suggest an alternate mechanism of tumorigenesis. Based on the G1 arrest we observed after expression of SMAD4 in the KRAS WT cell line BxPC3, we hypothesize that SMAD4 loss is an early event of tumorigenesis that removes TGF-β signaling-mediated growth inhibition in PDACs lacking activating KRAS mutations. It is possible that the loss of other members of the TGF-β signaling pathway might serve equally well to inactivate the antiproliferative effects of TGF-β signaling, however, given the prevalence of SMAD4 loss in PDAC, SMAD4 seems the most likely candidate. Testing this hypothesis offers several opportunities for future study. First, a survey of patient samples is needed to address the prevalence of SMAD4 loss in PDACs without activated KRAS to determine whether PDACs without activated KRAS are more likely to have lost SMAD4 expression than PDACs with activated KRAS. Second, as pancreatic SMAD4 loss alone is insufficient to initiate PDAC in mice (12), the genetic context in which SMAD4 loss could act as an initiating event for PDAC in the absence of activated KRAS must be identified. Third, although previous studies have not identified SMAD4 loss in the earliest PDAC precursor lesions, new studies are necessary to determine whether SMAD4 loss can be seen at the early stages of lesion development in a subset of patients or in lesions where activating KRAS is absent.
Although the observation that signaling through TGF-β in BxPC3 cells can impede proliferation by up-regulation of CDKN1A/p21 was previously described in Yasutome et al (20), the role we present for SMAD4 differs markedly from this previous study. Yasutome et al found that expression of SMAD4 in BxPC3 cells increases doubling time, but does not impact cell cycle phase distribution or alter responses to TGF-β1 treatment (20). Although they noted a weak antiproliferative effect of TGF-β1 treatment dependent on up-regulation of CDKN1A/p21, this effect was independent of SMAD4 expression (20). In contrast, our study indicates that SMAD4 expression in BxPC3 cells drives a strong antiproliferative response to TGF-β signaling through up-regulation of CDKN1A/p21. The reason for these contradictory findings is likely methodological. Yasutome et al studied stable clones that constitutively expressed SMAD4 (20). The selection of clones that constitutively express SMAD4 precluded the observation of our phenotype as only cells that were able to escape the G1 arrest induced by SMAD4 expression could proliferate to form clones. By placing SMAD4 expression under the control of a Tet-ON promoter, we avoided this limitation and examined the direct effects of SMAD4 expression in BxPC3.
Our observation that SMAD4 expression does not affect invasiveness differs from the conclusions of Duda et al (22), which described an antiinvasive effect of SMAD4 expression in PDAC cell lines. However, this apparent contradiction is likely due to differences in methodology. Duda et al assayed invasiveness by characterizing in vivo tumor growth after sc injection of PDAC cells (22), whereas our study relied on an in vitro Matrigel assay. In the in vivo study described by Duda et al, angiogenesis, migration, and invasion are simultaneously assayed and the failure of SMAD4-transfected PDAC cells to develop invasive tumors is attributable to failures in each (22). In our in vitro assay, invasiveness is more specifically defined as how effectively cells penetrate a layer of Matrigel. Our wound-healing assay demonstrates that although SMAD4 expression has no effect on invasiveness in BxPC3 cells, it does significantly reduce their motility, which would likely impair the development of invasive tumors.
We performed a detailed study of gene expression 8, 24, and 48 hours after induction of SMAD4 expression. We found 221 genes up-regulated by SMAD4 expression at 8 hours. Many of these genes had not previously been associated with TGF-β-signaling regulation including anthrax toxin receptor 2 (3.58× at 8 h), which has been implicated in promoting tumor angiogenesis and tumor growth (44); tubulin, β-3 class III (7.35× at 8 h), which regulates axon guidance (45), a pathway frequently altered in PDAC (42); and cell migration inducing protein, hyaluronan binding (8.07× at 8 h), which has been implicated in promoting multiple cancer phenotypes (46, 47). We found 91 genes down-regulated by SMAD4 expression at 8 hours, including a number of novel targets. A few notable examples include IL-1 receptor-like 1 (IL1RL1) (0.403× at 8 h), a candidate driver of inflammation-associated pancreatic carcinogenesis (48); regulator of G protein signaling 4 (RGS4) (0.293× at 8 h), a regulator of G protein signaling implicated in regulation of migration and invasion (49, 50); and THAP domain containing 11 (0.262× at 8 h), a transcriptional regulator overexpressed in colon cancer that may have progrowth effects in cancer (51). The regulation of these genes within hours of SMAD4 expression suggests that they may be direct targets and future studies are needed to address the role of TGF-β-signaling in their regulation.
Comparing our results with those of previous microarray studies of SMAD4-regulated genes, we find a few similarities, but also notable differences. Levy and Hill's 2005 paper (7) distinguished between SMAD4-dependent and SMAD4-independent responses to TGF-β signaling by inducible RNA interference against SMAD4 in a SMAD4-WT immortalized keratinocyte cell line before 1 or 6 hours of TGF-β treatment. Looking at Levy and Hill's results, we observe several differences when compared with our early 8-hour time point. First, we identified more genes regulated by TGF-β signaling (312 vs 114), possibly a function of our more dramatic alteration of SMAD4 expression. Second, although we observed significant overlap in the SMAD4-dependent genes identified by both studies, most the expression changes described as SMAD4-dependent in the 2 datasets are distinct. Third, 20 out of the 44 genes categorized as TGF-β-dependent-SMAD4-independent in Levy and Hill's paper, including CDKN1A, JUNB, TGFBR3, CLDN1, ID3, and SMAD7, were differentially regulated upon expression of SMAD4 in our study, suggesting that regulation of these genes by TGF-β signaling is dependent on SMAD4. Our study is also distinct from Jazag et al (23), which compared gene expression responses to TGF-β treatment in SMAD4 WT PDAC cell line Panc-1 ± partial knockdown of SMAD4 expression by RNA interference, with few similarities apparent in the SMAD4-dependent gene expression changes observed between our studies other than the SMAD4-dependent CDKN1A/p21 up-regulation seen in both. The dissimilarity likely stems from the partial knockdown method employed by Jazag et al and their shorter time point (2 hours of TGF-β1 treatment) (23).
This study characterized the impact of SMAD4 expression in SMAD4-null human PDAC cells on both phenotype and gene expression. The G1 arrest and senescence observed after SMAD4 expression in a PDAC cell line without an activating KRAS mutation suggests that SMAD4 loss may occur at an earlier stage of tumorigenesis than the current model of pancreatic tumorigenesis predicts in a subset of PDACs. Our gene expression study characterized over 1200 transcripts differentially regulated by the restoration of TGF-β signaling in PDAC and identified novel regulatory targets of TGF-β signaling. The gene expression changes we observed upon restoration of TGF-β signaling open numerous avenues of investigation into PDAC biology and present potential therapeutic opportunities that future studies should explore.
Acknowledgments
We thank Dr Kenneth Scott for providing the pDONOR-SMAD4 plasmid, Fengju Chen for technical assistance with the expression array analysis, Dr Stephanie Pangas and members of the Matzuk laboratory for critical comments. We also appreciate the expert assistance of Joel M. Sederstrom.
This work was supported by Eunice Kennedy Shriver National Institute of Child Health and Human Development Grant HD033438 (to M.M.M.), National Institute of General Medical Sciences Grant T32GM008307 (to P.T.F.), National Cancer Institute Grant P30CA125123 (to C.J.C.), and the Cancer Prevention Research Institute of Texas Grant RP120713-C2 (to C.J.C.). The Cytometry and Cell Sorting Core at Baylor College of Medicine was funded by National Institutes of Health Grants P30 AI036211, P30 CA125123, and S10 RR024574.
Disclosure Summary: The authors have nothing to disclose.
Footnotes
- ACTB
- Beta-actin
- CDKN1A
- cyclin-dependent kinase inhibitor 1A
- EtOH
- ethanol
- FACS
- flourescence-activated cell-sorting
- FBS
- fetal bovine serum
- IL1RL1
- IL-1 receptor-like 1
- KRAS
- Kirsten rat sarcoma viral oncogene homolog
- LMNB1
- Lamin B1
- NT
- nontargeting
- PAI1
- plasminogen-activator inhibitor-1
- PanIN
- pancreatic intraepithelial neoplasia
- PDAC
- pancreatic ductal adenocarcinoma
- PI
- propidium iodide
- qPCR
- quantitative PCR
- RGS4
- regulator of G protein signaling 4
- siRNA
- small interfering RNA
- Tet-ON
- tetracycline inducible expression system
- TGFBR2
- transforming growth factor receptor
- TP53
- Tumor Protein P53
- WT
- wild type.
References
- 1. Howlader N, Noone AM, Krapcho M, et al. SEER Cancer Statistics Review, 1975–2010. Bethesda, MD; 2013. Available at: http://seer.cancer.gov/csr/1975_2010/ Accessed February 10, 2015. [Google Scholar]
- 2. Patel JD, Krilov L, Adams S, et al. Clinical cancer advances 2013: annual report on progress against cancer from the American Society of Clinical Oncology. J Clin Oncol. 2014;32(2):129–160. [DOI] [PubMed] [Google Scholar]
- 3. Iacobuzio-Donahue CA, Fu B, Yachida S, et al. DPC4 gene status of the primary carcinoma correlates with patterns of failure in patients with pancreatic cancer. J Clin Oncol. 2009;27(11):1806–1813. [DOI] [PMC free article] [PubMed] [Google Scholar]
- 4. Massagué J. TGF-β in cancer. Cell. 2008;134:215–230. [DOI] [PMC free article] [PubMed] [Google Scholar]
- 5. Tian M, Neil JR, Schiemann WP. Transforming growth factor-β and the hallmarks of cancer. Cell Signal. 2011;23(6):951–962. [DOI] [PMC free article] [PubMed] [Google Scholar]
- 6. Inman GJ. Switching TGFβ from a tumor suppressor to a tumor promoter. Curr Opin Genet Dev. 2011;21(1):93–99. [DOI] [PubMed] [Google Scholar]
- 7. Levy L, Hill CS. Smad4 dependency defines two classes of transforming growth factor β (TGF-β) target genes and distinguishes TGF-β-induced epithelial-mesenchymal transition from its antiproliferative and migratory responses. Mol Cell Biol. 2005;25(18):8108–8125. [DOI] [PMC free article] [PubMed] [Google Scholar]
- 8. Lin X, Feng X-H. Abrogation of transforming growth factor-β signaling in pancreatic cancer. World J Surg. 2005;29(3):312–316. [DOI] [PubMed] [Google Scholar]
- 9. Mu Y, Gudey SK, Landström M. Non-Smad signaling pathways. Cell Tissue Res. 2012;347:11–20. [DOI] [PubMed] [Google Scholar]
- 10. Jones S, Zhang X, Parsons DW, et al. Core signaling pathways in human pancreatic cancers revealed by global genomic analyses. Science. 2008;321(5897):1801–1806. [DOI] [PMC free article] [PubMed] [Google Scholar]
- 11. Kojima K, Vickers SM, Adsay NV, et al. Inactivation of Smad4 accelerates Kras(G12D)-mediated pancreatic neoplasia. Cancer Res. 2007;67(17):8121–8130. [DOI] [PubMed] [Google Scholar]
- 12. Bardeesy N, Cheng KH, Berger JH, et al. Smad4 is dispensable for normal pancreas development yet critical in progression and tumor biology of pancreas cancer. Genes Dev. 2006;20(22):3130–3146. [DOI] [PMC free article] [PubMed] [Google Scholar]
- 13. Ijichi H, Chytil A, Gorska AE, et al. Aggressive pancreatic ductal adenocarcinoma in mice caused by pancreas-specific blockade of transforming growth factor-β signaling in cooperation with active Kras expression. Genes Dev. 2006;20:3147–3160. [DOI] [PMC free article] [PubMed] [Google Scholar]
- 14. Grau AM, Zhang L, Wang W, et al. Induction of p21waf1 expression and growth inhibition by transforming growth factor β involve the tumor suppressor gene DPC4 in human pancreatic adenocarcinoma cells. Cancer Res. 1997;57:3929–3934. [PubMed] [Google Scholar]
- 15. Simeone DM, Pham T, Logsdon CD. Disruption of TGFβ signaling pathways in human pancreatic cancer cells. Ann Surg. 2000;232(1):73–80. [DOI] [PMC free article] [PubMed] [Google Scholar]
- 16. Peng B, Fleming JB, Breslin T, et al. Suppression of tumorigenesis and induction of p15ink4b by Smad4/DPC4 in human pancreatic cancer cells. Clin Cancer Res. 2002;8:3628–3638. [PubMed] [Google Scholar]
- 17. Zhao S, Ammanamanchi S, Brattain M, et al. Smad4-dependent TGF-β signaling suppresses RON receptor tyrosine kinase-dependent motility and invasion of pancreatic cancer cells. J Biol Chem. 2008;283(17):11293–11301. [DOI] [PMC free article] [PubMed] [Google Scholar]
- 18. Hunt KK, Fleming JB, Abramian A, Zhang L, Evans DB, Chiao PJ. Overexpression of the tumor suppressor gene Smad4/DPC4 induces p21 waf1 expression and growth inhibition in human carcinoma cells expression and growth inhibition in human carcinoma cells. Cancer Res. 1998;58:5656–5661. [PubMed] [Google Scholar]
- 19. Shen W, Tao GQ, Li DC, Zhu XG, Bai X, Cai B. Inhibition of pancreatic carcinoma cell growth in vitro by DPC4 gene transfection. World J Gastroenterol. 2008;14(40):6254–6260. [DOI] [PMC free article] [PubMed] [Google Scholar]
- 20. Yasutome M, Gunn J, Korc M. Restoration of Smad4 in BxPC3 pancreatic cancer cells attenuates proliferation without altering angiogenesis. Clin Exp Metastasis. 2005;22(6):461–473. [DOI] [PubMed] [Google Scholar]
- 21. Schwarte-Waldhoff I, Klein S, Blass-Kampmann S, et al. DPC4/SMAD4 mediated tumor suppression of colon carcinoma cells is associated with reduced urokinase expression. Oncogene. 1999;18(20):3152–3158. [DOI] [PubMed] [Google Scholar]
- 22. Duda DG, Sunamura M, Lefter LP, et al. Restoration of SMAD4 by gene therapy reverses the invasive phenotype in pancreatic adenocarcinoma cells. Oncogene. 2003;22(44):6857–6864. [DOI] [PubMed] [Google Scholar]
- 23. Jazag A, Ijichi H, Kanai F, et al. Smad4 silencing in pancreatic cancer cell lines using stable RNA interference and gene expression profiles induced by transforming growth factor-β. Oncogene. 2005;24(4):662–671. [DOI] [PubMed] [Google Scholar]
- 24. Chang Z, Li Z, Wang X, et al. Deciphering the mechanisms of tumorigenesis in human pancreatic ductal epithelial cells. Clin Cancer Res. 2013;19(3):549–559. [DOI] [PMC free article] [PubMed] [Google Scholar]
- 25. Bera A, Zhao S, Cao L, Chiao PJ, Freeman JW. Oncogenic K-ras and loss of smad4 mediate invasion by activating an EGFR/NF-κB axis that induces expression of MMP9 and uPA in human pancreas progenitor cells. PLoS One. 2013;8(12):e82282. [DOI] [PMC free article] [PubMed] [Google Scholar]
- 26. Meerbrey KL, Hu G, Kessler JD, et al. The pINDUCER lentiviral toolkit for inducible RNA interference in vitro and in vivo. Proc Natl Acad Sci USA. 2011;108(9):3665–3670. [DOI] [PMC free article] [PubMed] [Google Scholar]
- 27. Creighton CJ, Casa A, Lazard Z, et al. Insulin-like growth factor-I activates gene transcription programs strongly associated with poor breast cancer prognosis. J Clin Oncol. 2008;26(25):4078–4085. [DOI] [PMC free article] [PubMed] [Google Scholar]
- 28. Saldanha AJ. Java Treeview - Extensible visualization of microarray data. Bioinformatics. 2004;20(17):3246–3248. [DOI] [PubMed] [Google Scholar]
- 29. Tan MH, Nowak NJ, Loor R, et al. Characterization of a new primary human pancreatic tumor line. Cancer Invest. 1986;4(1):15–23. [DOI] [PubMed] [Google Scholar]
- 30. Schoumacher RA, Ram J, Iannuzzi MC, et al. A cystic fibrosis pancreatic adenocarcinoma cell line. Proc Natl Acad Sci USA. 1990;87:4012–4016. [DOI] [PMC free article] [PubMed] [Google Scholar]
- 31. Deer EL, González-Hernández J, Coursen JD, et al. Phenotype and genotype of pancreatic cancer cell lines. Pancreas. 2010;39(4):425–435. [DOI] [PMC free article] [PubMed] [Google Scholar]
- 32. Freund A, Laberge RM, Demaria M, Campisi J. Lamin B1 loss is a senescence-associated biomarker. Mol Biol Cell. 2012;23(11):2066–2075. [DOI] [PMC free article] [PubMed] [Google Scholar]
- 33. Reynisdóttir I, Polyak K, Iavarone A, Massagué J. Kip/Cip and Ink4 Cdk inhibitors cooperate to induce cell cycle arrest in response to TGF-β. Genes Dev. 1995;9(15):1831–1845. [DOI] [PubMed] [Google Scholar]
- 34. Senturk S, Mumcuoglu M, Gursoy-Yuzugullu O, et al. Transforming growth factor-beta induces senescence in hepatocellular carcinoma cells and inhibits tumor growth. Hepatology. 2010;52(3):966–974. [DOI] [PubMed] [Google Scholar]
- 35. Muñoz-Espín D, Cañamero M, Maraver A, et al. Programmed cell senescence during mammalian embryonic development. Cell. 2013;155(5):1104–1118. [DOI] [PubMed] [Google Scholar]
- 36. Storer M, Mas A, Robert-Moreno A, et al. Senescence is a developmental mechanism that contributes to embryonic growth and patterning. Cell. 2013;155(5):1119–1130. [DOI] [PubMed] [Google Scholar]
- 37. Rozenblum E, Schutte M, Goggins M, et al. Tumor-suppressive pathways in pancreatic carcinoma. Cancer Res. 1997;57(9):1731–1734. [PubMed] [Google Scholar]
- 38. Kretzschmar M, Doody J, Timokhina I, Massagué J. A mechanism of repression of TGFβ/Smad signaling by oncogenic Ras. Genes Dev. 1999;13(7):804–816. [DOI] [PMC free article] [PubMed] [Google Scholar]
- 39. Wilentz RE, Iacobuzio-Donahue CA, Argani P, et al. Loss of expression of Dpc4 in pancreatic intraepithelial neoplasia: evidence that DPC4 inactivation occurs late in neoplastic progression. Cancer Res. 2000;60(7):2002–2006. [PubMed] [Google Scholar]
- 40. Maitra A, Fukushima N, Takaori K, Hruban RH. Precursors to invasive pancreatic cancer. Adv Anat Pathol. 2005;12(2):81–91. [DOI] [PubMed] [Google Scholar]
- 41. Kanda M, Matthaei H, Wu J, et al. Presence of somatic mutations in most early-stage pancreatic intraepithelial neoplasia. Gastroenterology. 2012;142(4):730–733.e9. [DOI] [PMC free article] [PubMed] [Google Scholar]
- 42. Biankin AV, Waddell N, Kassahn KS, et al. Pancreatic cancer genomes reveal aberrations in axon guidance pathway genes. Nature. 2012;491(7424):399–405. [DOI] [PMC free article] [PubMed] [Google Scholar]
- 43. Maitra A, Hruban RH. Pancreatic cancer. Annu Rev Pathol. 2008;3(9791):157–188. [DOI] [PMC free article] [PubMed] [Google Scholar]
- 44. Reeves CV, Dufraine J, Young JA, Kitajewski J. Anthrax toxin receptor 2 is expressed in murine and tumor vasculature and functions in endothelial proliferation and morphogenesis. Oncogene. 2010;29(6):789–801. [DOI] [PMC free article] [PubMed] [Google Scholar]
- 45. Tischfield MA, Baris HN, Wu C, et al. Human TUBB3 mutations perturb microtubule dynamics, kinesin interactions, and axon guidance. Cell. 2010;140(1):74–87. [DOI] [PMC free article] [PubMed] [Google Scholar]
- 46. Kuscu C, Evensen N, Kim D, Hu Y-J, Zucker S, Cao J. Transcriptional and epigenetic regulation of KIAA1199 gene expression in human breast cancer. PLoS One. 2012;7(9):1–15. [DOI] [PMC free article] [PubMed] [Google Scholar]
- 47. Jami M-S, Hou J, Liu M, et al. Functional proteomic analysis reveals the involvement of KIAA1199 in breast cancer growth, motility and invasiveness. BMC Cancer. 2014;14(1):194. [DOI] [PMC free article] [PubMed] [Google Scholar]
- 48. Schmieder A, Multhoff G, Radons J. Interleukin-33 acts as a pro-inflammatory cytokine and modulates its receptor gene expression in highly metastatic human pancreatic carcinoma cells. Cytokine. 2012;60(2):514–521. [DOI] [PubMed] [Google Scholar]
- 49. Weiler M, Pfenning PN, Thiepold AL, et al. Suppression of proinvasive RGS4 by mTOR inhibition optimizes glioma treatment. Oncogene. 2013;32(9):1099–1109. [DOI] [PubMed] [Google Scholar]
- 50. Xie Y, Wolff DW, Wei T, et al. Breast cancer migration and invasion depend on proteasome degradation of regulator of G-protein signaling 4. Cancer Res. 2009;69(14):5743–5751. [DOI] [PMC free article] [PubMed] [Google Scholar]
- 51. Parker JB, Palchaudhuri S, Yin H, Wei J, Chakravarti D. A transcriptional regulatory role of the THAP11-HCF-1 complex in colon cancer cell function. Mol Cell Biol. 2012;32:1654–1670. [DOI] [PMC free article] [PubMed] [Google Scholar]