

Abstract
Background
The mammalian target of rapamycin (mTOR) functions within the phosphatidylinositol-3 kinase (PI3K)/Akt pathway as a critical modulator of cell survival. This clinical trial evaluated the combination of the mTOR inhibitor everolimus with conventional temozolomide (TMZ)-based chemoradiotherapy.
Methods
Newly diagnosed patients with glioblastoma multiforme were eligible for this single arm, phase II study. Everolimus (70 mg/wk) was started 1 week prior to radiation and TMZ, followed by adjuvant TMZ, and continued until disease progression. The primary endpoint was overall survival at 12 months, and secondary endpoints were toxicity and time to progression. Eleven patients were imaged with 3′-deoxy-3′-18F-fluorothymidine (18FLT)–PET/CT before and after the initial 2 doses of everolimus before initiating radiation/TMZ. Imaged patients with sufficient tumor samples also underwent immunohistochemical and focused exon sequencing analysis.
Results
This study accrued 100 evaluable patients. Fourteen percent of patients had grade 4 hematologic toxicities. Twelve percent had at least one grade 4 nonhematologic toxicity, and there was one treatment-related death. Overall survival at 12 months was 64% and median time to progression was 6.4 months. Of the patients who had 18FLT-PET data, 4/9 had a partial response after 2 doses of everolimus. Focused exon sequencing demonstrated that 18FLT-PET responders were less likely to have alterations within the PI3K/Akt/mTOR or tuberous sclerosis complex/neurofibromatosis type 1 pathway compared with nonresponders.
Conclusion
Combining everolimus with conventional chemoradiation had moderate toxicity. 18FLT-PET studies suggested an initial antiproliferative effect in a genetically distinct subset of tumors, but this did not translate into an appreciable survival benefit compared with historical controls treated with conventional therapy.
Keywords: everolimus, FLT-PET, glioblastoma, mTOR
Mammalian target of rapamycin (mTOR) signaling plays a critical role in both normal and tumor cell function, and inhibitors of mTOR have demonstrated promising activity in a number of malignancies.1,2 Mammalian target of rapamycin functions in 2 distinct multiprotein complexes defined by association either with Raptor (mTOR complex 1 [mTORC1]) or Rictor (mTORC2). The function of mTORC1 is to regulate cell size and growth in response to nutrient levels, while mTORC2 modulates both the cytoskeleton and Akt activation.3–5 In normal T-cell development, mTORC1 signaling critically mediates T-cell proliferation after cross-linking of the T-cell receptor.6 Consistent with this critical role in immune function, the natural product allosteric inhibitor of mTORC1 complex formation rapamycin was originally developed as an immunosuppressive agent, and both rapamycin (sirolimus) and the synthetic rapamycin analog (rapalog), everolimus (RAD001), are FDA approved for immunosuppression in the setting of solid-organ transplantation. In cancers, mTORC1 is significantly deregulated, and everolimus also is FDA approved for second-line therapy of metastatic breast, renal cell carcinoma, and pancreatic neuroendocrine tumors, and in subependymal giant cell astrocytoma in patients with tuberous sclerosis syndrome.7–9 Response to everolimus in the latter 2 tumor types is associated with specific genetic lesions within the mTOR pathway. Similarly, the mTORC1 signaling pathway is deregulated in the vast majority of glioblastoma multiforme (GBM), and there is significant interest in evaluating rapalog therapy for this disease.
Significant progress has been made in both preclinical and clinical evaluation of 2 different mTORC1 inhibitors (everolimus and temsirolimus) in GBM. Numerous in vitro and animal studies have demonstrated promising efficacy of rapalog monotherapy or combinations with radiotherapy (RT) and/or temozolomide (TMZ).10–13 Based upon these preclinical studies, the North Central Cancer Treatment Group (NCCTG) initially opened a phase II trial evaluating temsirolimus monotherapy in patients with recurrent GBM (N997B).14 While temsirolimus therapy was well tolerated and associated with radiographic improvement by T2/fluid-attenuated inversion recovery imaging in 36% of patients, treatment did not translate into significant clinical benefit. Given significant work supporting potential radio- or chemosensitizing effects of rapalogs, the NCCTG opened 2 phase I/II clinical trials evaluating either temsirolimus (N027D) or everolimus (N057K) integrated with standard TMZ and RT in newly diagnosed GBM patients. While temsirolimus therapy was associated with excessive infectious complications, the integration of everolimus with conventional TMZ-based chemoradiation was well tolerated in the phase I portion of the study in newly diagnosed GBM patients. Herein the results for the phase II N057K clinical trial are reported.
Robust molecular predictors of tumor response to everolimus therapy have remained elusive, and therefore we evaluated the potential for functional imaging to identify tumors with an initial antiproliferative response to everolimus. Proliferation-specific positron emission tomography (PET) relies on selective radiotracer uptake in proliferating cells. One of the more advanced proliferation-specific radiotracers is 3′-deoxy-3′-18F-fluorothymidine (18FLT). Cellular accumulation of this thymidine analog is dependent on thymidine kinase 1 (TK1) activity; TK1 expression is high in cells traversing S and G2 and low in G1.15,16 In untreated tumors, radiotracer accumulation of 18FLT measured by PET correlates with the proliferation index in a variety of tumor types, including high-grade gliomas.17–21 Furthermore, preclinical models have demonstrated significant reductions in FLT uptake following treatment with various drugs targeting the receptor tyrosine kinase/phosphatidylinositol-3 kinase (PI3K)/mTOR pathway.22 To facilitate functional evaluation of everolimus in the current trial, everolimus therapy was begun 1 week prior to TMZ/RT, and a subset of patients treated at Mayo Clinic were imaged with 18FLT-PET before and after an initial run-in with everolimus-only treatment. The results of this imaging substudy and corresponding molecular analysis of patient tumor samples are also presented herein.
Methods
This protocol was approved by the Mayo Clinic Institutional Review Board and the Cancer Therapy Evaluation Program of the National Cancer Institute. Written informed consent was obtained from each patient prior to enrollment. Patients were eligible if they were 18 years of age or older with an Eastern Cooperative Oncology Group performance status of 0–2 and had histologic confirmation of newly diagnosed World Health Organization grade IV astrocytoma. Gliosarcoma and other grade IV astrocytoma variants were included, although grade IV oligodendrogliomas or oligoastrocytomas were specifically excluded. Other exclusion criteria included concurrent use of strong cytochrome P450 3A4 inducers, concurrent warfarin use, and HIV or hepatitis B/C infection. Central pathology review was mandatory prior to registration. O6-methylguanine-DNA-methyltransferase (MGMT) promoter methylation status was assessed in all patients with sufficient tissue. Patients were registered between 1 and 6 weeks following surgical resection or biopsy, and must not have received any prior chemotherapy or radiation treatment.
The schema for the trial is outlined in Fig. 1. Everolimus was provided by Novartis and dosed at 70 mg orally once per week. Everolimus treatment began 1 week prior to radiation/TMZ therapy (days 1, 8), continued throughout adjuvant TMZ treatment, and then continued as adjuvant everolimus-only treatment until progression. Radiation therapy was delivered with either 3D conformal therapy or intensity modulated radiotherapy and consisted of 6000 cGy delivered in 30 daily fractions. Full details of the radiation technique have previously been described.23 TMZ was dosed at 75 mg/m2 by mouth, 7 days a week during RT. Radiation/TMZ therapy began between day 8 and day 15 of the first cycle. Adjuvant TMZ therapy began 4 weeks after completion of radiation and was dosed at 150–200 mg/m2 daily for 5 days every 28 days for 6 cycles. Antibiotic prophylaxis with either Bactrim alone or levofloxacin combined with either pentamidine or dapsone was required. Imaging with brain MRI was performed every other cycle of adjuvant TMZ treatment. When available, images were centrally reviewed by a neuroradiologist for tumor progression using Response Assessment in Neuro-Oncology criteria.24
Fig. 1.
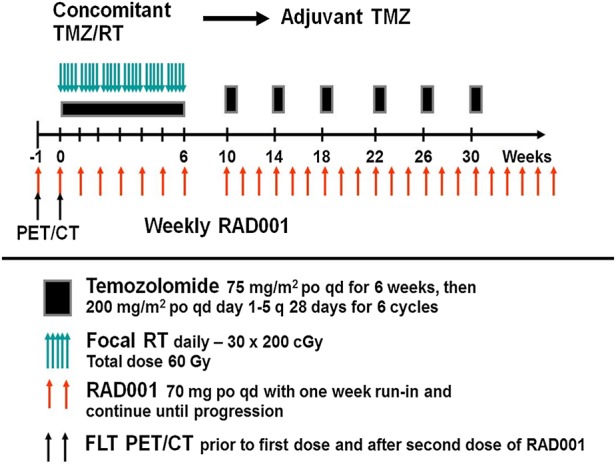
Protocol schema for N057K.
Patients treated at Mayo Clinic Rochester who had a minimum of 1 cm3 of residual tumor were enrolled in the functional imaging substudy. A baseline 18FLT-PET scan was obtained ≤7 days following registration, prior to the first dose of everolimus. Repeat 18FLT-PET imaging was performed between 2 and 24 h after the second dose of everolimus prior to the initiation of RT/TMZ. One hour prior to imaging, 10–20 mCi (370–740 MBq) of 18FLT was injected. Imaging was by a 3D PET/CT scan (Discovery RX, General Electric Healthcare) with five 2-min frames. Standardized uptake value (SUV) normalized for body weight was determined from a thresholded tumor volume using a program developed by our group (Volume Extractor). This program allowed for multiple slice tumor volume assessment. The functional metabolic tumor volume (MTV) was defined by a nuclear medicine radiologist and assessed separately by a radiation oncologist. SUVs as mean and maximum in the tumor volume were recorded and used for analysis of pre- and posttreatment comparisons for 18FLT. The ΔSUV% value for SUVmax and SUVmean was calculated using:
A 25% or greater reduction in the maximum tumor SUV was classified as a metabolic partial response adopted from European Organisation for Research and Treatment of Cancer criteria for 2-fluoro-2-deoxy-d-glucose imaging.25 Patients who received 18FLT-PET imaging had 2 blood draws performed at 24 ± 2 h after the first everolimus dose and at 0 to 24 h prior to the second dose of everolimus. Blood levels for everolimus were assayed using liquid chromatography–mass spectrometry at a facility licensed by the Clinical Laboratory Improvement Amendments (Clinical Reference Laboratory, Lenexa, Kansas). 18FLT-PET patients who had adequate tumor specimens also underwent immunohistochemical (IHC) analysis by a board-certified neuropathologist for phospho-AktS473, Ki67 (mouse intestinal bacteria 1), phosphatase and tensin homolog (PTEN), and phospho-S6RPS235/236 as described previously.26 Ki67 levels were quantified using automated morphometry. Other markers were scored for intensity (0 = no staining; 1 = low staining; 2 = medium staining; 3 = high staining relative to dynamic range of intensity staining in established controls) or for percentage of cells with positive staining (0 = no staining; 1 ≤ 10% of tumor cells; 2 = 11%–80%; 3 ≥ 80%). These same tissue samples were submitted to Seqwright Genomic Services (GE Healthcare) for focused exon sequencing of 201 gene targets generally implicated in cancer. A full list of sequenced genes can be found in Supplementary Table S1. DNA was purified using the QIAamp DNA FFPE Tissue Kit (Qiagen), and the resultant DNA was used to generate a Haloplex Custom Capture library (Agilent Technologies). Samples were sequenced on an Illumina HiSeq 2500 instrument using 2 × 100 bp sequencing reads. The sequences were aligned to hg19 as paired-end using the Burrows-Wheeler Aligner 0.7.5a program. Variants were detected using Genome Analysis Toolkit 2.4.9 (with default parameters) and annotated using SnpEff-3.3.
This study was a single-stage phase II design with one interim analysis for either futility or efficacy. The primary endpoint of this trial was overall survival at 12 months (OS12). Secondary endpoints were time to progression (TTP), overall survival (OS), progression-free survival (PFS), and adverse events. This study was powered based on a modified Simon's optimum 2-stage design for detecting a true OS12 probability of 73% with an overall significance level of 0.1 and power of 0.9. The planned sample size was 93 patients. Time to event was calculated from study entry until event or last known follow-up. Associations of categoric baseline, outcome, and translational data were tested using χ2 and Fisher's exact tests. Comparisons of continuous baseline, outcome, and translational data were tested using the Wilcoxon rank sum test. Survival and time-to-progression curves were compared via the log-rank test; Cox proportional hazards models were used to assess the relationship between time-to-event endpoints and baseline, outcome, and translational variables. All analyses were based on the study database frozen on April 4, 2014. Data collection and statistical analyses were conducted by the Alliance Statistics and Data Center. Data quality was ensured by review of data by the Alliance Statistics and Data Center and by the study chairperson following Alliance policies.
Results
A total of 104 patients were enrolled in the phase II portion of N057K between August 2009 and May 2012. Two patients voluntarily withdrew from protocol participation before therapy was initiated, one patient was found ineligible due to therapeutic warfarin use, and one patient had a major protocol violation due to incorrect everolimus usage, which left 100 evaluable patients. Of these evaluable patients, the median age was 61 years (range, 23–81; Supplementary Table S2). Nineteen patients were enrolled from Mayo Clinic Rochester, while 85 patients were enrolled from participating centers. Patient demographics were similar to those in prior NCCTG studies. An interim analysis performed on the first 35 patients demonstrated acceptable efficacy and toxicity to proceed toward full accrual.
Weekly therapy with 70 mg everolimus delivered continuously during and after conventional chemoradiotherapy was associated with moderate toxicity. Supplementary Fig. S1 summarizes the most frequent treatment-related toxicities observed on this trial. Twenty-five patients had at least one grade 3 or 4 hematologic adverse event, with the most common events being thrombocytopenia (18%) and neutropenia (16%). Grade 3 or 4 nonhematologic events were observed in 45 patients, and 21 patients had at least one grade 4 nonhematologic adverse event. The most common grades 3–4 nonhematologic events were fatigue (11%) and hypercholesterolemia (9%). Twenty-two patients terminated protocol drug therapy early because of an adverse event. One patient had a lethal grade 5 adverse event. This patient developed neutropenia during combination therapy and died of sepsis immediately after the end of radiation.
Combined everolimus/chemoradiotherapy was not associated with prolonged survival compared with historical controls. With a median follow-up of 17.5 months, patients enrolled on N057K had an OS12 of 64%, a median OS of 15.8 months (95% CI: 13.0, 20.3), and a median PFS of 6.4 months (95% CI: 5.4, 9.0) (Fig. 2A and B). All accruing centers were encouraged to send in images for central review. Central review was performed retrospectively by a single, experienced neuroradiologist (T.J.K.) who was blinded to clinical information other than steroid and chemotherapy use. Twenty-nine patients had images that were ultimately available for review. This was due to multiple factors, including study discontinuation due to adverse events, lack of baseline or follow-up scans, and incompatible image formats. Of these 29 patients, the accruing physician and central neuroradiologist agreed on the date of progression in 10/29 (35%) cases. In 11/29 (38%) cases, the central neuroradiologist called progression sooner than the accruing physician, while the central neuroradiologist called progression later in 8/29 (28%) cases.
Fig. 2.
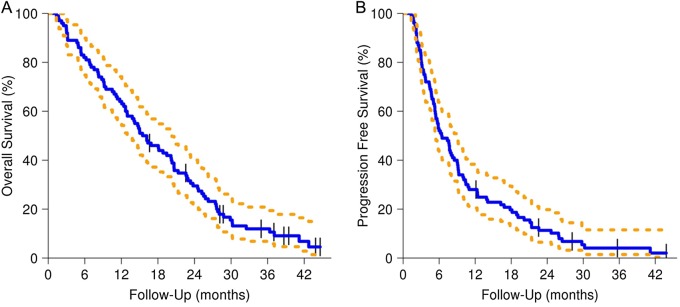
OS and PFS for N057K (dashed lines for 95% CIs).
Thirty-six patients had tissue available for MGMT promoter methylation analysis. MGMT hypermethylation was found in 9 of 36 (25%) tumor samples, and conversely, lack of MGMT methylation was found in 27 of 36 (75%) tumor samples. Median follow-up for the cohort of patients with completed MGMT analysis was 16.6 months. As anticipated, OS (Fig. 3A) and PFS (Fig. 3B) were both significantly longer in the MGMT hypermethylated group, with an OS12 of 89% for patients with hypermethylated tumors compared with 56% for those with unmethylated tumors. Given the well-documented role of MGMT status in TMZ sensitivity, we subsequently investigated possible biomarkers for sensitivity to mTOR inhibition. Mammalian target of rapamycin and its downstream target S6K1 are involved in regulating cell metabolism, and elevation of lipids is a common adverse effect that likely reflects the importance of mTORC1 function in lipid homeostasis. In the prior NCCTG trial with the mTOR inhibitor temsirolimus for monotherapy in recurrent GBM, patients developing grade 2 or higher hyperlipidemia (both cholesterol and triglyceride elevation) had a higher likelihood of antitumor activity compared with patients without lipid toxicities (71% vs 31%), leading to the postulate that metabolic toxicities could be a surrogate for robust mTOR inhibition. In the current N057K trial, 20 patients had grade 2 or higher hyperlipidemic events. While no difference in OS was found for these patients (Fig. 4A), patients with grades 2–4 hyperlipidemia had a longer PFS compared with those with grade 1 or milder hyperlipidemia (P = .015, hazard ratio = 0.54; Fig. 4B).
Fig. 3.
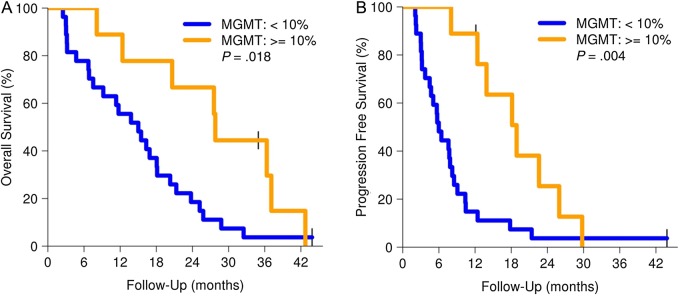
OS and PFS by MGMT status (dashed lines for 95% CIs).
Fig. 4.
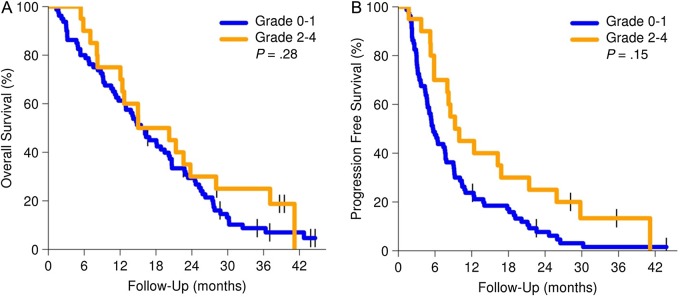
OS and PFS by hyperlipidemia status (dashed lines for 95% CIs).
Patients with measurable residual disease were enrolled on the imaging substudy at Mayo Clinic Rochester and underwent 18FLT-PET imaging prior to beginning therapy and after 2 doses of everolimus prior to beginning RT/TMZ. Of the 11 patients with pre-everolimus 18FLT imaging, 2 did not have a second 18FLT-PET scan performed due to technical difficulties with 18FLT production, leaving 9 patients who could be assessed for changes in 18FLT uptake. For each scan, 18FLT-PET metrics were measured in the residual tumor mass (SUVmax, SUVmean, and MTV; Table 1). The average SUVmean for the uninvolved brain was 0.24 compared with an average SUVmean for pre-everolimus tumor of 1.02, yielding an average tumor/brain SUVmean ratio of 4.3. Five patients were classified as nonresponders based upon a ΔSUVmax < −25% (−10%, −14%, −15%, 0%, and +12%, respectively) and had no change in their SUVmean values. An additional 4 patients were classified as having a metabolic partial response based upon changes in SUVmax >−25% (−42%, −27%, −28%, and −38, respectively). No statistically significant difference was seen in the mean blood concentrations of everolimus between responders versus nonresponders (33.6 vs 41.4 ng/mL at 24 h, P = .32; 4.2 vs 1.37 ng/mL just before the second everolimus dose, P = .69). Given the similarity in everolimus pharmacokinetics, we investigated whether differences in baseline tumor genetics or protein expression could explain these varying levels of everolimus sensitivity.
Table 1.
18FLT-PET and drug characteristics
| Patient # | MTV (cc) | ΔSUVmax | ΔSUVmean | Everolimus Peak | Everolimus Trough |
|---|---|---|---|---|---|
| 1 | 70.1 | −27% | −19% | 33.50 | 0.00 |
| 2 | 40.2 | −10% | 0% | 53.10 | 2.50 |
| 3 | 16 | −14% | 0% | 55.10 | 1.60 |
| 4 | 20 | −38% | −17% | 43.20 | 1.90 |
| 5 | 27.4 | −28% | −7% | 23.90 | 0.00 |
| 6 | 27.2 | −42% | −13% | 33.80 | 14.80 |
| 7 | 9.6 | −15% | 0% | 15.90 | 0.00 |
| 8 | 33.8 | – | – | – | – |
| 9 | 22.4 | 0% | 0% | – | – |
| 10 | 19.5 | – | – | – | – |
| 11 | 40.2 | 12% | 8% | – | – |
Drug level 1 is 24 h after the first everolimus dose. Drug level 2 is 1 h before the second everolimus dose (ng/mL).
Pretreatment tumor samples of sufficient size were available in 6 of 9 patients who were evaluated by 18FLT-PET. On IHC, 18FLT-PET responders had higher levels of PTEN expression and lower levels of pAkt and Ki67 expression in comparison with 18FLT-PET nonresponders. Among these 6 samples, focused exon sequencing found 1458 coding alterations in 454 genes compared with the reference genome. The tertiary analysis subsequently focused on detecting alterations within the PI3K/Akt/mTOR pathway (PTEN, PIK3CA, Akt, mTOR, Raptor/Rictor, S6) or within pathways previously implicated as possible biomarkers for mTOR therapy responsiveness (tuberous sclerosis complex [TSC]1/2, neurofibromatosis type 1, cyclin D1, fibroblast growth factor receptor 1/2).27–32 Only one 18FLT-PET responder had any genetic alterations within the PI3K/Akt/mTOR pathway, while all 18FLT-PET nonresponders had multiple alterations within the PI3K/Akt/mTOR pathway. Likewise, no 18FLT-PET responder had alterations within pathways implicated for mTOR responsiveness, while all of the nonresponders had at least one alteration within an mTOR-implicated pathway (Fig. 5). A full listing of genetic alterations within mTOR-implicated pathways can be found in Supplementary Table S3.
Fig. 5.

Heat map of sequencing (top left), IHC (middle left), and 18FLT-PET (bottom left) results for the 6 patients with PET and sequencing data. Top right panel demonstrates representative images from an 18FLT-PET responder (ΔSUVmax = −42%) vs nonresponder (ΔSUVmax = −14%). Bottom right panels demonstrate hematoxylin and eosin (H&E), PTEN, pAkt, pS6, and Ki67 staining for the 2 representative patients. Scale bar = 100 µm. CCND1, cyclin D1; FGFR, fibroblast growth factor receptor.
Discussion
N057K was designed to test the efficacy of the mTOR inhibitor everolimus in combination with TMZ and RT in prolonging patient survival. N057K did not meet our predetermined criterion for a successful survival endpoint (65% OS12) and had similar survival compared with historical phase II trials. For comparison, N0177 (chemoradiation ± erlotinib) had a median PFS and OS of 7.2 and 15.3 months, respectively (Supplementary Fig. S2).33 Weekly everolimus was also associated with moderate toxicity, with 57% of patients having at least one grade 3+ adverse event and 23% of patients having a grade 4 adverse event. These toxicity rates were also similar to previous prospective studies combining TMZ with everolimus.34–36 Though some patients demonstrated a robust metabolic response to initial therapy, these responses ultimately were not durable. The addition of weekly everolimus to standard chemoradiation is thus unlikely to provide benefit in newly diagnosed glioblastoma.
This study demonstrates the difficulty in assessing PFS in a large, multi-institutional trial with heterogeneous referring centers. Our goal for N057K was to have central imaging review confirm dates of progression as reported by referring centers. Ultimately, only 29 subjects had imaging that was amenable to central review. Among this population, the referring clinician and central neuroradiologist agreed on the date of progression in 35% of cases. Some of these differences might be due to clinical signs of progression detected by the clinician on physical exam. Furthermore, the clinician was required to prospectively determine progression, while the central neuroradiologist could retrospectively determine progression using all available images. Nevertheless, inter- and intraobserver variability in the measurement of gliomas is well documented.37,38 Measurement variability is further confounded through the heterogeneity of imaging equipment and software used by various institutions. For future glioma trials dependent upon PFS, issues such as electronic image transfer, prospective central imaging review, and adjudication for imaging disagreements must be thoroughly examined. Ultimately, these variability issues reflect limitations in current imaging technology. Advances in automated volumetric assessment and functional imaging may help address some of these issues.
The lack of survival benefit observed in this trial potentially could reflect pharmacokinetic aspects of the dosing schedule used. Everolimus crosses the blood–brain barrier in a nonlinear, dose-dependent manner, and prior preclinical data suggest that high, intermittent doses of everolimus are most likely to achieve biologically active doses within the CNS.39 Initial phase I clinical trials of everolimus evaluated both daily and weekly dosing schedules. Because everolimus is essentially an irreversible inhibitor of mTORC1, weekly dosing can suppress mTOR activity for up to 5 days. Based on these data, N057K was designed with weekly dosing in order to maximize CNS drug delivery. Nevertheless, daily everolimus dosing may have more sustained target inhibition, and the daily dosing regimen is the FDA-approved dosing schedule for solid tumors.40 The Radiation Therapy Oncology Group 0913 trial is currently testing daily dosing of everolimus with standard chemoradiation, with the phase I data demonstrating acceptable toxicity with the daily regimen.41 Thus, the results for the phase II portion of this trial may provide greater insight into potential differences in efficacy for daily versus weekly everolimus dosing schedules.
The lack of OS benefit in N057K parallels the survival experience seen in large, randomized clinical trials such as RECORD-1 (renal cell), RADIANT-3 (pancreatic neuroendocrine), and BOLERO-2 (breast).42–44 These survival data could reflect biological responses to mTOR inhibition. Though mTOR functions within 2 distinct complexes (mTORC1 and mTORC2), everolimus operates via the selective suppression of mTORC1 alone. Selective suppression of mTORC1 may lead to hyperactivation of Akt via inhibition of the mTORC1 negative feedback loop.45 This Akt elevation could eventually counteract the antiproliferative effects of mTORC1. Thus patients with initial responses to mTORC1 inhibition may grow resistant over time, limiting the drug's effect on OS. Strategies that inhibit multiple targets within the PI3K/mTOR pathway may be required for sustained efficacy.
Finally, N057K highlights the feasibility of integrating early functional imaging for evaluation of a signal transduction inhibitor in the context of combination therapy. An initial run-in of everolimus was designed to allow serial 18FLT-PET imaging before and after everolimus alone, prior to the initiation of concurrent cytotoxic therapy. Previous in vitro data suggest that PI3K catalytic alpha isoform (PI3KCA)/PTEN mutations might predict for sensitivity to mTOR inhibition, and the efficacy of everolimus in both subependymal giant cell astrocytoma and pancreatic neuroendocrine tumors has been linked to defects in the TSC/neurofibromatosis 1 pathway.46,47 Having both 18FLT-PET response data and focused exon sequencing in a subset of patients allowed us to test the hypothesis that alterations within these pathways predict for early response to everolimus therapy. 18FLT-PET successfully identified cohorts of patients who had robust early metabolic responses to mTOR inhibition alone. However, in contrast to the in vitro data, metabolic responders had robust PTEN expression, which confirms previous animal and clinical data suggesting that PTEN loss is insufficient for predicting mTOR sensitivity.48,49 Furthermore, 18FLT-PET responders were less likely to have alterations within PI3KCA/PTEN/TSC pathways, mirroring the genetic profile of patients who derived the most benefit from everolimus in BOLERO-2, a phase III randomized trial testing the use of everolimus and exemestane versus exemestane alone for advanced breast cancer patients.50 In BOLERO-2, subgroups of patients with minimal alterations in PI3KCA/PTEN/cyclin D1 and fibroblast growth factor receptor 1/2 derived the most benefit from everolimus. These data demonstrate how the integration of serial functional imaging with detailed molecular analyses in future trial designs can help expand our understanding of targeted therapies, even in the setting of a negative clinical trial.
Conclusion
The addition of everolimus to standard RT/TMZ had moderate toxicity compared with historical controls and did not improve OS. In a proof of concept substudy, serial 18FLT-PET imaging was feasible for evaluating early, drug-induced changes in tumor metabolism within GBM. The genetic profile of early everolimus responders mirrored the genetic profile of everolimus responders in other clinical trials.
Supplementary Material
Funding
This study was conducted as a collaborative trial of the North Central Cancer Treatment Group and Mayo Clinic and was supported in part by Public Health Service grants CA-25224, CA-37404, CA-35103, CA-35267, CTSA grant no. UL1 TR000135 from the National Center for Advancing Translational Sciences (NCATS), and Brain SPORE grant no. CA-108961 and CA-165962 from the National Cancer Institute, Department of Health and Human Services. The study was also supported, in part, by grants from the National Cancer Institute (CA31946) to the Alliance for Clinical Trials in Oncology (Monica M. Bertagnolli, MD, Chair) and to the Alliance Statistics and Data Center (Daniel J. Sargent, PhD, CA33601). This study was also supported by Novartis and presented at the ASCO 2012 Annual Meeting in Chicago, IL.
Conflict of interest statement. None declared.
Supplementary Material
References
- 1.Gingras AC, Raught B, Sonenberg N. Regulation of translation initiation by FRAP/mTOR. Genes Dev. 2001;15(7):807–826. [DOI] [PubMed] [Google Scholar]
- 2.Abraham RT. mTOR as a positive regulator of tumor cell responses to hypoxia. Curr Top Microbiol Immunol. 2004;279:299–319. [DOI] [PubMed] [Google Scholar]
- 3.Kim DH, Sarbassov DD, Ali SM, et al. mTOR interacts with raptor to form a nutrient-sensitive complex that signals to the cell growth machinery. Cell. 2002;110(2):163–175. [DOI] [PubMed] [Google Scholar]
- 4.Sarbassov DD, Ali SM, Kim DH, et al. Rictor, a novel binding partner of mTOR, defines a rapamycin-insensitive and raptor-independent pathway that regulates the cytoskeleton. Curr Biol. 2004;14(14):1296–1302. [DOI] [PubMed] [Google Scholar]
- 5.Sarbassov DD, Guertin DA, Ali SM, et al. Phosphorylation and regulation of Akt/PKB by the rictor-mTOR complex. Science. 2005;307(5712):1098–1101. [DOI] [PubMed] [Google Scholar]
- 6.Zeng H, Yang K, Cloer C, et al. mTORC1 couples immune signals and metabolic programming to establish T(reg)-cell function. Nature. 2013;499(7459):485–490. [DOI] [PMC free article] [PubMed] [Google Scholar]
- 7.Baselga J, Campone M, Piccart M, et al. Everolimus in postmenopausal hormone-receptor-positive advanced breast cancer. N Engl J Med. 2012;366(6):520–529. [DOI] [PMC free article] [PubMed] [Google Scholar]
- 8.Dabney R, Devine R, Sein N, George B. New agents in renal cell carcinoma. Target Oncol. 2014;9(3):183–193. [DOI] [PubMed] [Google Scholar]
- 9.Krueger DA. Management of CNS-related disease manifestations in patients with tuberous sclerosis complex. Curr Treat Options Neurol. 2013;15(5):618–633. [DOI] [PubMed] [Google Scholar]
- 10.Eshleman JS, Carlson BL, Mladek AC, et al. Inhibition of the mammalian target of rapamycin sensitizes U87 xenografts to fractionated radiation therapy. Cancer Res. 2002;62(24):7291–7297. [PubMed] [Google Scholar]
- 11.Rao RD, Mladek AC, Lamont JD, et al. Disruption of parallel and converging signaling pathways contributes to the synergistic antitumor effects of simultaneous mTOR and EGFR inhibition in GBM cells. Neoplasia. 2005;7(10):921–929. [DOI] [PMC free article] [PubMed] [Google Scholar]
- 12.Jaboin JJ, Shinohara ET, Moretti L, et al. The role of mTOR inhibition in augmenting radiation induced autophagy. Technol Cancer Res Treat. 2007;6(5):443–447. [DOI] [PubMed] [Google Scholar]
- 13.El Habr EA, Adamopoulos C, Levidou G, et al. The clinical and prognostic significance of activated Akt-mTOR pathway in human astrocytomas. Neurol Res Int. 2012;2012:454957. [DOI] [PMC free article] [PubMed] [Google Scholar]
- 14.Galanis E, Buckner JC, Maurer MJ, et al. Phase II trial of temsirolimus (CCI-779) in recurrent glioblastoma multiforme: a North Central Cancer Treatment Group study. J Clin Oncol. 2005;23(23):5294–5304. [DOI] [PubMed] [Google Scholar]
- 15.Rasey JS, Grierson JR, Wiens LW, et al. Validation of FLT uptake as a measure of thymidine kinase-1 activity in A549 carcinoma cells. J Nucl Med. 2002;43(9):1210–1217. [PubMed] [Google Scholar]
- 16.Toyohara J, Waki A, Takamatsu S, et al. Basis of FLT as a cell proliferation marker: comparative uptake studies with [3H]thymidine and [3H]arabinothymidine, and cell-analysis in 22 asynchronously growing tumor cell lines. Nucl Med Biol. 2002;29(3):281–287. [DOI] [PubMed] [Google Scholar]
- 17.Waldherr C, Mellinghoff IK, Tran C, et al. Monitoring antiproliferative responses to kinase inhibitor therapy in mice with 3′-deoxy-3′-18F-fluorothymidine PET. J Nucl Med. 2005;46(1):114–120. [PubMed] [Google Scholar]
- 18.Grosu AL, Weber WA. PET for radiation treatment planning of brain tumours. Radiother Oncol. 2010;96(3):325–327. [DOI] [PubMed] [Google Scholar]
- 19.Hong IK, Kim JH, Ra YS, et al. Diagnostic usefulness of 3′-deoxy-3′-[18F]fluorothymidine positron emission tomography in recurrent brain tumor. J Comput Assist Tomogr. 2011;35(6):679–684. [DOI] [PubMed] [Google Scholar]
- 20.Rueger MA, Ameli M, Li H, et al. [18F]FLT PET for non-invasive monitoring of early response to gene therapy in experimental gliomas. Mol Imaging Biol. 2011;13(3):547–557. [DOI] [PubMed] [Google Scholar]
- 21.Schwarzenberg J, Czernin J, Cloughesy TF, et al. 3′-Deoxy-3′-18F-fluorothymidine PET and MRI for early survival predictions in patients with recurrent malignant glioma treated with bevacizumab. J Nucl Med. 2012;53(1):29–36. [DOI] [PMC free article] [PubMed] [Google Scholar]
- 22.Aide N, Kinross K, Cullinane C, et al. 18F-FLT PET as a surrogate marker of drug efficacy during mTOR inhibition by everolimus in a preclinical cisplatin-resistant ovarian tumor model. J Nucl Med. 2010;51(10):1559–1564. [DOI] [PubMed] [Google Scholar]
- 23.Sarkaria JN, Galanis E, Wu W, et al. North Central Cancer Treatment Group phase I trial N057 K of everolimus (RAD001) and temozolomide in combination with radiation therapy in patients with newly diagnosed glioblastoma multiforme. Int J Radiat Oncol Biol Phys. 2011;81(2):468–475. [DOI] [PMC free article] [PubMed] [Google Scholar]
- 24.Wen PY, Macdonald DR, Reardon DA, et al. Updated response assessment criteria for high-grade gliomas: Response Assessment in Neuro-Oncology working group. J Clin Oncol. 2010;28(11):1963–1972. [DOI] [PubMed] [Google Scholar]
- 25.Barwick T, Bencherif B, Mountz JM, et al. Molecular PET and PET/CT imaging of tumour cell proliferation using F-18 fluoro-L-thymidine: a comprehensive evaluation. Nucl Med Commun. 2009;30(12):908–917. [DOI] [PubMed] [Google Scholar]
- 26.Gruber Filbin M, Dabral SK, Pazyra-Murphy MF, et al. Coordinate activation of Shh and PI3 K signaling in PTEN-deficient glioblastoma: new therapeutic opportunities. Nat Med. 2013;19(11):1518–1523. [DOI] [PMC free article] [PubMed] [Google Scholar]
- 27.Tee AR, Manning BD, Roux PP, et al. Tuberous sclerosis complex gene products, tuberin and hamartin, control mTOR signaling by acting as a GTPase-activating protein complex toward Rheb. Curr Biol. 2003;13(15):1259–1268. [DOI] [PubMed] [Google Scholar]
- 28.Choo AY, Blenis J. TORgeting oncogene addiction for cancer therapy. Cancer Cell. 2006;9(2):77–79. [DOI] [PubMed] [Google Scholar]
- 29.Banerjee S, Crouse NR, Emnett RJ, et al. Neurofibromatosis-1 regulates mTOR-mediated astrocyte growth and glioma formation in a TSC/Rheb-independent manner. Proc Natl Acad Sci U S A. 2011;108(38):15996–16001. [DOI] [PMC free article] [PubMed] [Google Scholar]
- 30.Franz DN, Weiss BD. Molecular therapies for tuberous sclerosis and neurofibromatosis. Curr Neurol Neurosci Rep. 2012;12(3):294–301. [DOI] [PubMed] [Google Scholar]
- 31.McCubrey JA, Steelman LS, Chappell WH, et al. Mutations and deregulation of Ras/Raf/MEK/ERK and PI3K/PTEN/Akt/mTOR cascades which alter therapy response. Oncotarget. 2012;3(9):954–987. [DOI] [PMC free article] [PubMed] [Google Scholar]
- 32.Franz DN. Everolimus in the treatment of subependymal giant cell astrocytomas, angiomyolipomas, and pulmonary and skin lesions associated with tuberous sclerosis complex. Biologics. 2013;7:211–221. [DOI] [PMC free article] [PubMed] [Google Scholar]
- 33.Brown PD, Krishnan S, Sarkaria JN, et al. Phase I/II trial of erlotinib and temozolomide with radiation therapy in the treatment of newly diagnosed glioblastoma multiforme: North Central Cancer Treatment Group study N0177. J Clin Oncol. 2008;26(34):5603–5609. [DOI] [PMC free article] [PubMed] [Google Scholar]
- 34.Mason WP, Macneil M, Kavan P, et al. A phase I study of temozolomide and everolimus (RAD001) in patients with newly diagnosed and progressive glioblastoma either receiving or not receiving enzyme-inducing anticonvulsants: an NCIC CTG study. Invest New Drugs. 2012;30(6):2344–2351. [DOI] [PubMed] [Google Scholar]
- 35.Chan JA, Blaszkowsky L, Stuart K, et al. A prospective, phase 1/2 study of everolimus and temozolomide in patients with advanced pancreatic neuroendocrine tumor. Cancer. 2013;119(17):3212–3218. [DOI] [PMC free article] [PubMed] [Google Scholar]
- 36.Dronca RS, Allred JB, Perez DG, et al. Phase II study of temozolomide (TMZ) and everolimus (RAD001) therapy for metastatic melanoma: a North Central Cancer Treatment Group study, N0675. Am J Clin Oncol. 2014;37(4):369–376. [DOI] [PMC free article] [PubMed] [Google Scholar]
- 37.Bauknecht HC, Romano VC, Rogalla P, et al. Intra- and interobserver variability of linear and volumetric measurements of brain metastases using contrast-enhanced magnetic resonance imaging. Invest Radiol. 2010;45(1):49–56. [DOI] [PubMed] [Google Scholar]
- 38.Provenzale JM, Mancini MC. Assessment of intra-observer variability in measurement of high-grade brain tumors. J Neurooncol. 2012;108(3):477–483. [DOI] [PubMed] [Google Scholar]
- 39.O'Reilly T, McSheehy PM, Kawai R, et al. Comparative pharmacokinetics of RAD001 (everolimus) in normal and tumor-bearing rodents. Cancer Chemother Pharmacol. 2010;65(4):625–639. [DOI] [PubMed] [Google Scholar]
- 40.Tanaka K, Sasayama T, Mizukawa K, et al. Specific mTOR inhibitor rapamycin enhances cytotoxicity induced by alkylating agent 1-(4-amino-2-methyl-5-pyrimidinyl)methyl-3-(2-chloroethyl)-3-nitrosourea (ACNU) in human U251 malignant glioma cells. J Neurooncol. 2007;84(3):233–244. [DOI] [PubMed] [Google Scholar]
- 41.Chinnaiyan P, Won M, Wen PY, et al. RTOG 0913: a phase 1 study of daily everolimus (RAD001) in combination with radiation therapy and temozolomide in patients with newly diagnosed glioblastoma. Int J Radiat Oncol Biol Phys. 2013;86(5):880–884. [DOI] [PMC free article] [PubMed] [Google Scholar]
- 42.Motzer RJ, Escudier B, Oudard S, et al. Phase 3 trial of everolimus for metastatic renal cell carcinoma: final results and analysis of prognostic factors. Cancer. 2010;116(18):4256–4265. [DOI] [PubMed] [Google Scholar]
- 43.Yao JC, Shah MH, Ito T, et al. Everolimus for advanced pancreatic neuroendocrine tumors. N Engl J Med. 2011;364(6):514–523. [DOI] [PMC free article] [PubMed] [Google Scholar]
- 44.Piccart-Gebhart M, Noguchi S, Pritchard KI, et al. Everolimus plus exemestane for hormone receptor-positive (HR+), human epidermal growth factor receptor-2–negative (HER2–) advanced breast cancer (BC): overall survival results from BOLERO-2. Ninth European Breast Cancer Conference Glasgow, Scotland, 2014. [DOI] [PMC free article] [PubMed] [Google Scholar]
- 45.Feldman ME, Apsel B, Uotila A, et al. Active-site inhibitors of mTOR target rapamycin-resistant outputs of mTORC1 and mTORC2. PLoS Biol. 2009;7(2):e38. [DOI] [PMC free article] [PubMed] [Google Scholar]
- 46.Meric-Bernstam F, Akcakanat A, Chen H, et al. PIK3CA/PTEN mutations and Akt activation as markers of sensitivity to allosteric mTOR inhibitors. Clin Cancer Res. 2012;18(6):1777–1789. [DOI] [PMC free article] [PubMed] [Google Scholar]
- 47.Yao JC, Phan AT, Jehl V, et al. Everolimus in advanced pancreatic neuroendocrine tumors: the clinical experience. Cancer Res. 2013;73(5):1449–1453. [DOI] [PubMed] [Google Scholar]
- 48.Yang L, Clarke MJ, Carlson BL, et al. PTEN loss does not predict for response to RAD001 (everolimus) in a glioblastoma orthotopic xenograft test panel. Clin Cancer Res. 2008;14(12):3993–4001. [DOI] [PMC free article] [PubMed] [Google Scholar]
- 49.Janku F, Broaddus R, Bakkar R, et al. PTEN assessment and PI3K/mTOR inhibitors: importance of simultaneous assessment of MAPK pathway aberrations. ASCO Annual Meeting Chicago, IL, 2012. [Google Scholar]
- 50.Hortobagyi G, Piccart-Gebhart M, Rugo H, et al. Correlation of molecular alterations with efficacy of everolimus in hormone receptor–positive, HER2-negative advanced breast cancer: results from BOLERO-2. ASCO Annual Meeting Chicago, IL, 2013. [Google Scholar]
Associated Data
This section collects any data citations, data availability statements, or supplementary materials included in this article.