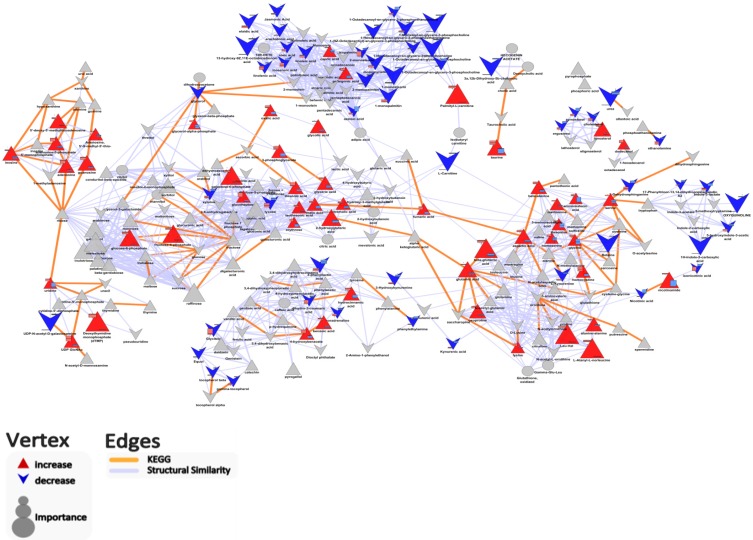
Figure 4.
Biochemical and chemical similarity network highlighting important differences in metabolites abundance between colonic-cecal content and feces. Vertex size encodes the fold change in metabolite abundance between groups (when the metabolite abundance in colonic-cecal content was higher than that in feces, we defined it as “increase”; in contrast, if the metabolite abundance in colonic-cecal content was lower than that in feces, we defined it as “decrease”). Vertex shape (triangle, increase; “V”, decrease; ellipse, no change) and color (blue, decrease; red, increase; gray, insignificant change or p > 0.05 after-adjustment for FDR) are used to encode the significance and relative direction of changes in metabolites between colonic-cecal content and feces comparison.

