

Abstract
Tumor-infiltrating lymphocytes (TILs) play an important role in regulating the host immune response and are one of key factors in defining tumor microenvironment. Some studies have indicated that T cell infiltration in malignant ascites is associated with clinical outcome, but few studies have performed detailed characterization of T cell diversity or clonality in malignant effusions. We have applied a next generation sequencing method to characterize T cell repertoire of a set of primary cancers, ascites, and blood from 12 ovarian cancer patients and also analyzed the T cell subtype populations in malignant fluids from 3 ovarian cancer patients. We observed enrichment of certain T cells in tumors and ascites, but most of the enriched T cell receptor (TCR) sequences in tumors and ascites were not common. Moreover, we analyzed TCR sequences of T cell subtypes (CD4+, CD8+, and regulatory T cells) isolated from malignant effusions and also found clonal expansion of certain T cell populations, but the TCR sequences were almost mutually exclusive among the three subgroups. Although functional studies of clonally expanded T cell populations are definitely required, our approach offers a detailed characterization of T cell immune microenvironment in tumors and ascites that might differently affect antitumor immune response.
Keywords: malignant ascites, next generation sequencing, ovarian cancer, T cell receptor, tumor immunity
Abbreviations
- CDR3
complementarity determining region 3
- HLA
human leucocyte antigen
- MHC
major histocompatibility complex
- NGS
next generation sequencing
- PBMCs
peripheral blood mononuclear cells
- TCR
T cell receptor
- TIL
tumor-infiltrating T lymphocyte
- TRA
T cell receptor α
- TRB
T cell receptor β.
Introduction
Ovarian cancer affects nearly 22,000 women each year and is the fifth most common cause of cancer death among women in the United States in 2010.1 The majority of the ovarian cancer cases are diagnosed at advanced stages (III, IV), and the 5‐year survival rate is very poor, ranging from 19% to 47%.2
Ovarian cancer is frequently associated with malignant effusions such as ascites at initial presentation; 38% of female patients with malignant ascites are found to have ovarian cancer.3 Studies have demonstrated that the immune microenvironment of the ascites in patients with ovarian cancer varies significantly with some specimens containing a very high number of T cells.4-6 In addition, one report indicated that a higher CD8+/CD4+ ratio in ascites was correlated with better prognosis for ovarian cancer patients.7 However, no study has characterized the functionality or clonality of T cell subtype populations in malignant ascites.
Malignant ascites could be a useful resource for examining the immune milieu in ovarian cancer because it consists of cancer cells, neutrophils, antigen presenting cells, and lymphocytes that might originate from tumor tissues, and also includes various cytokines released from these cells. This immune environment works to either suppress or promote cancer cell growth through various mechanisms.7-10 For example, TILs are often observed in many types of solid tumors; in some cases they are considered to reflect the host immune system that responds to and eliminates the tumor cells. In fact, higher TIL infiltration has been reported to correlate with better prognosis in many tumor types,11-15 including ovarian cancer for which a high degree of intratumoral CD8+ T cell was correlated with better clinical response to platinum agents.16 However, in some cases they may protect cancer cells from the host immune system. The presence of a higher number of regulatory T cells, which suppress tumor‐specific T cell immunity, was shown to be correlated with poor prognosis in ovarian cancer patients.17
TCRs are expressed on the surface of T lymphocytes and 95% of T cells possess TCRs consisting of a heterodimer of α and β chains. The TCR-α gene (TRA) is composed of 115 variable (V) alleles, 68 joining (J) alleles and one constant (C) allele, while the TCR-β gene (TRB) has nearly 146 V, 3 diversity (D), 16 J, and 4 C alleles.18-21 In addition to a large number of combinations of VJ for an α chain and VDJ for a β chain, a huge functional diversity of TCRs is generated by insertion and/or deletion of nucleotides during the somatic V(D)J recombination. This rearrangement of V, (D), and J segments generates the highly variable complementarity determining region 3 (CDR3), which is responsible for recognizing an antigen on human leucocyte antigen (HLA) molecules. With the development in the next generation sequencing (NGS) technologies, it has become possible to characterize millions of TCR sequences.22 TCR sequencing is an effective approach to examine antigen specific expansion of T‐cell subclones which could be prognostically significant. Moreover, TCR sequencing provides us TCR information that can be directly applied to adoptive T‐cell transfer therapy or used for screening specific immunogenic epitopes for cancer vaccine development.
In this study, we examined the T cell repertoire in a set of tumor, malignant ascites and blood from 12 ovarian cancer patients as well as T cell subpopulations in malignant fluids from 3 ovarian cancer patients using the NGS technology. We here report huge differences in T cell repertoire between TILs in tumor tissues and T cells in ascites, and demonstrate exclusive TCR patterns in CD4+, CD8+, and regulatory T cell subpopulations in malignant effusions.
Results
Clonal T cell expansion in tumors or ascites
To compare T cell repertoire in tumor, ascites, and blood from 12 ovarian cancer patients, we isolated RNA from these samples, and PCR-amplified and sequenced TCR-α and TCR-β cDNA using Ion Torrent PGM sequencers. On average, we obtained a total sequence reads of 203,740 and 690,920 for TCR-α and TCR-β in tumor tissues, and 184,097 and 683,746 in ascites, respectively, using 314v2 chips. From blood samples, 806,460 for TCR-α and 4,323,807 for TCR-β sequence reads were acquired using 318v2 chips. We then quantitatively analyzed the frequency of the distinct V(D)J combinations and unique CDR3 clonotypes. We sorted out CDR3 sequences according to their frequency. Fig. 1A shows the frequency of each of the V(D)J-CDR3 unique clonotypes observed in tumor tissues and ascites, indicating very strong enrichment of certain T cell clones in some patients. The sum of the frequencies of the ten most abundant CDR3s in the 12 tumors ranged from 24.9% to 76.4% (mean = 49.3 ± 5.5%, SEM (standard error of the mean)) and from 14.8% to 89.4% (mean = 52.0 ± 6.7%, SEM) for TCR-α and TCR-β, respectively. In ascites, the sum of the frequencies of the 10 most abundant CDR3 ranged from 13.4% to 85.7% (mean = 56.0 ± 6.8%, SEM) and from 21.7% to 91.9% (mean = 57.6 ± 7.2%, SEM) for TCR-α and TCR-β, respectively. In the tumor tissues of two cases (P126 and P155), more than half of TCR-α and TCR-β clonotypes were derived from two to seven expanded T cell clones. In three ascites cases (P106, P157, and P168), the frequency of three major clones of TCR-α and TCR-β accounted for more than half of total reads.
Figure 1.

The clonality of T lymphocytes in tumor, ascites, and blood of 12 ovarian cancer patients. (A) The distribution of the unique CDR3 sequences detected in TCR-α (TRA) and TCR-β (TRB). Each pie graph was colored automatically by the Excel program according to frequency ranks and therefore the same color dose not represent an identical CDR3 sequence. Gray color indicates portion of clonotypes less than 1% frequency. (B) The diversity indexs for TCR-α and TCR-β were calculated by the inverse Simpson's index (1/Ds) formulation.
To compare the TCR diversity among the 12 samples, we calculated the inverse Simpson's diversity index (1/Ds); values are high when TCR clones are evenly distributed and low with very-enriched T cell clones. In most patients, the diversity indexes were quite low for both TCR-α and TCR-β in both tumor and ascites (Fig. 1B). We also observed low diversity in blood for some cases. It has been already shown that the diversity gets smaller when one had viral or bacterial infection, or when one became older.23-25 Hence, we examined correlation between the TCR diversity in blood and the age of patients, but found no significant correlation between them (Fig. S1). However, the number of the patients examined was too small to make a conclusion.
Distinct T cell profiles in tumor and ascites
To examine the similarity or difference in enriched T cell clones between tumor and ascites, we examined the commonality of the 20 most abundant CDR3s as shown in Fig. 2A. The abundant CDR3 sequences were very different between TILs in tumors and T lymphocytes in ascites, and only a few clonotypes were commonly observed in almost all of the cases. We also examined the proportions of common CDR3s between TILs in tumors and T lymphocytes in ascites (Fig. 2B). In 10 of the 12 patients, fewer than 20% of TCR-α CDR3 sequences were common between tumors and ascites, and those of TCR-β CDR3 sequences were common in 11 patients as indicated in the upper graph. Particularly, in three patients, P106, P139, and P157, less than 1% of either TCR-α or TCR-β CDR3 sequences were common between tumors and ascites. Our data clearly indicate that the immune environment of tumors and ascites was enormously different.
Figure 2.

Comparison of T cell repertoires in tumor tissues and ascites. (A) Heatmaps show frequencies of 20 dominant TCR clonotypes selected from tumor tisseus (T) and ascites (A). The vertical axis indicates each of unique CDR3 sequences. Common CDR3s are presented only once. The scale bar represents their frequency. CDR3 sequences with more than 10% of frequency were presented with the squares of red color and indicated by * (10% ˜ 30%), # (30% ˜ 50%), and ++ (more than 50%). (B) The proportion of common CDR3 between tumor tissues and ascites is graphed.
Expression levels of CD4, CD8, FOXP3 genes in tumor and ascites
The ratios of CD4, CD8, and FOXP3 expression levels are known to be correlated with the clinical outcome in some tumor types.26,27 To characterize T cell subtypes of TILs in tumors and T lymphocytes in ascites, we examined the mRNA expression levels of CD4, CD8, and FOXP3 with a real-time PCR method. In tumors, the CD8+/CD4+ ratios were 0.46 ∼ 2.28 (mean = 0.90 ± 0.04, SEM), while in ascites the CD8+/CD4+ ratios were 0.50 ∼ 49.09 (mean = 7.06 ± 1.12, SEM) (Fig. 3). Specially, CD8 in ascites of P155 was detected 49-fold higher than CD4. The FOXP3/CD4 ratios were 0.07 ∼ 0.44 (mean = 0.21 ± 0.01, SEM) and 0.005 ∼ 3.96 (mean = 0.44 ± 0.09, SEM) for tumor and ascites, respectively.
Figure 3.
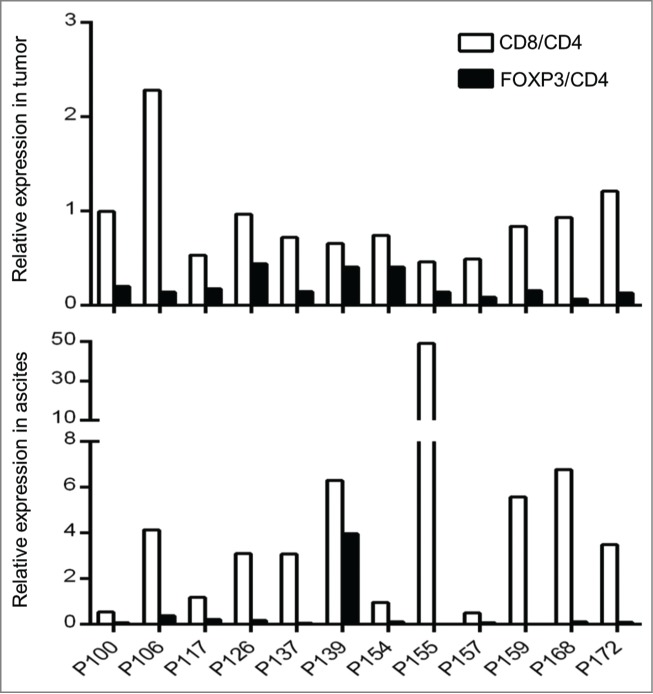
Expression of CD8 and FOXP3 in tumor tisseus and ascites. Expression raitos of CD8/CD4 and FOXP3/CD4 in 12 ovarican cancer patients are presented. Quantity of each transcript was analyzed by real-time PCR and normalized by an internal control, GAPDH.
The TCR analysis of T cell subtype populations in malignant effusion
To further characterize three subtypes of T lymphocytes that are likely to play different roles in the tumor microenvironment,17,28,29 particularly in malignant effusions, we sorted out T cells in pleural effusion or ascites of three patients using flow cytometry (Fig. 4A) and examined TCR sequences in each of CD4+, CD8+, and CD4+CD25+ populations (Fig. 4B) (CD4+ population included CD4+CD25+ cell population). The proportions of lymphocytes in living cells in malignant effusions varied significantly as 5.0%, 13.5%, and 28.7%. The proportions of CD4+ T lymphocytes among the lymphocyte populations were similar with a range of 52.2 ˜ 60.0%, but those of CD8+ T lymphocytes and CD4+CD25+ T lymphocytes were different among the three patients; 11.9, 16.2, and 21.7% for CD8+ and 4.8, 7.1, and 14.1% for CD4+CD25+, respectively. As a control, we also sequenced TCR cDNAs of T lymphocytes isolated from blood of these three patients. We subsequently examined the clonality of T cells in each subtype as shown in Fig. 5. We observed strong clonal T cell expansion in CD8+ and CD4+CD25+ subpopulations in all three patients. These results revealed that certain subtypes of T cell clones were expanded and their difference in the diversities might define the immune microenvironment in malignant effusions.
Figure 4.

Isolation of T cell subpopulations from malignant effusions. (A) The lymphocytes were gated from live cells collected from malignant effusion in P201 by flow cytometry. Three different T cell subtypes were sorted using a combination of fluorescent-conjugated monoclonal antibodies for CD3+, CD4+, CD8+, and CD25+, as indicated on X- and Y-axes. (B) The proportion of T cell subtypes in malignant effusions from three ovarian cancer patients, P201, P202, and P203.
Figure 5.
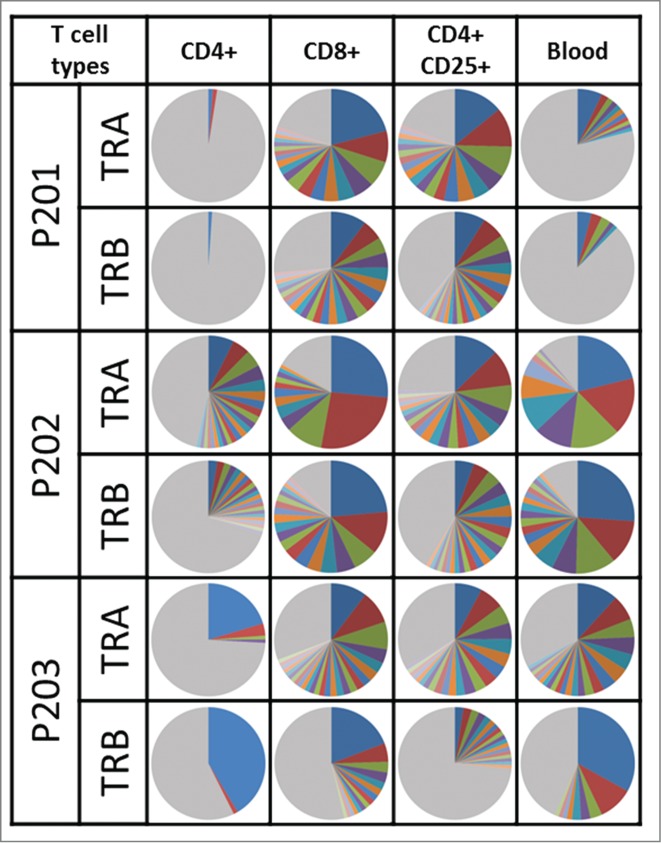
The TCR clonality in subpopulations of T cells. The pie charts illustrate distribution of unique CDR3 sequences detected in TRA and TRB. The same color between pie charts does not represent a same CDR3 sequence. Gray color indicates portion of clonotypes less than 1% frequency.
Distinct TCR clonotypes among T cell subtypes
We further examined TCR similarity or difference in the subtypes of T cells. When we examined the most common 20 CDR3 sequences selected for each of the three subpopulations (Fig. 6), the TCR sequences in CD4+, CD8+, and CD4+CD25+ cells were found to be almost mutually exclusive although some overlap was observed between CD4+ and CD4+CD25+ cells because CD4+ population contained CD4+CD25+ cells. However, exceptionally we found that the most abundant TCR-α and TCR-β sequences for CD4+ and CD8+ subgroups were identical in P203.
Figure 6.
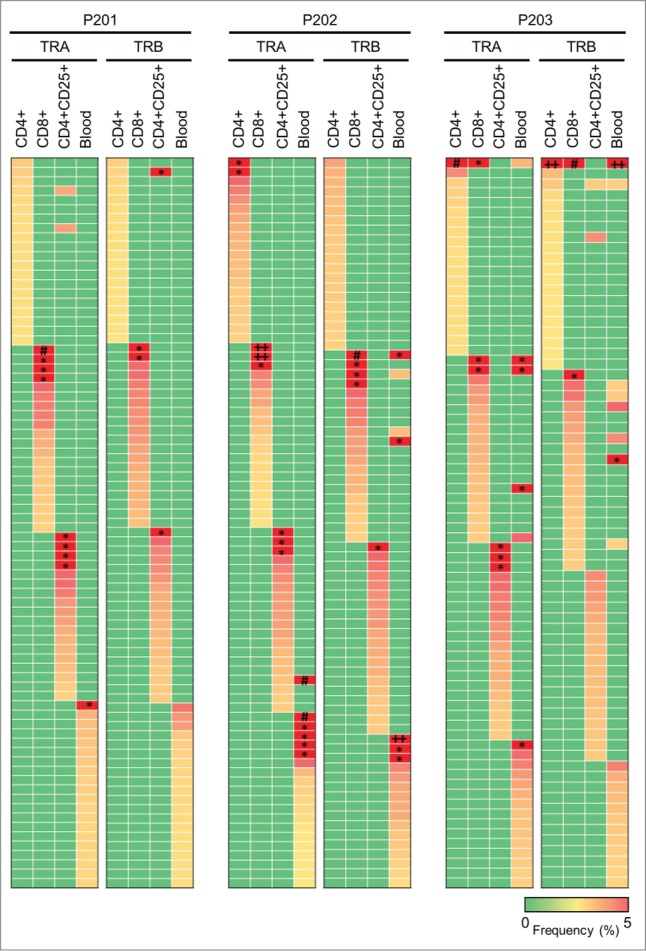
Characteristics of TCR repertoires in different T cell subtypes. Heatmaps show frequencies of 20 dominant TCR clonotypes selected from each subtype of T cells in malignant effusion or T cells in blood. The vertical axis indicates each of unique CDR3 sequences. Common CDR3s are presented only once. The scale bar represents frequency of each unique CDR3 sequence. The squares of red color represent CDR3 clones with more than 5% of frequency, and indicated by * (5% ˜ 15%), # (15% ˜ 25%), and ++ (more than 25%).
Discussion
TILs include killer CD8+ cells and helper CD4+ cells that recognize tumor-associated antigens that are potential targets for antigen-specific cancer immune response. A recent report has demonstrated that adoptive immunotherapy produced sustainable curative outcomes in some cancer patients.30 TILs are also suggested to be correlated with improved clinical outcome in ovarian cancer.31 Thus, it is important to characterize in detail the T cell repertoire and define the immune microenvironment in cancer tissues and malignant fluids to investigate what constitutes a beneficial immune response in the host tumor immunity. In this study, we applied a high-throughput NGS method to characterize TCRs of T cells in tumor, malignant effusion, and blood of ovarian cancer patients. Our results have indicated that certain T cells were expanded clonally in both tumor and ascites, but the clonally-expanded T cells seemed to be quite different even in the same patient. In addition, the intra- and inter-individual differences in the CD4+/CD8+ ratio, which was estimated from the expression levels in cancer tissues or ascites, was very large, indicating the very diverse tumor immune environment among individual cancer patients. Moreover, we also investigated TCR sequence signature of CD4+, CD8+, and CD4+CD25+ T cells in malignant effusion in three patients, and found that TCR sequences among three subsets of T cell population in malignant effusions were almost mutually exclusive.
Although previous studies reported the proportion of CD4+ and CD8+ T cells in tumor and ascites of ovarian cancer patients,5,6 no study has examined the clonality or functionality of T lymphocytes in tumors or ascites. We clearly demonstrated that some T cells were clonally expanded in both tumor and ascites. However, the overlap of the TCR sequences between TILs in a tumor and T lymphocytes in ascites was very limited, implying that the immune microenvironments in a tumor and ascites in the same patient could be enormously different. We further investigated the proportion and clonality of three subtypes of T cell in malignant fluids. Interestingly, the TCR repertoire, particularly clonally expanded TCR clonotypes, of CD4+, CD8+, and CD4+CD25+ T cells were mutually exclusive. In the three patients examined, all revealed very strong clonal expansion of CD8+ and CD4+CD25+ regulatory T cell populations, while the TCR repertoire of CD4+ T cell populations was relatively diverse as indicated by the pie chart in Fig. 5. The presence of regulatory CD4+CD25+ T cells in tumor and ascites was suggested its association with shorter survival.17 Our results demonstrated that the proportion of regulatory CD4+CD25+ T cells in three malignant effusions varied from 4.8% to 14.1% in total T lymphocytes and 8.6% to 27.0% in CD4+ T cells. Although the number of samples is definitely too small to make any solid conclusion, HLA-class I- and HLA-class II-mediated immune response of T cells in ascites might be quite different, and the balance among CD8+, CD4+, and CD4+CD25+ may significantly effect on the host immune responses.
As we described above, we observed mutually exclusive patterns of enriched TCR sequences among three subsets of T cells. However, it is still undetermined whether difference in TCRs in each subtype indicates recognition of different antigens presented by the HLA molecules or reflects functional differences in T cell subtypes that recognize the same antigen. Consistent with the former hypothesis, Andreas et al. reported differences in antigens recognized by Tregs and those by effector/memory T cells in the majority of colorectal cancer patients.32 They also demonstrated that depletion of Tregs led to enhancement of effector/memory T cell responses against antigens that were recognized by Tregs. Atypically in P203, the most enriched CDR3 clone of both TCR-α and TCR-β was detected commonly in both CD4+ and CD8+ T subpopulations. Tumor antigens can be presented on both MHC (major histocompatibility complex) class I and II molecules by the “cross-presentation” mechanism, and it was reported that CD4+ and CD8+ co-receptors could physically associate with the same TCR.33,34 Therefore, we assume that the most enriched CDR3 sequence in CD8+ killer T cells and CD4+ helper cells in P203 would recognize the same tumor antigen presented by MHC class I or class II, and might enhance the host immune system synergistically.
To estimate the relative ratio of CD4+, CD8+, and Treg cells in tumors and ascites, we examined the expression levels of CD4, CD8, and FOXP3 using mRNA obtained from tumor tissues and ascitic cells. In most of the 12 patients, the number of infiltrating CD4+ T cells estimated from CD4 expression seemed to be higher than that of CD8+ T cells in the tumor tissues while the numbers of CD8+ T cells were likely to be much higher than CD4+ T cells in ascites. This difference might be caused by the levels of some cytokines in tumor tissues and malignant fluids. Although many studies have characterized the changes of immune microenvironment through recruitment of leukocytes induced by chemokines,35-39 it could be also important to elucidate the relation between expansion of T cell clonotypes and expression of chemokines.
The activation of the immune system against tumor cells is expected to lead to a prolonged survival of cancer patients. T lymphocytes play a critical role in the host ability to eliminate tumor cells. Thus, the better understanding of the functionality and clonality of T cells in the immune microenvironment surrounding tumor and in malignant fluid should contribute to the improvement of cancer immunotherapy as well as other anticancer treatment modalities. So far, many studies have characterized T cells on the basis of PCR amplification of TCR sequences using genomic DNA of T cells.40 Our TCR cDNA sequencing approach may not reflect the number of unique T cells correctly because of the different levels of TCR expression in individual T cells. However, the genomic DNA analysis may not reflect the functional significance of T cell populations. T cells expressing more copies of TCR mRNA may be more active than those expressing a lower amount of TCR mRNA. Hence, we believe that our study may be more appropriate to examine possible differences in the functionality and clonality of T cells between tumor tissues and malignant effusions as well as those among the different T cell subpopulations. Although functional studies of clonally expanded T cell populations are definitely required, our approach offers a detailed characterization of T cell immune microenvironment in tumors and ascites.
Materials and Methods
Patient samples
RNAs from tumor, ascites, and blood of 12 newly diagnosed ovarian cancer patients (P100, P106, P117, P126, P137, P139, P154, P155, P157, P159, P168, P172), who did not receive any chemotherapy, were obtained from Saitama Medical University International Medical Center. Malignant effusions and blood samples of 3 ovarian cancer patients (P201, P202, P203) were obtained from University of Chicago. P201 and P202 were treated with chemotherapy, and a paracentesis in P203 was performed during first chemotherapy treatment. All human samples were obtained according to a study protocol and informed consent procedures approved by Institutional Review Board of each institution. Peripheral blood mononuclear cells (PBMCs) were isolated using Ficoll-Paque PLUS (GE Healthcare).
Isolation of different types of T cells in malignant effusion
Ficoll gradient centrifugation was used to isolate mononuclear cells from malignant effusion. Cells were washed with PBS and stained with the following anti-human mAbs: CD3-APC, CD4-PerCP, CD8-PE-Cy7, and CD25-PE. (eBioscience). The reaction mixture was incubated for 30 min on ice in the dark. The cells were then washed with PBS and 4′,6-diamidino-2-phenylindole (DAPI) was added. The mixture was incubated for 5 min on ice in the dark. After centrifugation, cells were resuspended with RPMI 1640 medium including 2% Bovine serum albumin (BSA). CD4+, CD8+, and regulatory CD4+CD25+ T cells were analyzed and separately sorted using a combination of two anti-human mAbs. Data were analyzed on FlowJo software (Tree Star, Inc., San Carlos, CA).
RNA isolation and PCR amplification
Total RNAs from cells obtained from tumor, ascites, and blood of 12 patients from Saitama Medical University International Medical Center were isolated using NucleoSpin miRNA or NucleoSpin RNA blood (Macherey-nagel). Total RNAs from cells obtained from malignant effusions and blood samples of 3 patients from University of Chicago were isolated using RNeasy mini kit (Qiagen, Valencia, CA) according to the manufacturer's instructions. cDNA was then synthesized by ligating a common adapter at 5′ end of cDNA using a SMART (Switching Mechanism at 5′ end of RNA Transcript) cDNA library construction kit (Clontech) and Advantage 2 PCR kit (Clontech). PCRs were then performed to amplify compatible amplicon libraries of TCR α and β with Ion Torrent sequencing platform from cDNA. The one common forward primer was designed based on the sequence of SMART IV adaptor and included Ion truncated P1 adaptor sequence. Two reverse primers were specific to the constant region of TCR-α and TCR-β respectively and included the Ion A1 adaptor sequence.
Forward: 5′-CCTCTCTATGGGCAGTCGGTGATTATCAACGCAGAGTGGCCAT-3′ Reverse: TCR-α (5′-CCATCTCATCCCTGCGTGTCTCCGACTCAGCAGGGTCAGGGTTCTGGATA-3′) TCR-β (5′-CCATCTCATCCCTGCGTGTCTCCGACTCAGTCTGATGGCTCAAACACAGC-3′). Amplification was performed as follows: 3 min at 94°C; 40 cycles of 30 s at 94°C, 30 s at 65°C, and 35 s at 68°C, followed by purification using Agenecourt AMPure XP reagent (Beckman Coulter) and size selection at 300–900bp using Pippin Prep (Sage Science). The concentration of size-selected PCR products were then measured by Agilent 2200 TapeStation Nucleic Acid System (Agilent).
Library preparation and sequencing
The libraries for TCR-α and TCR-β were mixed at 1:4 ratio and amplified onto the proprietary Ion Sphere particles (ISP) by emulsion PCR using the Ion PGM™ Template OT2 400 kit at Ion OneTouch2 system (Life Technologies, Carlsbad, CA), according to the manufacturer's instructions. The enrichment of ISPs with templates was performed by the Ion OneTouch ES instrument (Life Technologies). Finally, the completely prepared products were sequenced with the Ion PGM™ Sequencer (Life Technologies) using Ion PGM Sequencing 400 kit for TCR α and β, respectively. Ion 314v2 Chip was used for libraries of tumor and ascites, and Ion 318v2 Chip was used for libraries of blood.
Sequence analysis
To identify V, (D), J, and C segments in individual sequencing reads, each of the reads in FASTQ files were mapped to the reference sequences provided by IMGT/GENE-DB,41,42 using Bowtie2 aligner (Version 2.1.0).43 After identification of triplet of V, J, and C segments in a single read, a junction sequence was analyzed. The junction sequence in TCR-α was recognized as N segment between V and J segment. The junction sequence in TCR-β was recognized as N1 between V and D segment and N2 between D and J segment. A CDR3 region was identified by a region starting from the second conserved cysteine in the 3′ of the V segment and ending with the conserved phenylalanine in the 5′ of the J segment. Finally, the amino acid sequence of CDR3 region was determined. For data visualization, we used the Microsoft Excel program to generate pie charts and heatmaps.
Gene expression analysis
cDNA was synthesized from RNA using Superscript III first-strand synthesis kit (Invitrogen). Real-time PCR was performed using Taqman gene expression assay in the ABI ViiA 7 system (Applied Biosystems), according to the manufacturer's instructions.
Statistical analysis
The diversity index (inverse Simpson's index) in CDR3 sequences was calculated as follows:
Where K is the total number of CDR3 clonotypes, ni is the number of sequences belonging to the i-th clonotype, and N is the total number of identified CDR3 sequences.
Funding
The cell sorting by FACS was supported by flow cytometry facility in The University of Chicago. This work was supported by a pilot project award from University of Chicago Medicine Comprehensive Cancer Center.
Disclosure of Potential Conflicts of Interest
No potential conflicts of interest were disclosed.
Acknowledgments
We thank Drs Rui Yamaguchi, Seiya Imoto, and Satoru Miyano in The University of Tokyo for helpful support in data analysis. The supercomputing resource was provided by Human Genome Center, the Institute of Medical Science, The University of Tokyo.
Authorship contributions
YN designed and supervised the project; MJ and JP designed the study, performed experiments, analyzed data, and interpreted data; MJ wrote the manuscript, and YN and JP edited it; PYY analyzed the data; KH, YI, KF and GF provided the samples and clinical information.
Supplemental Material
Supplemental data for this article can be accessed on the publisher's website.
References
- 1.Siegel R, Ma J, Zou Z, Jemal A. Cancer statistics, 2014. CA Cancer J Clin 2014; 64:9-29; PMID:24399786; http://dx.doi.org/ 10.3322/caac.21208 [DOI] [PubMed] [Google Scholar]
- 2.Ayhan A, Gultekin M, Taskiran C, Dursun P, Firat P, Bozdag G, Celik NY, Yuce K. Ascites and epithelial ovarian cancers: a reappraisal with respect to different aspects. Int J Gynecol Cancer 2007; 17:68-75; PMID:17291234; http://dx.doi.org/ 10.1111/j.1525-1438.2006.00777.x [DOI] [PubMed] [Google Scholar]
- 3.Parsons SL, Lang MW, Steele RJ. Malignant ascites: a 2-year review from a teaching hospital. Eur J Surg Oncol 1996; 22:237-9; PMID:8654603; http://dx.doi.org/ 10.1016/S0748-7983(96)80009-6 [DOI] [PubMed] [Google Scholar]
- 4.Sheid B. Angiogenic effects of macrophages isolated from ascitic fluid aspirated from women with advanced ovarian cancer. Cancer Lett 1992; 62:153-8; PMID:1371714; http://dx.doi.org/ 10.1016/0304-3835(92)90186-Y [DOI] [PubMed] [Google Scholar]
- 5.Ioannides CG, Platsoucas CD, Rashed S, Wharton JT, Edwards CL, Freedman RS. Tumor cytolysis by lymphocytes infiltrating ovarian malignant ascites. Cancer Res 1991; 51:4257-65; PMID:1868446 [PubMed] [Google Scholar]
- 6.Santin AD, Hermonat PL, Ravaggi A, Bellone S, Roman JJ, Smith CV, Pecorelli S, Radominska-Pandya A, Cannon MJ, Parham GP. Phenotypic and functional analysis of tumor-infiltrating lymphocytes compared with tumor-associated lymphocytes from ascitic fluid and peripheral blood lymphocytes in patients with advanced ovarian cancer. Gynecol Obstet Invest 2001; 51:254-61; PMID:11408737; http://dx.doi.org/ 10.1159/000058060 [DOI] [PubMed] [Google Scholar]
- 7.Giuntoli RL 2nd, Webb TJ, Zoso A, Rogers O, Diaz-Montes TP, Bristow RE, Oelke M. Ovarian cancer-associated ascites demonstrates altered immune environment: implications for antitumor immunity. Anticancer Res 2009; 29:2875-84; PMID:19661290 [PubMed] [Google Scholar]
- 8.Gajewski TF, Schreiber H, Fu YX. Innate and adaptive immune cells in the tumor microenvironment. Nature Immunol 2013; 14:1014-22; PMID: 24048123; http://dx.doi.org/21514148 10.1038/ni.2703 [DOI] [PMC free article] [PubMed] [Google Scholar]
- 9.Yigit R, Figdor CG, Zusterzeel PL, Pots JM, Torensma R, Massuger LF. Cytokine analysis as a tool to understand tumour-host interaction in ovarian cancer. Eur J Cancer 2011; 47:1883-9; PMID:21514148; http://dx.doi.org/ 10.1016/j.ejca.2011.03.026 [DOI] [PubMed] [Google Scholar]
- 10.Facciabene A, Motz GT, Coukos G. T-regulatory cells: key players in tumor immune escape and angiogenesis. Cancer Res 2012; 72:2162-71; PMID:22549946; http://dx.doi.org/ 10.1158/0008-5472.CAN-11-3687 [DOI] [PMC free article] [PubMed] [Google Scholar]
- 11.Nedergaard BS, Ladekarl M, Thomsen HF, Nyengaard JR, Nielsen K. Low density of CD3+, CD4+ and CD8+ cells is associated with increased risk of relapse in squamous cell cervical cancer. Br J Cancer 2007; 97:1135-8; PMID:17940503; http://dx.doi.org/ 10.1038/sj.bjc.6604001 [DOI] [PMC free article] [PubMed] [Google Scholar]
- 12.Erdag G, Schaefer JT, Smolkin ME, Deacon DH, Shea SM, Dengel LT, Patterson JW, Slingluff CL Jr. Immunotype and immunohistologic characteristics of tumor-infiltrating immune cells are associated with clinical outcome in metastatic melanoma. Cancer Res 2012; 72:1070-80; PMID:22266112; http://dx.doi.org/ 10.1158/0008-5472.CAN-11-3218 [DOI] [PMC free article] [PubMed] [Google Scholar]
- 13.Nakano O, Sato M, Naito Y, Suzuki K, Orikasa S, Aizawa M, Suzuki Y, Shintaku I, Nagura H, Ohtani H. Proliferative activity of intratumoral CD8(+) T-lymphocytes as a prognostic factor in human renal cell carcinoma: clinicopathologic demonstration of antitumor immunity. Cancer Res 2001; 61:5132-6; PMID:11431351 [PubMed] [Google Scholar]
- 14.Pages F, Galon J, Dieu-Nosjean MC, Tartour E, Sautes-Fridman C, Fridman WH. Immune infiltration in human tumors: a prognostic factor that should not be ignored. Oncogene 2010; 29:1093-102; PMID:19946335; http://dx.doi.org/ 10.1038/onc.2009.416 [DOI] [PubMed] [Google Scholar]
- 15.Dudley ME, Wunderlich JR, Robbins PF, Yang JC, Hwu P, Schwartzentruber DJ, Topalian SL, Sherry R, Restifo NP, Hubicki AM et al.. Cancer regression and autoimmunity in patients after clonal repopulation with antitumor lymphocytes. Science 2002; 298:850-4; PMID:12242449; http://dx.doi.org/ 10.1126/science.1076514 [DOI] [PMC free article] [PubMed] [Google Scholar]
- 16.Bosmuller H, Haitchi-Petnehazy S, Webersinke G, Marschon R, Roithmeier F, Stummvoll W, Fehm T, Klier-Richter M, Bonzheim I, Staebler A et al.. Intratumoral lymphocyte density in serous ovarian carcinoma is superior to ERCC1 expression for predicting response to platinum-based therapy. Virchows Arch 2011; 459:183-91; PMID:21713364; http://dx.doi.org/ 10.1007/s00428-011-1110-1 [DOI] [PubMed] [Google Scholar]
- 17.Curiel TJ, Coukos G, Zou L, Alvarez X, Cheng P, Mottram P, Evdemon-Hogan M, Conejo-Garcia JR, Zhang L, Burow M et al.. Specific recruitment of regulatory T cells in ovarian carcinoma fosters immune privilege and predicts reduced survival. Nature Med 2004; 10:942-9; PMID:15322536; http://dx.doi.org/ 10.1038/nm1093 [DOI] [PubMed] [Google Scholar]
- 18.Scaviner D, Lefranc MP. The human T cell receptor alpha variable (TRAV) genes. Exp Clin Immunogenet 2000; 17:83-96; PMID:10810225; http://dx.doi.org/ 10.1159/000019128 [DOI] [PubMed] [Google Scholar]
- 19.Folch G, Lefranc MP. The human T cell receptor beta variable (TRBV) genes. Exp Clin Immunogenet 2000; 17:42-54; PMID:10686482; http://dx.doi.org/ 10.1159/000019123 [DOI] [PubMed] [Google Scholar]
- 20.Scaviner D, Lefranc MP. The human T cell receptor alpha joining (TRAJ) genes. Exp Clin Immunogenet 2000; 17:97-106; PMID:10810226; http://dx.doi.org/ 10.1159/000019129 [DOI] [PubMed] [Google Scholar]
- 21.Folch G, Lefranc MP. The human T cell receptor beta diversity (TRBD) and beta joining (TRBJ) genes. Exp Clin Immunogenet 2000; 17:107-14; PMID:10810227; http://dx.doi.org/ 10.1159/000019130 [DOI] [PubMed] [Google Scholar]
- 22.Baum PD, Venturi V, Price DA. Wrestling with the repertoire: the promise and perils of next generation sequencing for antigen receptors. Eur J Immunol 2012; 42:2834-9; PMID:23108932; http://dx.doi.org/ 10.1002/eji.201242999 [DOI] [PubMed] [Google Scholar]
- 23.Qi Q, Liu Y, Cheng Y, Glanville J, Zhang D, Lee JY, Olshen RA, Weyand CM, Boyd SD, Goronzy JJ. Diversity and clonal selection in the human T-cell repertoire. Proc Natl Acad Sci USA 2014; 111:13139-44; PMID:25157137; http://dx.doi.org/ 10.1073/pnas.1409155111 [DOI] [PMC free article] [PubMed] [Google Scholar]
- 24.Naylor K, Li G, Vallejo AN, Lee WW, Koetz K, Bryl E, Witkowski J, Fulbright J, Weyand CM, Goronzy JJ. The influence of age on T cell generation and TCR diversity. J Immunol 2005; 174:7446-52; PMID:15905594; http://dx.doi.org/ 10.4049/jimmunol.174.11.7446 [DOI] [PubMed] [Google Scholar]
- 25.Baum PD, Young JJ, Schmidt D, Zhang Q, Hoh R, Busch M, Martin J, Deeks S, McCune JM. Blood T-cell receptor diversity decreases during the course of HIV infection, but the potential for a diverse repertoire persists. Blood 2012; 119:3469-77; PMID:22371879; http://dx.doi.org/ 10.1182/blood-2011-11-395384 [DOI] [PMC free article] [PubMed] [Google Scholar]
- 26.Sinicrope FA, Rego RL, Ansell SM, Knutson KL, Foster NR, Sargent DJ. Intraepithelial effector (CD3+)/regulatory (FoxP3+) T-cell ratio predicts a clinical outcome of human colon carcinoma. Gastroenterology 2009; 137:1270-9; PMID:19577568; http://dx.doi.org/ 10.1053/j.gastro.2009.06.053 [DOI] [PMC free article] [PubMed] [Google Scholar]
- 27.Kirk R. Risk factors. CD8+:FOXP3+ cell ratio is a novel survival marker for colorectal cancer. Nat Rev Clin Oncol 2010; 7:299; PMID:20527684; http://dx.doi.org/ 10.1038/nrclinonc.2010.79 [DOI] [PubMed] [Google Scholar]
- 28.Imai H, Saio M, Nonaka K, Suwa T, Umemura N, Ouyang GF, Nakagawa J, Tomita H, Osada S, Sugiyama Y et al.. Depletion of CD4+CD25+ regulatory T cells enhances interleukin-2-induced antitumor immunity in a mouse model of colon adenocarcinoma. Cancer sci 2007; 98:416-23; PMID:17270031; http://dx.doi.org/ 10.1111/j.1349-7006.2006.00385.x [DOI] [PMC free article] [PubMed] [Google Scholar]
- 29.Preston CC, Maurer MJ, Oberg AL, Visscher DW, Kalli KR, Hartmann LC, Goode EL, Knutson KL. The ratios of CD8+ T cells to CD4+CD25+ FOXP3+ and FOXP3- T cells correlate with poor clinical outcome in human serous ovarian cancer. PloS one 2013; 8:e80063; PMID:24244610; http://dx.doi.org/ 10.1371/journal.pone.0080063 [DOI] [PMC free article] [PubMed] [Google Scholar]
- 30.Restifo NP, Dudley ME, Rosenberg SA. Adoptive immunotherapy for cancer: harnessing the T cell response. Nat rev Immunol 2012; 12:269-81; PMID:22437939; http://dx.doi.org/ 10.1038/nri3191 [DOI] [PMC free article] [PubMed] [Google Scholar]
- 31.Zhang L, Conejo-Garcia JR, Katsaros D, Gimotty PA, Massobrio M, Regnani G, Makrigiannakis A, Gray H, Schlienger K, Liebman MN et al.. Intratumoral T cells, recurrence, and survival in epithelial ovarian cancer. N Engl J Med 2003; 348:203-13; PMID:12529460; http://dx.doi.org/ 10.1056/NEJMoa020177 [DOI] [PubMed] [Google Scholar]
- 32.Bonertz A, Weitz J, Pietsch DH, Rahbari NN, Schlude C, Ge Y, Juenger S, Vlodavsky I, Khazaie K, Jaeger D et al.. Antigen-specific Tregs control T cell responses against a limited repertoire of tumor antigens in patients with colorectal carcinoma. J Clin Invest 2009; 119:3311-21; PMID:19809157; http://dx.doi.org/ 10.1172/JCI39608 [DOI] [PMC free article] [PubMed] [Google Scholar]
- 33.Robson NC, Hoves S, Maraskovsky E, Schnurr M. Presentation of tumour antigens by dendritic cells and challenges faced. Curr Opin Immunol 2010; 22:137-44; PMID:20116984; http://dx.doi.org/ 10.1016/j.coi.2010.01.002 [DOI] [PubMed] [Google Scholar]
- 34.Gallagher PF, Fazekas de St Groth B, Miller JF. CD4 and CD8 molecules can physically associate with the same T-cell receptor. Proc Natl Acad Sci USA 1989; 86:10044-8; PMID:2513572; http://dx.doi.org/ 10.1073/pnas.86.24.10044 [DOI] [PMC free article] [PubMed] [Google Scholar]
- 35.Qin XJ, Shi HZ, Deng JM, Liang QL, Jiang J, Ye ZJ. CCL22 recruits CD4-positive CD25-positive regulatory T cells into malignant pleural effusion. Clin Cancer Res 2009; 15:2231-7; PMID:19318474; http://dx.doi.org/ 10.1158/1078-0432.CCR-08-2641 [DOI] [PubMed] [Google Scholar]
- 36.Castellino F, Huang AY, Altan-Bonnet G, Stoll S, Scheinecker C, Germain RN. Chemokines enhance immunity by guiding naive CD8+ T cells to sites of CD4+ T cell-dendritic cell interaction. Nature 2006; 440:890-5; PMID:16612374; http://dx.doi.org/ 10.1038/nature04651 [DOI] [PubMed] [Google Scholar]
- 37.Rot A, von Andrian UH. Chemokines in innate and adaptive host defense: basic chemokinese grammar for immune cells. Annu Rev Immunol 2004; 22:891-928; PMID:15032599; http://dx.doi.org/ 10.1146/annurev.immunol.22.012703.104543 [DOI] [PubMed] [Google Scholar]
- 38.Ebert LM, Schaerli P, Moser B. Chemokine-mediated control of T cell traffic in lymphoid and peripheral tissues. Mol Immunol 2005; 42:799-809; PMID:15829268; http://dx.doi.org/ 10.1016/j.molimm.2004.06.040 [DOI] [PubMed] [Google Scholar]
- 39.Schreiber TH, Shinder V, Cain DW, Alon R, Sackstein R. Shear flow-dependent integration of apical and subendothelial chemokines in T-cell transmigration: implications for locomotion and the multistep paradigm. Blood 2007; 109:1381-6; PMID:17038526; http://dx.doi.org/ 10.1182/blood-2006-07-032995 [DOI] [PMC free article] [PubMed] [Google Scholar]
- 40.Robins HS, Campregher PV, Srivastava SK, Wacher A, Turtle CJ, Kahsai O, Riddell SR, Warren EH, Carlson CS. Comprehensive assessment of T-cell receptor beta-chain diversity in alphabeta T cells. Blood 2009; 114:4099-107; PMID:19706884; http://dx.doi.org/ 10.1182/blood-2009-04-217604 [DOI] [PMC free article] [PubMed] [Google Scholar]
- 41.Giudicelli V, Chaume D, Lefranc MP. IMGT/GENE-DB: a comprehensive database for human and mouse immunoglobulin and T cell receptor genes. Nucleic Acids Res 2005; 33:D256-61; PMID:15608191; http://dx.doi.org/ 10.1093/nar/gki010 [DOI] [PMC free article] [PubMed] [Google Scholar]
- 42.Lefranc MP, Giudicelli V, Kaas Q, Duprat E, Jabado-Michaloud J, Scaviner D, Ginestoux C, Clement O, Chaume D, Lefranc G. IMGT, the international ImMunoGeneTics information system. Nucleic Acids Res 2005; 33:D593-7; PMID:15608269; http://dx.doi.org/ 10.1093/nar/gki065 [DOI] [PMC free article] [PubMed] [Google Scholar]
- 43.Langmead B, Salzberg SL. Fast gapped-read alignment with Bowtie 2. Nature methods 2012; 9:357-9; PMID:22388286; http://dx.doi.org/ 10.1038/nmeth.1923 [DOI] [PMC free article] [PubMed] [Google Scholar]
Associated Data
This section collects any data citations, data availability statements, or supplementary materials included in this article.