Summary
The source of new hepatocytes in the uninjured liver has remained an open question. By lineage tracing using the Wnt-responsive gene Axin2, we identify a population of proliferating and self-renewing cells adjacent to the central vein in the liver lobule. These pericentral cells express the early liver progenitor marker Tbx3, are diploid, and thus differ from mature hepatocytes, which are mostly polyploid. The descendants of pericentral cells differentiate into Tbx3-negative, polyploid hepatocytes and can replace all hepatocytes along the liver lobule during homeostatic renewal. Adjacent central vein endothelial cells provide Wnt signals that maintain the pericentral cells, thereby constituting the niche. Thus, we identify a cell population in the liver that subserves homeostatic hepatocyte renewal, characterize its anatomical niche, and identify molecular signals that regulate its activity.
The cellular source of new hepatocytes in the adult liver and the molecular regulation of hepatocyte renewal are fundamental unanswered questions in liver biology. Recent studies in mice using genetic lineage tracing techniques have concluded that during homeostatic renewal, new hepatocytes arise by replication of pre-existing hepatocytes[1, 2]. This is in line with the generally accepted view that in the uninjured state, hepatocyte homeostasis does not involve a stem cell population[3]. However, hepatocytes are heterogeneous with striking differences in age and function across the liver lobule[4]. In addition, mature hepatocytes are generally polyploid (4N to 32N), a genomic state that compromises replicative capacity[5, 6], posing limitations on possible contributions of these cells to long-term liver homeostasis. It has been unknown whether a specific subpopulation of cells serves homeostatic renewal in the liver, as happens in many other tissues[7–10].
Wnt proteins are secreted short-range signals that maintain stem cells in many adult mammalian tissues, and are produced by the specialized microenvironment referred to as the stem cell niche[11]. Wnts signal primarily through the intracellular protein β-catenin to activate transcription. A universal transcriptional target of β-catenin dependent Wnt signaling is Axin2, and its expression provides a reliable readout of cells responding to Wnt[11, 12]. Genetic lineage tracing of Axin2+ cells has identified stem cells in several adult mammalian tissues[10, 13]. We have used this lineage tracing approach to identify a unique population of Wnt-responsive cells that surround the central vein. These diploid cells self-renew over the lifespan and progressively give rise to mature polyploid hepatocytes that can populate the entire liver lobule. We also show that these pericentral cells are maintained by Wnt-producing central vein endothelial cells that constitute the niche.
Axin2+ pericentral cells generate expanding clones of hepatocytes
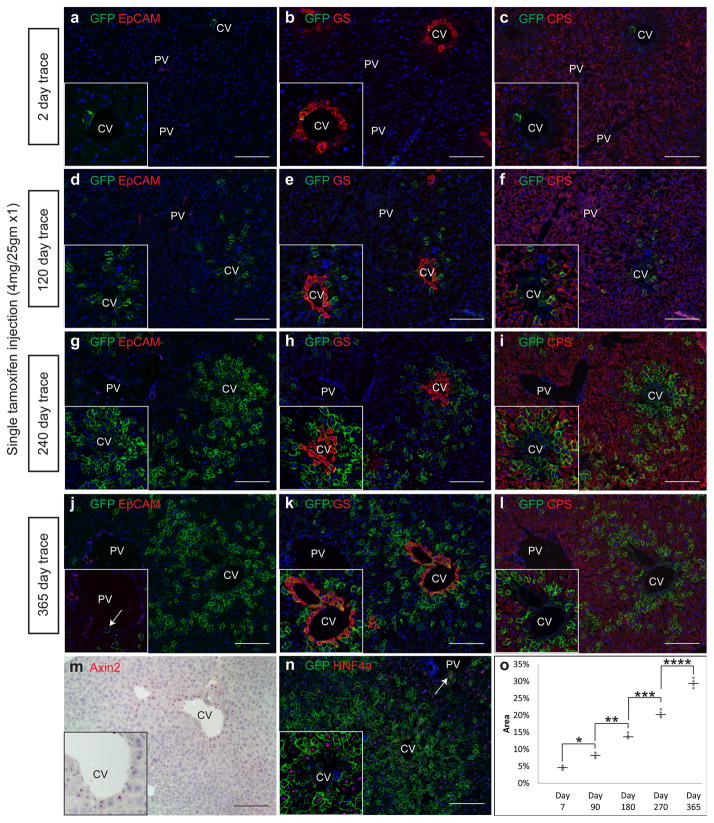
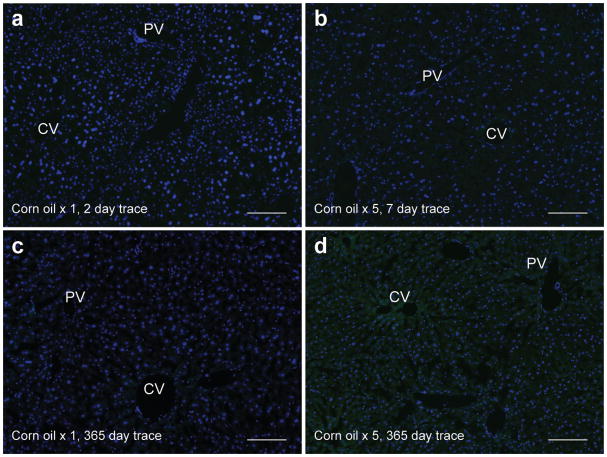
In the adult liver, Axin2 is expressed in cells located around the central vein[14, 15], which we confirmed by in situ hybridization (Figure 1m). In order to mark and follow the fates of these Wnt-responsive cells, we used the tamoxifen-inducible Axin2-CreERT2;Rosa26-mTmGflox mouse to pulse label Axin2+ cells. In these experiments, a subset of Axin2+ cells is labeled stochastically with membrane GFP after tamoxifen administration. The GFP label is permanent, allowing for fate mapping of initially labeled cells and their descendants[10, 13]. A single low-dose of tamoxifen led to GFP labeling exclusively of pericentral hepatocytes (Figure 1a). Control animals receiving corn oil did not show any GFP labeling (Extended figure 1). The GFP+ cells expressed glutamine synthetase (GS), another known Wnt target gene[16] and a marker for pericentral hepatocytes (Figure 1b). They were negative for carbamoyl-phosphate synthase 1 (CPS), which marks midlobular and periportal hepatocytes (Figure 1c). Over time, the population of labeled cells expanded as large contiguous patches spreading directionally from the central vein towards the portal vein (Figure 1d, g, j). One year after the marking, nearly all hepatocytes in some individual lobules were descendants of the initially labeled Axin2+ cells (Figure 1j), including hepatocytes that abut the portal vein (Figure 1j inset).
Figure 1. Axin2+ pericentral cells generate expanding clones of hepatocytes from the central vein towards the portal vein over time.
a, Few pericentral hepatocytes are labeled in Axin2-CreERT2;Rosa26-mTmGflox mice following a single dose of tamoxifen and traced for two days. EpCam labels bile ducts. Labeled pericentral cells express GS (b) but not CPS (c). d, 120 day trace, g, 240 day trace, j, 365 day trace show expansion of labeled cells which can replace hepatocytes at the portal vein (j inset, arrow). Pericentral cells maintain GS expression (e, h, k), while labeled progeny acquire CPS expression (f, i, l). m, in situ hybridization for Axin2. n, All labeled cells express HNF4a, including cells at the portal vein (arrow). o, Quantification of labeled hepatocytes over time. Data shows individual measurements and the mean. n = 4 animals for each time point. *, **, ***, **** p < 0.05, two-tailed unpaired t-tests. CV = central vein. PV = portal vein. Scale bars = 100 μm.
Pericentral cells that remained labeled throughout the course of the lineage trace maintained their distinct gene expression profile, expressing Axin2 (Extended figure 2) and GS (Figure 1b, e, h, k) but not CPS (Figure 1c, f, i, l). On the other hand the descendants of the labeled cells acquired different gene expression patterns as they moved away from the central vein. They lost Axin2 and GS expression and gained CPS expression suggesting that as they move away from the pericentral region they no longer receive Wnt signals (see below) and subsequently differentiate. Finally, throughout the lineage traces, all labeled cells expressed the hepatocyte marker HNF4α (Figure 1n), but not markers of other liver cells types including biliary epithelial cells (data not shown), indicating that Axin2+ cells contribute only to the hepatocyte lineage.
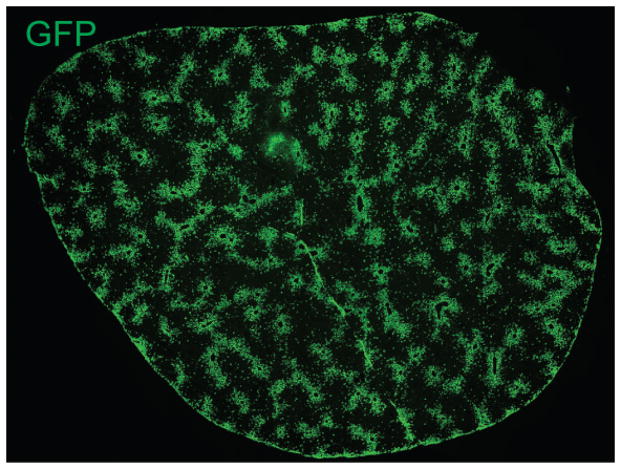
While Axin2+ cells can generate all hepatocytes in a lobule over time, quantification of the labeling after one year showed that on average, descendants of Axin2+ cells replaced 30% of the area of the entire liver (Figure 1o, Extended figure 3) accounting for approximately 40% of the hepatocytes.
Axin2+ cells self-renew
A defining property of stem cells is the ability to self-renew. To test whether Axin2+ cells self-renew, we labeled a maximum number of Axin2+ cells by administering five consecutive daily doses of tamoxifen (Figure 2a). Over time, the labeled cells expanded concentrically from the central vein and importantly, all pericentral cells remained labeled (Figure 2b, c). This indicates that new pericentral cells arise exclusively from preexisting labeled Axin2+ cells. Thus, while Axin2+ cells can give rise to all the hepatocytes along the lobule (Figure 2c), they are not replaced by unlabeled Axin2− cells. That is, pericentral Axin2+ cells are a self-renewing cell population.
Figure 2. Axin2+ cells self-renew.

a, The majority of pericentral hepatocytes are labeled in Axin2-CreERT2;Rosa26-mTmGflox mice given 5 doses of tamoxifen and traced for 7 days. b, 90 day trace, c, 365 day trace show all pericentral cells remain labeled (see insets). Note that non-labeled cells do not occupy the pericentral region over time. d, in situ hybridization of Tbx3. CV = central vein. PV = portal vein. Scale bars = 100 μm.
To further characterize the Axin2+ cell population, we used RNAseq to compare the gene expression profile of FACS isolated Axin2+ and Axin2− hepatocytes (Extended figure 4). As expected, most of the differentially expressed genes between the two populations were known markers of liver zonation (Extended table 1)[14, 17]. However, we also identified Tbx3, a transcription factor important in maintaining pluripotency[18], as a gene upregulated in the Axin2+ population. Interestingly, Tbx3 marks early hepatoblasts that arise around day 10 of embryogenesis, and is required for the earliest anlage of the liver[19]. By in situ hybridization, we confirmed that Tbx3 expression is uniquely expressed in the single layer of pericentral cells (Figure 2d).
In Axin2-CreERT2 mice, one copy of the endogenous Axin2 gene is inactivated. Since Axin2 is a negative feedback regulator of Wnt signaling[12], we considered the possibility that inactivation of one allele could confer a proliferative advantage after Wnt stimulation. To address this concern, we compared the DNA synthesis rate of Axin2+ hepatocytes in wildtype versus Axin2-CreERT2+/− mice by 5-ethynyl-2′-deoxyuridine (EdU) incorporation. We used GS as the surrogate marker for Axin2+ cells in wildtype animals because a suitable antibody for murine liver Axin2 staining does not exist. We found no difference in the DNA synthesis rate in the two strains of mice (Extended figure 5). We also controlled for the possibility of liver injury from tamoxifen administration, which could serve as a proliferative stimulus[20]. We examined DNA synthesis by GS+ pericentral hepatocytes in mice treated with corn oil or tamoxifen, comparing wildtype and Axin2-CreERT2+/− animals. We found no difference as measured by EdU incorporation (Extended figure 5). We conclude that neither Axin2 gene dosage nor tamoxifen affects proliferation of Axin2+ cells in our mouse model.
Axin2+ cells proliferate faster than other hepatocytes
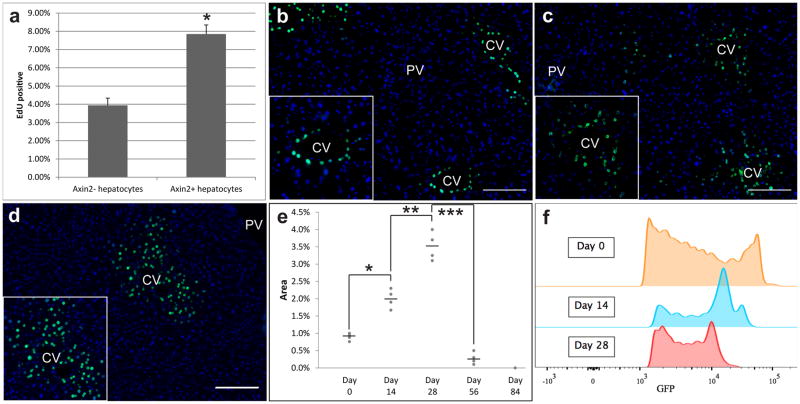
The fact that Axin2+ cells repopulate most of the liver lobule over time implies a rate of proliferation that is greater than that of Axin2− hepatocytes. We quantified the DNA synthesis rates of the two cell populations as already described. Axin2-CreERT2;R26-mTmGflox mice were labeled with tamoxifen and then given 7 daily doses of EdU. We found that Axin2+ cells undergo DNA replication twice as frequently as Axin2− hepatocytes (Figure 3a).
Figure 3. Axin2+ hepatocytes proliferate faster than other hepatocytes.
a, Quantification of % EdU+ cells within the Axin2− and Axin2+ hepatocyte populations. Data represent mean ± s.e.m. n = 5 animals. * p < 0.05, two-tailed unpaired t-tests. b, All pericentral hepatocytes are labeled with nuclear GFP in Axin2-rtTA;TetO-H2B-GFP mice given doxycycline for 7 days. c, 14 day chase, d, 28 day chase after doxycycline. e, quantification of GFP labeled nuclei. Data shows individual measurements and the mean. n = 4 animals per group. *, **, *** p < 0.05, two-tailed unpaired t-tests. f, GFP intensity in day 0, day 14 and day 28 chase animals. CV = central vein. PV = portal vein. Scale bars = 100 μm.
To verify this result, we also examined the replicative activity of Axin2+ cells by label dilution in which cells are tagged initially with a fixed amount of a stable product, which undergoes dilution with each cell division. We utilized the Axin2-rtTA;TetO-H2B-GFP transgenic mouse[21, 22], which expresses a stable histone 2B-GFP fusion protein in Axin2+ cells when given doxycycline. Additionally, the reverse tetracycline-controlled transactivator in Axin2-rtTA mice is under the control of a mouse Axin2 expression cassette[21], thus leaving the endogenous Axin2 gene locus unaffected. Once activated by doxycycline, the H2B-GFP protein remains stably expressed until the labeled cell undergoes cell division, when the H2B-GFP protein is divided between the daughter cells resulting in diminished GFP signal intensity[22].
Doxycycline was administered continuously for seven days, at which time cells lining the central vein were labeled with nuclear GFP (Figure 3b). Following a 14 day chase period after cessation of doxycycline, we observed that the number of GFP labeled cells had expanded, while the peak GFP signal intensity had decreased (Figure 3c, f). The expansion of GFP labeled cells around the central vein is concentric, consistent with the Axin2-CreERT2 lineage tracing results and is seen up to 28 days after cessation of doxycycline (Figure 3d). By 56 days after cessation of doxycycline very few GFP labeled cells are seen, and no labeled cells after 84 days (Extended figure 6). We quantified the number of GFP+ cells at each time point and found that the cell cycling rate is approximately every 14 days (Figure 3e). We further confirmed this by FACS analysis, which showed step-wise dilution of the peak GFP signal intensity every 14 days (Figure 3f). Thus pericentral Axin2+ cells actively proliferate during adult homeostasis, at an estimated cell cycling rate of 14 days.
Axin2+ cells are mostly diploid
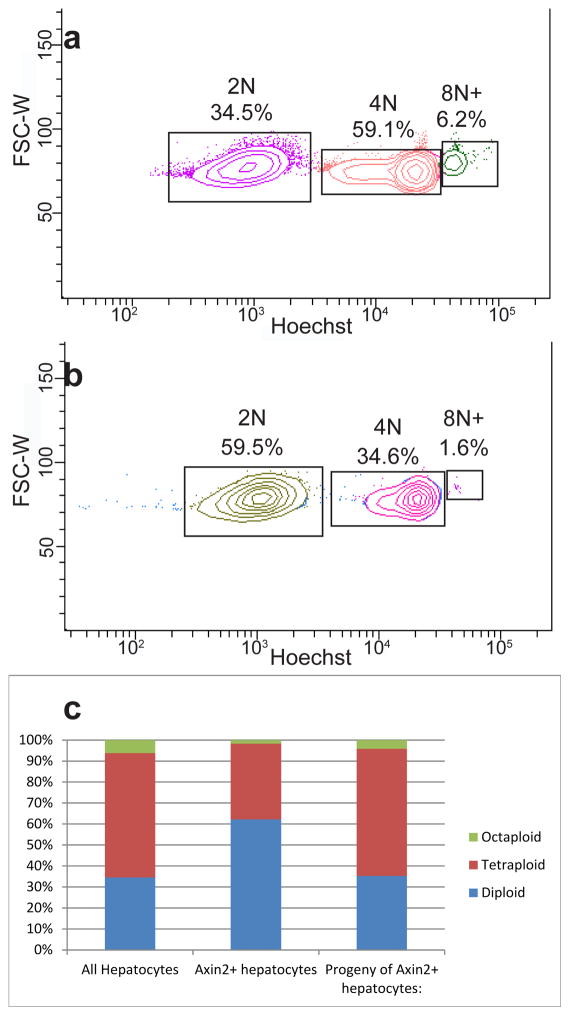
Mature hepatocytes are mostly polyploid[23], which is associated with decreased proliferative potential and increased senescence[6]. Stem cells are typically diploid, a property that may be necessary for unlimited duplication[24, 25]. We used FACS sorting to isolate Axin2+ cells and evaluated their ploidy status with Hoechst 33342 staining (Extended figure 7). As expected, the majority of unsorted hepatocytes are polyploid (Figure 4a, 4c left bar). In contrast, the majority of Axin2+ cells are diploid (Figure 4b, 4c middle bar). To confirm that Axin2+ diploid cells give rise to polyploid cells, we labeled Axin2+ cells with tamoxifen, traced for one year and isolated GFP+ cells for ploidy analysis. We found that the ploidy distribution of the GFP+ cells at the end of the trace was identical to that of unsorted hepatocytes (Figure 4c, right bar), suggesting that the descendants of Axin2+ cells mature normally into polyploid cells after leaving the pericentral zone.
Figure 4. Axin2+ hepatocytes are mostly diploid.
a, FACS plot of hepatocytes stained with Hoechst 33342 and gated for diploid (2N), tetraploid (4N) and octaploid or greater (8N+) cells. b, FACS plot of Axin2+ hepatocytes stained with Hoechst 33342. c, Ploidy distribution within unsorted hepatocyte population (left), Axin2+ hepatocyte population (center), or labeled hepatocytes after one year lineage trace (right). n = 3 animals per group.
Central vein endothelium acts as a Wnt-producing niche
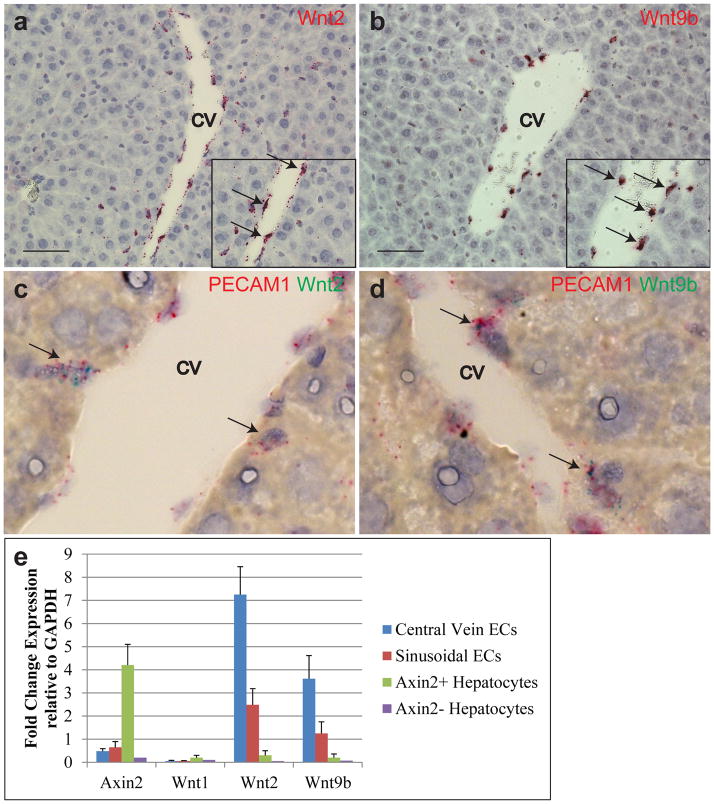
The strict localization of Axin2+ cells to the central vein suggested a local source of Wnt. We screened the normal liver for all nineteen mammalian Wnts by in situ hybridization[10]. Two of these, Wnt2 and Wnt9b, were expressed exclusively in endothelial cells around the central vein (Figure 5a, 5b), colocalizing with the endothelial cell marker PECAM1 (Figure 5c, d). We also isolated liver endothelial cells by FACS[26] and confirmed that both Wnt2 and Wnt9b are highly expressed in endothelial cells by qRT-PCR (Figure 5e, Extended figure 8). Thus endothelial cells at the central vein produce Wnt2 and Wnt9b as short range signals for pericentral Axin2+ cells and may constitute their niche.
Figure 5. Central vein endothelial cells produce Wnts and act as a niche for pericentral cells.
In situ hybridization of Wnt2 (a) and Wnt9b (b) showing mRNA expression at the central vein in endothelial cells (arrows, inset). Co-in situ hybridization of PECAM1 (red) and Wnt2 (green) (c) and PECAM1 and Wnt9b (d) showing co-expression in endothelial cells lining the central vein (arrows). e, Quantitative RT-PCR of Axin2, Wnt1, Wnt2 and Wnt9b of FACS isolated liver cells. Data represent mean ± s.e.m. n = 5 animals. Scale bars = 100 μm.
Wnt signals are required for pericentral cell proliferation
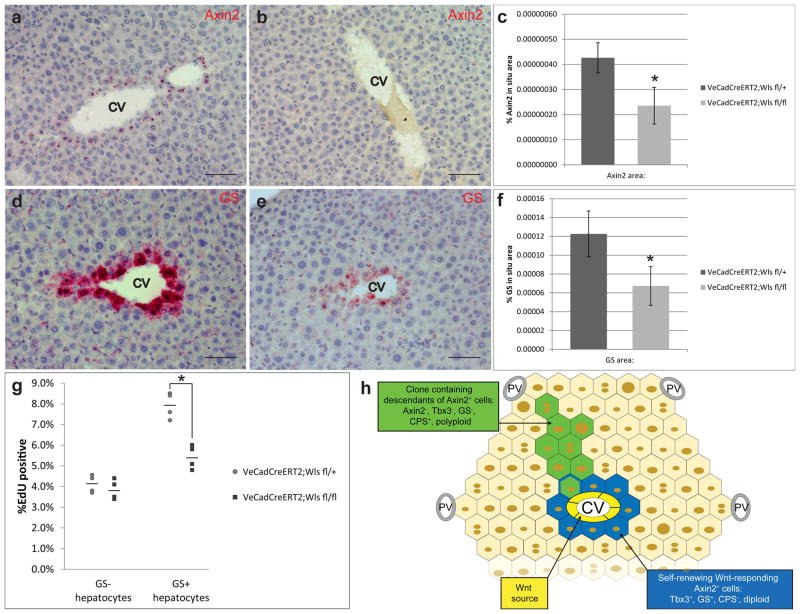
The simultaneous and overlapping expression of two Wnt family members suggests functional redundancy of Wnt signaling at the central vein. To directly test whether endothelial cell derived Wnt proteins function to maintain the precursor state of pericentral cells, we conditionally deleted Wntless (Wls), a Wnt-specific transporter molecule required for proper Wnt protein secretion[27], specifically in endothelial cells. We crossed VE-cadherin-CreERT2 mouse which has a tamoxifen inducible Cre-recombinase under the control of an endothelial cell specific promoter with Wlsflox/flox mice. Adult VE-cadherin-CreERT2;Wlsflox/flox animals (Wls f/f)[28, 29] were given multiple doses of tamoxifen to induce conditional deletion of Wls in endothelial cells. These mice appeared healthy without obvious systemic defects and their livers appeared grossly and histologically normal (Extended figure 9). Compared to VE-cadherin-CreERT2;Wlsflox/+ (Wls f/+) control animals, Axin2 expression was decreased in pericentral hepatocytes of Wls f/f mice (Figure 6a–c), consistent with loss of Wnt signaling around the central vein. Concurrently, there was loss of pericentral hepatocyte function as shown by significantly decreased levels of glutamine synthetase expression (Figure 6d–f). Importantly, pericentral cells, labeled by GS, exhibited significantly decreased proliferation rates in Wls f/f mice compared to Wls f/+ controls (Figure 6g). The decreased rate approached the proliferation rate of GS− hepatocytes, though it remained significantly higher. This is likely due to the mosaic nature of tamoxifen-induced Wls inactivation. We conclude that endothelial-cell derived Wnt signals are necessary for maintaining the high proliferative state of pericentral cells.
Figure 6. Central vein derived Wnts are required for pericentral cell proliferation.
a, Axin2 in situ hybridization in Wls f/+, and b, Wls f/f mice. c, Quantification of Axin2 in situ signal. Data represent mean ± s.e.m. n = 5 animals per group. * p < 0.05, two-tailed unpaired t-tests. d, GS in situ hybridization in Wls f/+, and e, Wls f/f mice. f, Quantification of GS in situ signal. Data represent mean ± s.e.m. n = 5 animals per group. * p < 0.05, two-tailed unpaired t-tests. g, Quantification of % EdU+ cells within GS− or GS+ hepatocyte populations in Wls fl/+ and Wls fl/fl animals. Data shows individual measurements and the mean. n = 4 animals per group. * p < 0.05, two-tailed unpaired t-tests. Figure 6h: Schematic of hepatocyte homeostatic renewal by pericentral cells. Scale bars = 100 μm.
Discussion
In this paper we present a new view of hepatocyte homeostasis in the uninjured liver (Figure 6h). We have identified a Wnt-responsive cell population that resides within a confined niche around the central vein. These cells self-renew and contribute to hepatocyte maintenance by differentiating into and replacing other hepatocytes along the hepatic lobule in the normal liver. The existence of this pericentral cell population suggests that the fundamental mechanisms regulating liver renewal are similar to other organs in which homeostatic renewal involves small populations of stem cells that maintain the tissue. In the liver however, our model is novel because it was previously thought that all hepatocytes are equivalent in their renewal potential. In contrast, we show that hepatocytes are made up of more than one cell type and are not equivalent in replicative ability during homeostasis. Given the properties of the cell population under study, we postulate that the Wnt-responsive pericentral cells act as hepatocyte stem cells.
Several features make pericentral cells unique compared to other hepatocytes. Although pericentral cells express markers common to other hepatocytes, they also specifically express Axin2, Tbx3, and GS while lacking CPS. Pericentral cells proliferate at a higher rate compared to other hepatocytes, an observation that is consistent with Magami et al[30]. Furthermore, pericentral cells possess a diploid genome, in contrast to most other hepatocytes, which are polyploid. Finally, and most importantly, while pericentral Axin2+ cells can differentiate into all hepatocytes along the lobule, including those that line the portal vein, Axin2− hepatocytes do not replace pericentral cells during homeostasis. As pericentral cells can self-renew over the long-term and differentiate into other hepatocytes, we suggest that they fit the functional definition of a stem cell.
The diploid nature of pericentral cells is important and surprising, although nuclear size measurements in rat livers have suggested the presence of smaller nuclei near the central vein[31]. This sheds light on a long-standing question in liver biology. Mature polyploid hepatocytes display chromosomal abnormalities[5, 32] and display impaired replication[5, 6]. By maintaining a diploid genome, the pericentral cells would, like stem cells do[25], retain unlimited replicative potential. It is interesting to note that during the cell cycle, levels of Wnt signaling peak at the G2/M phase[33]. If Wnts regulate expression of mitotic control genes such as the phosphatase CDC25[34], they could direct cells to mitosis and continued diploidy rather than to non-mitotic DNA replication and polyploidy.
A defining feature of pericentral cells is their localization to a Wnt-rich anatomical niche. While Wnt-regulated genes such as β-catenin and APC are known to function in liver development[35], and zonation[14], the types and sources of Wnt have not been identified. We found that Wnt9b is specifically expressed in endothelial cells at the central vein, adjacent to the pericentral cells, while Wnt2 is expressed in both the sinusoidal and central vein endothelial cells. Interestingly, Wnt2 produced by sinusoidal endothelial cells is known to be important for hepatocyte regeneration after injury[26]. Siimilarly, in other stem cell niches, lipid-modified Wnt signals act as short-range cues, maintaining stem cells in the immediate vicinity of the niche but not outside[11].
It has been suggested that there may be a periportal source of new hepatocytes under normal conditions[36]. Our lineage tracing studies do not exclude the possibility that other sources of hepatocytes exist during homeostasis since after one year the descendants of pericentral cells replace on average only 40% of hepatocytes within the liver. However, a portal-based population would be regulated differently, since we find no expression of Wnt9b by the portal vein endothelium.
Liver is known to regenerate efficiently after injuries such as partial hepatectomy or chemical insult. It has been reported that during regeneration after chemical damage, a Wnt-responsive population of cells near the portal vein can be labeled by the Lgr5 receptor gene[15]. These cells, unlike pericentral Axin2+ cells, do not express hepatocyte genes, but subsequently differentiate into bile duct epithelial cells and hepatocytes and thus could be similar to injury induced oval cells[3]. Clearly, Lgr5+/oval cells are distinct from the cells we identify here, as pericentral cells maintain hepatocyte homeostasis in the uninjured liver while Lgr5+/oval cells have only been reported after injury.
The stem cell marker Tbx3 is expressed widely in early liver hepatoblasts and is important for hepatoblast proliferation and initiation of hepatocyte differentiation[19, 37]. Our findings that pericentral cells also express Tbx3 leads to the intriguing hypothesis that pericentral cells may represent the persistence of an embryonic hepatocyte progenitor population into a self-renewing cell population in the mature liver.
It is noteworthy that liver cancer is often characterized by loss of function mutations in negative regulators of the Wnt pathway, including Axin and APC[38]. In a mouse model of liver cancer caused by Met overexpression, liver tumors were found to arise exclusively from cells located at the central vein[39, 40], suggesting that pericentral Axin2+ cells, normally controlled by a paracrine Wnt signal, are precursors to liver cancer. This would explain why liver tumors contain mostly diploid cells[41], an observation that was earlier rationalized by polyploid hepatocytes becoming diploid after oncogenic transformation.
Methods
Animals
B6 and FVB mice (Charles River Laboratories) were used for wild-type analysis. Axin2-CreERT2 mice[13], VE-cadherin-CreERT2 mice[28] were previous described. Rosa26-mTmGflox (Gt(ROSA)26Sortm4(ACTB-tdTomato,-EGFP)Luo/J[42], Wlsflox (129S-Wlstm1.1Lan/J)[29], Axin2-rtTA (B6.Cg-Tg(Axin2-rtTA2S*M2)7Cos/J)[21], and TetO-H2B-GFP (Tg(tetO-HIST1H2BJ/GFP)47Efu/J)[22] mice were obtained from The Jackson Laboratory. All alleles were heterozygous, except where stated.
For lineage tracing studies, Axin2-CreERT2;Rosa26-mTmGflox mice aged 8–12 weeks of age received intraperitoneal injections of tamoxifen (Sigma, 4mg/25 grams mouse weight) dissolved in 10% ethanol/corn oil (Sigma) either once or on five consecutive days. Representative figures of Axin2-CreERT2;Rosa26–mTmGflox lineage tracing (Figure 1a–l, figure 2a–c) are from n = 5 animals per time point. Quantification of area of labeled hepatocytes (Figure 1o) performed on Axin2-CreERT2/Rosa26-mTmGflox mice given 5 daily doses of tamoxifen and lineage traced.
For label dilution studies: Axin2-rtTA;TetO-H2B-GFP mice aged 8–12 weeks old received doxycycline hyclate (Sigma, 1mg/mL) in drinking water for 7 days, then chased for 0, 14, 28, 56 or 84 days. Representative figures of Axin2rtTA;TetO-H2B-GFP label dilution (Figure 3b–3d) are from n = 4 animals per time point.
For endothelial cell conditional knockout of Wntless: VE-cadherin-CreERT2;Wlsflox mice (Wls f/f and Wls f/+) aged 8–10 weeks of age received intraperitoneal injections of tamoxifen on five consecutive days and sacrificed 7 days after last dose of tamoxifen. For proliferation studies (Figure 6g), mice were given 7 consecutive daily doses of EdU after last dose of tamoxifen and sacrificed 2 hours after last EdU dose.
All animal experiments and methods were approved by the Institutional Animal Care and Use Committee at Stanford University. Mice used in this study were age- and gender-matched littermates including both sexes. All mice were housed in the animal facility of Stanford University on a 12-h light/dark cycle with ad libitum access to water and normal chow except when otherwise indicated.
Statistics
The statistical analysis used to measure significance is the two-tailed unpaired Student’s T-test. The G*Power calculator (G*Power 3.1.9.2) was used for sample size calculations. For an alpha probability of 0.05, a beta probability of 0.8, expected observed differences between the two comparison groups of 50% and assuming 15% standard error of the mean within each group, the sample size required to detect a statistically significant difference is 4 animals per group.
Liver histology and immunofluorescence
Mouse livers were fixed in 4% PFA overnight at 4 °C, cryoprotected in 30% sucrose for 24 hours at 4 °C then embedded in OCT and snap frozen. All immunofluorescence staining was performed in the dark. Cryosections (10 μm) were incubated in blocking buffer (5% Normal Donkey Serum, 0.5% Triton-X in PBS) at room temperature and stained with primary and secondary antibodies, then mounted in Prolong Gold with DAPI mounting medium (Life Technologies). The following primary antibodies were used: GFP (chicken, 1:500, Abcam ab13970), glutamine synthetase (GS) (mouse, 1:500, Millipore MAB302), carbamoyl-phosphate synthase 1 (CPS) (rabbit, 1:100, kind gift from Wouter Lamers, Netherlands), EpCAM (rabbit, 1:100, Developmental Studies Hybridoma Bank, clone g8.8), HNF4α (rabbit, 1:100, Santa Cruz Biotechnology sc-8987).
Hepatocyte proliferation assay
Hepatocyte proliferation in vivo was measured by 5-ethynyl-2′-deoxyuridine (EdU) uptake. Briefly, mice received a dose of intraperitoneal EdU (Life Technologies, 50mg per kg mouse weight) daily for 7 days and harvested half a day after the final EdU dose. For EdU detection, cryosections were first stained with the appropriated primary and secondary antibodies, then incubated with the reagents in the Click-iT EdU Alexa Fluor 555 Imaging Kit (Life Technologies) prepared according to manufacturer’s instructions and mounted in Prolong Gold with DAPI mounting medium.
Liver cell isolation and flow cytometry
Hepatocytes and liver endothelial cells were isolated from mice by a two-step collagenase perfusion technique with modifications. Briefly, after the inferior vena cava was cannulated and portal vein was cut, the liver was perfused at 10 ml/min through the inferior vena cava with Liver Perfusion Medium (Invitrogen) at 37 °C for 10 min, followed by perfusion with collagenase type IV (Wellington) for an additional 10 min. The liver was dissociated and passed through a 70 μm filter. Hepatocytes were separated from non-parenchymal cells (NPCs) by low-speed centrifugation (30g × 3 min × 3), and further purified by Percoll gradient centrifugation as previously described[43]. NPCs were pelleted from supernatant by centrifugation (1200 rpm × 5 min × 3) and then stained with cell surface markers for endothelial cell isolation and flow cytometric analysis as previously described[26].
Cells were analysed on FACS ARIA II (BD). Data were processed with FACSDiva 8.0 software (BD) and FlowJo v10 (FlowJo). Doublets were excluded by FSC-W × FSC-H and SSC-W X SSC-H analysis. Single-stained channels were used for compensation and fluorophore minus one controls were used for gating. The following antibodies were used: CD31-PE (eBioscience 12-0311-81), CD34-FITC (eBioscience 11-0341-85), Rat VEGFR3 (kind gift from Bi-Sen Ding) with anti-rat Alexa Fluor 647 secondary (Jackson Immuno 712-605-153). Sinusoidal endothelial cells equals VEGFR3+CD31+CD34− cells. Central vein endothelial cells equals VEGFR3−CD31+CD34+ cells.
Hepatocyte ploidy measurement
Hepatocyte ploidy staining was performed as previously described[32]. Wildtype FVB mice were used for baseline hepatocyte ploidy measurements. For ploidy measurement of Axin2+ hepatocytes, Axin2-CreERT2;Rosa26-mTmGflox mice were given 5 daily doses of tamoxifen (4mg/25 gram body weight) and cells were isolated 2 days or 1 year after the last dose of tamoxifen and stained with Hoechst 33342 (Invitrogen). Cells were analysed on FACS ARIA II (BD). Data were processed with FACSDiva 8.0 software (BD) and FlowJo v10. FACS plots (Figure 4a and 4b) are representative ploidy plots from n = 5 wildtype animals and n = 3 Axin2-CreERT2; Rosa26-mTmGflox mice respectively.
Real-time RT-PCR analysis
Liver endothelial cells were FACS sorted as described above. Cells were homogenized using QIAshredder (Qiagen) and total RNA was purified using an RNeasy mini kit (Qiagen) according to manufacturer’s instructions. The total RNA was reverse-transcribed using random primers (High Capacity cDNA Reverse Transcription kit, Life Technologies). Gene expression was then assayed by real-time PCR using TaqMan Gene Expression Assays (Applied Biosystems) on an ABI 7900HT real-time PCR system. The following TaqMan probes were used: Axin2 (Mm00443610), Wnt1 (Mm01300555), Wnt2 (Mm00470018), Wnt9b (Mm00457102).
RNAscope in situ hybridization
Paraffin embedded liver sections (5 μm) were processed for RNA in situ detection using the RNAscope 2-plex Detection Kit (Chromogenic) according to the manufacturer’s instructions (Advanced Cell Diagnostics)[43]. RNAscope probes used were: Axin2 (NM 015732, region 330-1287), GS (NM 008131, region 103-973), Wnt2 (NM 023653, region 857-2086), Wnt9b (NM 011719, region 727-1616), PECAM1 (NM 001032378, region 915-1827), Tbx3 (NM 198052).
Representative figures of in situ hybridization of Tbx3 (Figure 2d), Wnt2, Wnt9b and Pecam1 (Figure 5a–d) are from n = 5 wildtype B6 mice age 8 weeks.
Representative figures of in situ hybridization from VE-cadherin-CreERT2;Wlsflox studies (Figure 6a, b, d, e) are from n = 5 mice from each group.
Microscope image acquisition and quantification
All sections were imaged using the Axioplan 2 microscope, the AxioCam MRm (fluorescence) and MRC5 (bright field) cameras and using Axiovision AC software (Release 4.8, Carl Zeiss). Image acquisitions were done at room temperature using X10 NA 0.3, X20 NA 0.5, and X40 NA 0.75 EC Plan-Neofluar objectives. Co-localization images were obtained using confocal microscopy using a Leica SP5 confocal detection system fitted on a Leica DMI6000 inverted microscope equipped with a x20 NA 0.75 HC PL Apochromat glycerol immersion objective, X40 NA 1.3 HCX PL Apochromat oil immersion objective (Leica) and using Leica LAS AF system software. For fluorescence area quantification, tiled images of entire liver sections were acquired using a Zeiss Cell Observer Spinning Disc confocal system on an Axio Observer.Z1 inverted microscope with Zen 2012 software (blue edition). Image acquisitions were done at room temperature using X20 NA 0.5 EC Plan-Neofluar objective.
Tiled images were stitched together in Zen 2012 (blue edition) and quantified using ImageJ. For some images, contrast, color and dynamic range were globally adjusted in Adobe Photoshop (Adobe Systems). Nuclei for EdU-labeled and total cell counts were quantified using ImageJ. Thresholding and watershed transforms were used. Pericentral hepatocytes were identified with either GFP (in Axin2-CreERT2;Rosa26-mTmGflox mice) or GS (in wildtype or VE-cadherin-CreERT2;Wlsflox mice). GFP+ and GS+ cells were quantified manually. Axin2 and GS in situ images were quantified with RNAscope SpotStudio software (version 1.0, Advanced Cell Diagnostics)[44].
RNAseq analysis
Using hepatocytes isolated from Axin2-rtTA;TetO-H2B-GFP animals, GFP+ and GFP− cells from 3 animals were sorted using FACS. Cells were lysed in Trizol (Life Technologies) and treated with chloroform. The aqueous layer was precipitated with ethanol and RNA was isolated with QIAGEN RNAeasy Mini kit following the manufacturer’s instructions. cDNA barcoded libraries were made using the TruSeq Stranded mRNA Sample Prep Kit (Illumina) following the manufacturer’s instructions. Samples were sequenced on an Illumina HiSeq 2000 instrument (three samples per lane, 100bp paired-end reads) to yield >50 million reads per sample.
Processing and analysis of FASTQ files were performed using Galaxy[45]. A custom Galaxy instance (UC Davis Bioinformatics Core) was run on Amazon AWS. Removal of adapter contamination and quality trimming were performed using Scythe v1.21 (https://github.com/ucdavis-bioinformatics/scythe) and Sickle v1.21 (https://github.com/ucdavis-bioinformatics/sickle). TopHat v2.0.11[46] was used to align reads to the mouse mm10 assembly, and Cuffdiff v.2.2.2[47] was used for differential gene expression analysis.
The data discussed in this publication have been deposited in NCBI’s Gene Expression Omnibus[48] and are accessible through GEO Series accession number GSE68806 (http://www.hcbi.nlm.nih.gov/geo/query/acc.cgi?acc=GSE68806).
Extended Data
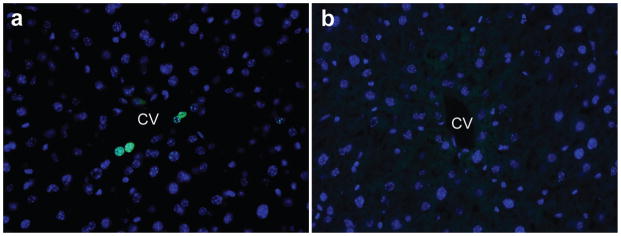
Extended figure 1. Leakiness in Axin2-CreERT2;Rosa26-mTmGflox mice is not observed in corn oil injected animals.
No GFP labeling is seen in Axin2-CreERT2;Rosa26-mTmGflox mice after a single dose of corn oil and traced for two days (a) or 365 days (c). No GFP labeling is seen after five consecutive daily doses of corn oil and traced for seven days (b) or 365 days (d). All animals were 8 week old Axin2-CreERT2;Rosa26-mTmGflox mice. Images are representative images from n = 5 mice per condition and time point. CV = central vein, PV = portal vein. Scale bars: 100 μm.
Extended figure 2. Axin2 expression remains restricted to pericentral cells.
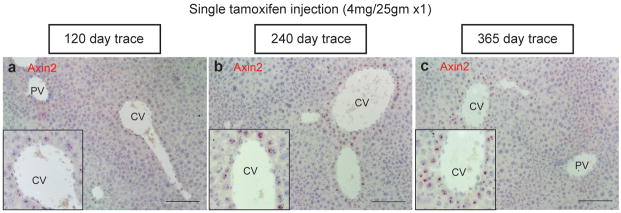
In situ hybridization for Axin2 in (a) 120 day trace, (b) 240 day trace and (c) 365 day trace Axin2-CreERT2;Rosa26-mTmGflox mice. Representative in situ images are from n = 5 animals per time point. CV = central vein, PV = portal vein. Scale bars: 100 μm.
Extended figure 3. Descendants of Axin2+ cells replaced 30% of the area of the liver.
Tiled image of entire liver section of a 365 day trace Axin2-CreERT2;Rosa26-mTmGflox mice. Image is representative of n = 5 animals at this time point.
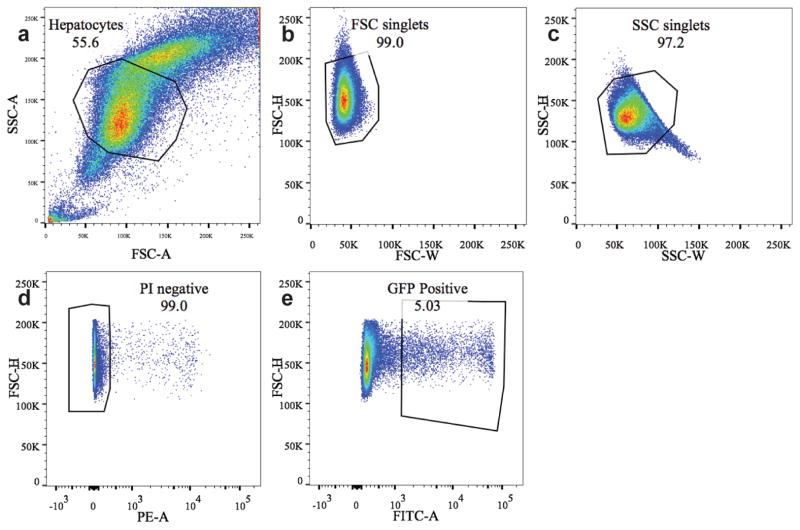
Extended figure 4. FACS sorting gates for GFP+ cells in Axin2-rtTA;TetO-H2B-GFP mice.
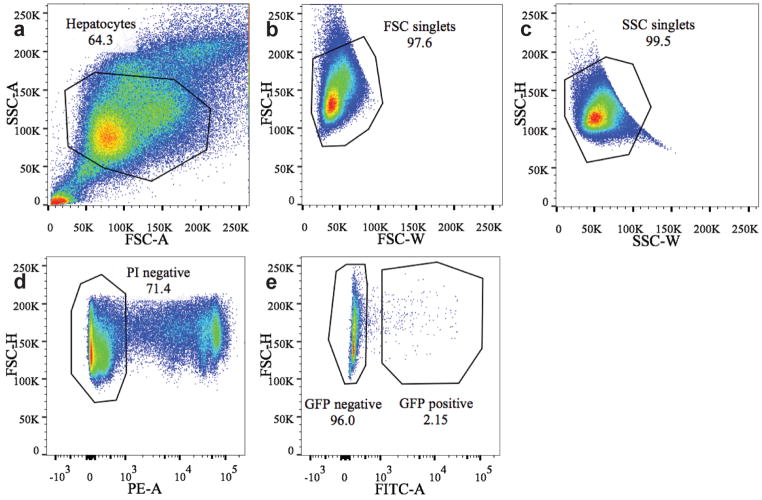
8 week old Axin2-rtTA;TetO-H2B-GFP mice were labeled with doxycycline for 7 days and chased for various lengths of time. Hepatocytes were enzymatically dispersed and sorted by FACS. Successive gating shows sequential selection of (a) all hepatocytes, (b) single cells by forward scatter, (c) side scatter. d, Dead cells were excluded by propidium iodide labeling. e, GFP positive cells were gated and either sorted for RNAseq analysis or further graphed as histograms for GFP intensity analysis (see figure 3g).
Extended figure 5. Axin2 gene dosage and tamoxifen have no effect on pericentral hepatocyte proliferation rate.
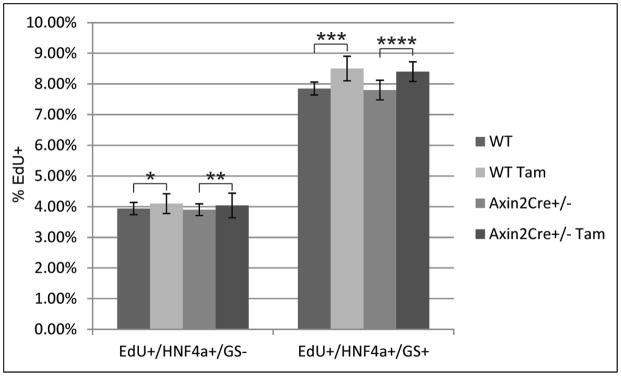
WT and Axin2CreERT2+/− mice were given EdU daily for seven days. A subset of WT and Axin2CreERT2+/− mice was given 4mg/25gram body weight of tamoxifen daily for 5 days. Pericentral hepatocytes were identified by HNF4α+/GS+ staining. All other hepatocytes were identified by HNF4α+/GS− antibody staining. The EdU positive rates within the two hepatocyte populations as a percentage of total HNF4a+ cells were essentially the same regardless of Axin2 gene dosage or tamoxifen administration. n = 5 animals per group. Data represent mean ± s.e.m. *, **, ***, **** p > 0.05.
Extended figure 6. Axin2+ hepatocytes proliferate rapidly.
Axin2-rtTA;TetO-H2B-GFP mice were given doxycycline for 7 days. a, 56 days after cessation of doxycycline, very few GFP+ cells are seen around the central vein. b, After 84 days, no GFP+ cells are seen. Images are representative of n = 4 animals per time point.
Extended figure 7. FACS sorting gates for GFP+ cells in Axin2-CreERT2;Rosa26-mTmGflox mice for ploidy analysis.
8 week old Axin2-CreERT2;Rosa26-mTmGflox mice were labeled with five daily doses of tamoxifen and traced for seven days. Hepatocytes were enzymatically dispersed and sorted by FACS. Successive gating show sequential selection of (a) all hepatocytes, (b) single cells by forward scatter, (c) side scatter. d, Dead cells were excluded by propidium iodide labeling. e, GFP positive cells were gated and graphed as histograms for Hoechst staining (see figure 4).
Extended figure 8. FACS sorting gates for endothelial cells.
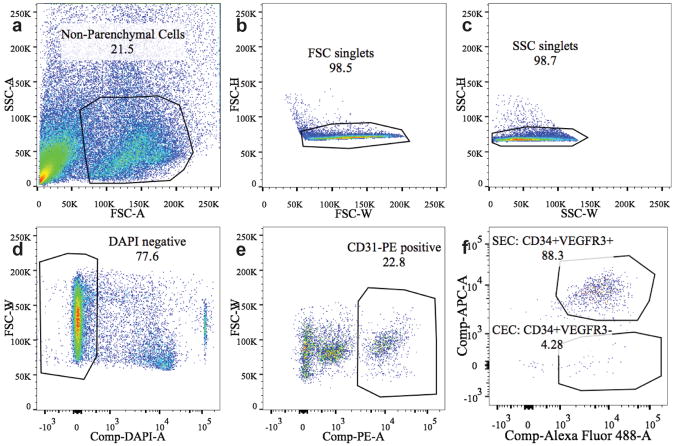
8 week old wildtype C57B6 mice were used for endothelial cell isolation. Livers were enzymatically digested, hepatocytes were removed by centrifugation and nonparenchymal cells were antibody stained and sorted by FACS. Successive gating showed sequential selection of (a) non-parenchymal cells by size, (b) single cells by forward scatter, (c) side scatter. d, Dead cells were excluded by DAPI labeling. e, endothelial cells were identified by CD31-PE positive staining. f, Sinusoidal endothelial cells (SEC) were identified as CD34-FITC+ VEGFR3-APC+ while central vein endothelial cells (CEC) were identified as CD34-FITC+VEGFR3-APC−.
Extended figure 9. Histology of VE-cadherin-CreERT2;Wlsflox/flox animal versus control.
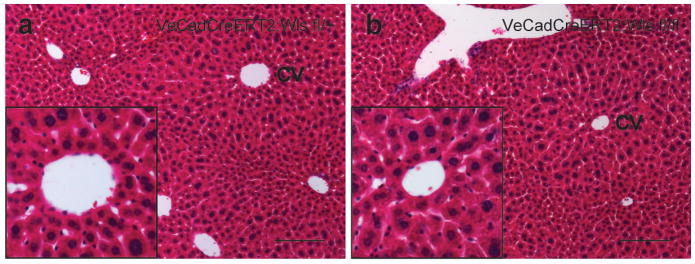
a, Control (VE-cadherin-CreERT2;Wlsflox/+) animals given 5 daily doses of tamoxifen and traced for 7 days after the last tamoxifen dose. H&E of the liver shows normal histology. b, Wls knockout animals (VE-cadherin-CreERT2;Wlsflox/flox) also showed normal liver histology. Images are representative images from n = 5 animals per group. Insets show central veins. Scale bars = 100 μm.
Extended table 1. Partial list of differentially expressed genes in Axin2+ vs Axin2− hepatocytes by RNAseq analysis.
Cells were isolated from Axin2-rtTA;TetO-H2B-GFP mice after labeling with doxycycline. Genes preferentially expressed in Axin2+ hepatocytes are indicated by negative log2 ratios and genes preferentially expressed in Axin2- hepatocytes are indicated by positive log2 ratios. q-value (false discovery rate-adjusted p-value) of <0.05 used to determine significance.
| Differentially expressed genes: | Log2(fold_change): | q-value: |
|---|---|---|
| Pericentral: | ||
| Glutamine synthetase (Glul) | −2.58912 | 0.00961319 |
| Leukocyte cell-derived chemotaxin 2 (Lect2) | −1.85582 | 0.00961319 |
| Axin2 | −1.96625 | 0.00961319 |
| B glycoprotein (Rhbg) | −3.1865 | 0.00961319 |
| Cytochrome P450 la2 (Cypla2) | −2.02709 | 0.00961319 |
| T-box transcription factor 3 (Tbx3) | −1.26286 | 0.0380302 |
| Periportal: | ||
| Asparaginase (Aspg) | 1.25545 | 0.0441798 |
| Glutaminase 2 (Gls2) | 1.53395 | 0.0441798 |
Acknowledgments
These studies were supported by the Howard Hughes Medical Institute and a grant from the Reed-Stinehart foundation. R.N. is an investigator with the Howard Hughes Medical Institute. B.W. was supported by F32DK091005. We thank Drs. D. Montgomery Bissell and Tushar Desai for helpful comments on the manuscript, Verena Waehle for assistance in preparing RNA samples for RNAseq, Dr. Monica Britton for RNAseq analysis and Patty Lovelace for assistance with FACS.
Footnotes
Supplementary Information:
Is linked to the online version of the paper at www.nature.com/nature.
Author Contributions:
B.W. carried out the experiments. D.Z. performed qRT-PCR analysis. M.F. performed in situ hybridization. C.Y.L performed RNAseq analysis. B.W and R.N. designed the study, analysed data and wrote the paper. All authors discussed the results and commented on the manuscript. The data discussed in this publication have been deposited in NCBI’s Gene Expression Omnibus and are accessible through GEO Series accession number GSE68806 (http://www.hcbi.nlm.nih.gov/geo/query/acc.cgi?acc=GSE68806).
The authors declare no competing financial interests.
Reference list
- 1.Malato Y, et al. Fate tracing of mature hepatocytes in mouse liver homeostasis and regeneration. J Clin Invest. 2011;121(12):4850–60. doi: 10.1172/JCI59261. [DOI] [PMC free article] [PubMed] [Google Scholar]
- 2.Yanger K, et al. Adult hepatocytes are generated by self-duplication rather than stem cell differentiation. Cell Stem Cell. 2014;15(3):340–9. doi: 10.1016/j.stem.2014.06.003. [DOI] [PMC free article] [PubMed] [Google Scholar]
- 3.Miyajima A, Tanaka M, Itoh T. Stem/Progenitor Cells in Liver Development, Homeostasis, Regeneration, and Reprogramming. Cell Stem Cell. 2014;14(5):561–574. doi: 10.1016/j.stem.2014.04.010. [DOI] [PubMed] [Google Scholar]
- 4.Jungermann K, Kietzmann T. Zonation of parenchymal and nonparenchymal metabolism in liver. Annu Rev Nutr. 1996;16:179–203. doi: 10.1146/annurev.nu.16.070196.001143. [DOI] [PubMed] [Google Scholar]
- 5.Ganem NJ, Pellman D. Limiting the proliferation of polyploid cells. Cell. 2007;131(3):437–40. doi: 10.1016/j.cell.2007.10.024. [DOI] [PubMed] [Google Scholar]
- 6.Sigal SH, et al. Partial hepatectomy-induced polyploidy attenuates hepatocyte replication and activates cell aging events. Am J Physiol. 1999;276(5 Pt 1):G1260–72. doi: 10.1152/ajpgi.1999.276.5.G1260. [DOI] [PubMed] [Google Scholar]
- 7.DasGupta R, Fuchs E. Multiple roles for activated LEF/TCF transcription complexes during hair follicle development and differentiation. Development. 1999;126(20):4557–68. doi: 10.1242/dev.126.20.4557. [DOI] [PubMed] [Google Scholar]
- 8.Zeng YA, Nusse R. Wnt Proteins Are Self-Renewal Factors for Mammary Stem Cells and Promote Their Long-Term Expansion in Culture. Cell Stem Cell. 2010;6(6):568–577. doi: 10.1016/j.stem.2010.03.020. [DOI] [PMC free article] [PubMed] [Google Scholar]
- 9.Barker N, et al. Identification of stem cells in small intestine and colon by marker gene Lgr5. Nature. 2007;449(7165):1003–7. doi: 10.1038/nature06196. [DOI] [PubMed] [Google Scholar]
- 10.Lim X, et al. Interfollicular epidermal stem cells self-renew via autocrine Wnt signaling. Science. 2013;342(6163):1226–30. doi: 10.1126/science.1239730. [DOI] [PMC free article] [PubMed] [Google Scholar]
- 11.Clevers H, Loh KM, Nusse R. Stem cell signaling. An integral program for tissue renewal and regeneration: Wnt signaling and stem cell control. Science. 2014;346(6205):1248012. doi: 10.1126/science.1248012. [DOI] [PubMed] [Google Scholar]
- 12.Lustig B, et al. Negative Feedback Loop of Wnt Signaling through Upregulation of Conductin/Axin2 in Colorectal and Liver Tumors. Molecular and Cellular Biology. 2002;22(4):1184–1193. doi: 10.1128/MCB.22.4.1184-1193.2002. [DOI] [PMC free article] [PubMed] [Google Scholar]
- 13.van Amerongen R, Bowman AN, Nusse R. Developmental stage and time dictate the fate of Wnt/beta-catenin-responsive stem cells in the mammary gland. Cell Stem Cell. 2012;11(3):387–400. doi: 10.1016/j.stem.2012.05.023. [DOI] [PubMed] [Google Scholar]
- 14.Benhamouche S, et al. Apc Tumor Suppressor Gene Is the “Zonation-Keeper” of Mouse Liver. Developmental Cell. 2006;10(6):759–770. doi: 10.1016/j.devcel.2006.03.015. [DOI] [PubMed] [Google Scholar]
- 15.Huch M, et al. In vitro expansion of single Lgr5+ liver stem cells induced by Wnt-driven regeneration. Nature. 2013;494(7436):247–50. doi: 10.1038/nature11826. [DOI] [PMC free article] [PubMed] [Google Scholar]
- 16.Cadoret A, et al. New targets of beta-catenin signaling in the liver are involved in the glutamine metabolism. Oncogene. 2002;21(54):8293–301. doi: 10.1038/sj.onc.1206118. [DOI] [PubMed] [Google Scholar]
- 17.Braeuning A, et al. Differential gene expression in periportal and perivenous mouse hepatocytes. FEBS J. 2006;273(22):5051–61. doi: 10.1111/j.1742-4658.2006.05503.x. [DOI] [PubMed] [Google Scholar]
- 18.Han J, et al. Tbx3 improves the germ-line competency of induced pluripotent stem cells. Nature. 2010;463(7284):1096–100. doi: 10.1038/nature08735. [DOI] [PMC free article] [PubMed] [Google Scholar]
- 19.Suzuki A, et al. Tbx3 controls the fate of hepatic progenitor cells in liver development by suppressing p19ARF expression. Development. 2008;135(9):1589–95. doi: 10.1242/dev.016634. [DOI] [PubMed] [Google Scholar]
- 20.Moreira PI, et al. Estradiol affects liver mitochondrial function in ovariectomized and tamoxifen-treated ovariectomized female rats. Toxicol Appl Pharmacol. 2007;221(1):102–10. doi: 10.1016/j.taap.2007.02.006. [DOI] [PubMed] [Google Scholar]
- 21.Yu HM, et al. Impaired neural development caused by inducible expression of Axin in transgenic mice. Mech Dev. 2007;124(2):146–56. doi: 10.1016/j.mod.2006.10.002. [DOI] [PMC free article] [PubMed] [Google Scholar]
- 22.Tumbar T. Defining the Epithelial Stem Cell Niche in Skin. Science. 2004;303(5656):359–363. doi: 10.1126/science.1092436. [DOI] [PMC free article] [PubMed] [Google Scholar]
- 23.Guidotti JE, et al. Liver cell polyploidization: a pivotal role for binuclear hepatocytes. J Biol Chem. 2003;278(21):19095–101. doi: 10.1074/jbc.M300982200. [DOI] [PubMed] [Google Scholar]
- 24.Comai L. The advantages and disadvantages of being polyploid. Nat Rev Genet. 2005;6(11):836–46. doi: 10.1038/nrg1711. [DOI] [PubMed] [Google Scholar]
- 25.Ohlstein B, Spradling A. The adult Drosophila posterior midgut is maintained by pluripotent stem cells. Nature. 2006;439(7075):470–4. doi: 10.1038/nature04333. [DOI] [PubMed] [Google Scholar]
- 26.Ding BS, et al. Inductive angiocrine signals from sinusoidal endothelium are required for liver regeneration. Nature. 2010;468(7321):310–315. doi: 10.1038/nature09493. [DOI] [PMC free article] [PubMed] [Google Scholar]
- 27.Banziger C, et al. Wntless, a conserved membrane protein dedicated to the secretion of Wnt proteins from signaling cells. Cell. 2006;125(3):509–22. doi: 10.1016/j.cell.2006.02.049. [DOI] [PubMed] [Google Scholar]
- 28.Monvoisin A, et al. VE-cadherin-CreERT2 transgenic mouse: a model for inducible recombination in the endothelium. Dev Dyn. 2006;235(12):3413–22. doi: 10.1002/dvdy.20982. [DOI] [PubMed] [Google Scholar]
- 29.Carpenter AC, et al. Generation of mice with a conditional null allele for Wntless. genesis. 2010;48(9):554–8. doi: 10.1002/dvg.20651. [DOI] [PMC free article] [PubMed] [Google Scholar]
- 30.Magami Y, et al. Cell proliferation and renewal of normal hepatocytes and bile duct cells in adult mouse liver. Liver. 2002;22(5):419–25. doi: 10.1034/j.1600-0676.2002.01702.x. [DOI] [PubMed] [Google Scholar]
- 31.Zajicek G, Schwartz-Arad D. Streaming liver. VII: DNA turnover in acinus zone-3. Liver. 1990;10(3):137–40. doi: 10.1111/j.1600-0676.1990.tb00448.x. [DOI] [PubMed] [Google Scholar]
- 32.Duncan AW, et al. The ploidy conveyor of mature hepatocytes as a source of genetic variation. Nature. 2010;467(7316):707–10. doi: 10.1038/nature09414. [DOI] [PMC free article] [PubMed] [Google Scholar]
- 33.Niehrs C, Acebron SP. Mitotic and mitogenic Wnt signalling. EMBO J. 2012;31(12):2705–13. doi: 10.1038/emboj.2012.124. [DOI] [PMC free article] [PubMed] [Google Scholar]
- 34.Vijayakumar S, et al. High-frequency canonical Wnt activation in multiple sarcoma subtypes drives proliferation through a TCF/beta-catenin target gene, CDC25A. Cancer Cell. 2011;19(5):601–12. doi: 10.1016/j.ccr.2011.03.010. [DOI] [PMC free article] [PubMed] [Google Scholar]
- 35.Tan X, et al. β-Catenin deletion in hepatoblasts disrupts hepatic morphogenesis and survival during mouse development. Hepatology. 2008;47(5):1667–1679. doi: 10.1002/hep.22225. [DOI] [PMC free article] [PubMed] [Google Scholar]
- 36.Zajicek G, Oren R, Weinreb M., Jr The streaming liver. Liver. 1985;5(6):293–300. doi: 10.1111/j.1600-0676.1985.tb00252.x. [DOI] [PubMed] [Google Scholar]
- 37.Ludtke TH, et al. Tbx3 promotes liver bud expansion during mouse development by suppression of cholangiocyte differentiation. Hepatology. 2009;49(3):969–78. doi: 10.1002/hep.22700. [DOI] [PubMed] [Google Scholar]
- 38.Laurent-Puig P, Zucman-Rossi J. Genetics of hepatocellular tumors. Oncogene. 2006;25(27):3778–86. doi: 10.1038/sj.onc.1209547. [DOI] [PubMed] [Google Scholar]
- 39.Wang R, et al. Activation of the Met receptor by cell attachment induces and sustains hepatocellular carcinomas in transgenic mice. J Cell Biol. 2001;153(5):1023–34. doi: 10.1083/jcb.153.5.1023. [DOI] [PMC free article] [PubMed] [Google Scholar]
- 40.Tward AD, et al. Distinct pathways of genomic progression to benign and malignant tumors of the liver. Proceedings of the National Academy of Sciences. 2007;104(37):14771–14776. doi: 10.1073/pnas.0706578104. [DOI] [PMC free article] [PubMed] [Google Scholar]
- 41.Schwarze PE, et al. Emergence of a population of small, diploid hepatocytes during hepatocarcinogenesis. Carcinogenesis. 1984;5(10):1267–75. doi: 10.1093/carcin/5.10.1267. [DOI] [PubMed] [Google Scholar]
- 42.Muzumdar MD, et al. A global double-fluorescent Cre reporter mouse. genesis. 2007;45(9):593–605. doi: 10.1002/dvg.20335. [DOI] [PubMed] [Google Scholar]
- 43.Kreamer BL, et al. Use of a low-speed, iso-density percoll centrifugation method to increase the viability of isolated rat hepatocyte preparations. In Vitro Cell Dev Biol. 1986;22(4):201–11. doi: 10.1007/BF02623304. [DOI] [PubMed] [Google Scholar]
- 44.Wang F, et al. RNAscope: a novel in situ RNA analysis platform for formalin-fixed, paraffin-embedded tissues. J Mol Diagn. 2012;14(1):22–9. doi: 10.1016/j.jmoldx.2011.08.002. [DOI] [PMC free article] [PubMed] [Google Scholar]
- 45.Goecks J, et al. Galaxy: a comprehensive approach for supporting accessible, reproducible, and transparent computational research in the life sciences. Genome Biol. 2010;11(8):R86. doi: 10.1186/gb-2010-11-8-r86. [DOI] [PMC free article] [PubMed] [Google Scholar]
- 46.Kim D, et al. TopHat2: accurate alignment of transcriptomes in the presence of insertions, deletions and gene fusions. Genome Biol. 2013;14(4):R36. doi: 10.1186/gb-2013-14-4-r36. [DOI] [PMC free article] [PubMed] [Google Scholar]
- 47.Trapnell C, et al. Differential analysis of gene regulation at transcript resolution with RNA-seq. Nat Biotechnol. 2013;31(1):46–53. doi: 10.1038/nbt.2450. [DOI] [PMC free article] [PubMed] [Google Scholar]
- 48.Edgar R, Domrachev M, Lash AE. Gene Expression Omnibus: NCBI gene expression and hybridization array data repository. Nucleic Acids Res. 2002;30(1):207–10. doi: 10.1093/nar/30.1.207. [DOI] [PMC free article] [PubMed] [Google Scholar]


