Abstract
We report on an optical noncontact method for the detection of soft-tissue tumors based on the measurement of their elasticity. A focused air-puff system is used to excite surface waves (SWs) on soft tissues with transient static pressure. A high-speed phase-sensitive optical coherence tomography system is used to measure the SWs as they propagate from the point of excitation. To evaluate the stiffness of soft tissues, the Young's modulus is quantified based on the group velocity of SWs. Pilot experiments were performed on ex vivo human myxoma and normal fat. Results demonstrate the feasibility of the proposed method to measure elasticity and differentiate soft-tissue tumors from normal tissues.
During surgical treatment of soft-tissue tumors, real-time accurate assessment of resection margins is required to reduce the chance of local recurrence [1]. It is well known that tumorigenesis involves change in mechanical properties of tissue [2]. Thus, besides the structural imaging of tissues, determining the mechanical properties of tissue can be an efficient way to accurately differentiate tumors from normal surrounding tissues.
Several noninvasive imaging techniques have been proposed for the detection of tumors based on the assessment of tissue elastic properties. Magnetic resonance elastography (Sinkus et al.) and ultrasonic elasticity imaging (Pellot-Barakat et al.) have been demonstrated to be efficient methods for in vivo detection of human breast tumors [3,4]. However, relatively low spatial resolution of ultrasonic imaging and magnetic resonance imaging limits these two methods to operate with the organ-level resolution. Optical coherence tomography (OCT) provides high spatial and temporal resolution with imaging depth of 2–3 mm in most highly scattering tissues. The feasibility for image-guided surgery using OCT has been studied by Boppart et al. [5]. Based on OCT, Liang et al. have developed a microscale dynamic optical coherence elastography system and differentiated tumor and normal regions of ex vivo human breast with a distribution map of tissue biomechanical properties [6]. However, measurement with this dynamic excitation system requires direct tissue contact with a wave drive and determination of elastic modulus requires solving wave equations, which is computationally expensive.
In this Letter, we present a noncontact method to measure the elasticity of soft tissues for the detection of soft-tissue tumors. In our method, transient static pressure on tissue surface is generated by a focused air-puff system that excites surface waves (SWs), which propagate in the superficial layer of soft tissues. We use a high-speed phase-sensitive optical coherence tomography (PhS-OCT) system to measure the SWs as they propagate from the point of excitation. The group velocity of SWs is calculated and used to quantify the Young's modulus of soft tissues with a direct relationship. Our results suggest that through comparing the elastic property of normal and pathological tissues, the detection of soft-tissue tumors can be achieved.
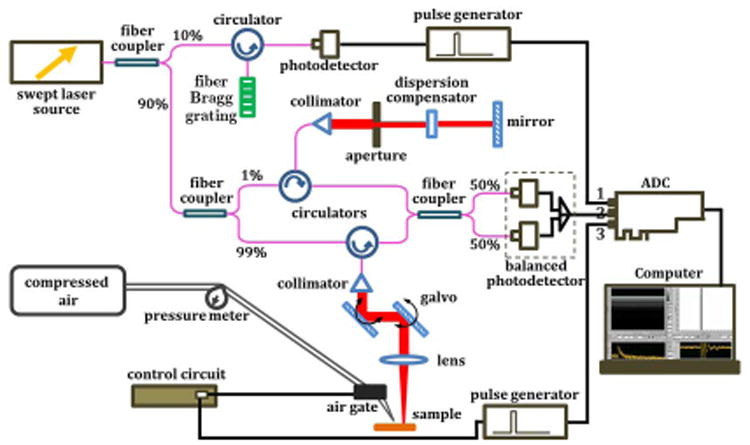
The system developed for this method is composed of two parts: the SWs excitation unit and the measurement unit. The schematic of the system setup is shown in Fig. 1. A focused air-puff system induces mechanical waves on the surface of soft tissues by producing a transient air stream through a 0.15 mm port. The pressure from the air source was fixed at 8 psi during experiments. The time gating is realized by a circuit switch with a time period of 1 ms. A PhS-OCT system is used to measure the SWs. Briefly, the system utilizes a broadband swept source laser (Santec Inc.) with a wavelength range of 1310 ± 75 nm. The scanning rate over full operating wavelength range is 30 kHz. The interference fringes are detected by a balanced photodetector and recorded through an ADC (Alazar Technologies Inc.) for digitization. The k-space recalibration and phase-stabilization methods are discussed in our previous study with details [7]. The PhS-OCT system can offer a time resolution of 33 μs with a phase stability of 16 mrad, corresponding to around 3 nm detectable displacement. The synchronization between the air-puff system and the PhS-OCT system is reached by recording the pulse generated from the circuit switch through a separate channel of the ADC, and the system is triggered by a signal coming from fiber Bragg grating (see Fig. 1). The excitation-response process of SWs on the soft-tissue surface can be real-time monitored from the computer screen.
Fig. 1.

(Color online) Schematic of the system setup.
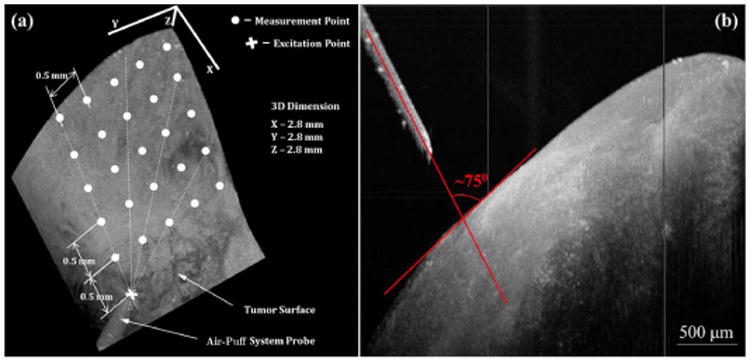
Figure 2(a) illustrates the measurement positions of SWs on soft tissues with a 3D OCT image recorded by PhS-OCT system, and Fig. 2(b) shows the excitation angle and distance between the air-puff port and tissue surface. Beside the point of excitation, measurement points are distributed with 0.5 mm/step (transverse distance) on the surface of soft tissue. The axial distance of two measurement points can be obtained from the change of surface position in tissue structure images. By modeling the tissue surface with first-order polynomials, the surface distance between two points of measurement can be calculated simply using the Pythagorean theorem. M-mode imaging is performed at the measurement points with the data recoding time of 7 s for each position. During each measurement, the air-puff excitation is conducted at least five times for statistical purpose.
Fig. 2.

(Color online) (a) 3D OCT image of the tissue illustrating the locations of excitation and SWs measurement. (b) Side view of (a) showing excitation angle and distance between the air-puff port and tissue surface.
Phase values are extracted over time from the positions of the first peaks (tissue surface) in intensity A-lines. The unwrapped phase profile with respect to time indicates the local vibration status of tissue surface, which represents the propagation of SWs on soft tissues. Thus, the group velocity of SWs can be calculated from the unwrapped phase profiles at the measurement points. Specifically, along the wave propagation [shown with dashed lines in Fig. 2(a)], the SWs possess time delays between any two adjacent measurement points, which can be calculated from the time difference between the troughs (or the peaks) of two or more SWs. The group velocity of SWs is calculated from the surface distance of the two points divided by the time delay.
Taking the soft tissues as elastic materials and assuming they are isotropic homogeneous, which ignores the possible effect of dispersion of SWs propagating in the soft tissues, the group velocity (υg) of SWs can be well related to the Young's modulus (E) of soft tissues [8,9]. The relationship between E and υg can be approximated as
| (1) |
where ρ and ν are the mass density and Poisson's ratio of soft tissues, respectively [10]. In our calculations, we use ρ = 950 kg/m3 for adipose tissue, and ρ = 1060 kg/m3 for other soft tissues [11]. As to the Poisson's ratio, ν = 0.49 is assumed during the quantification process [12].
To test the feasibility of the proposed method to measure the elasticity and differentiate soft-tissue tumors from normal tissues, ex vivo human myxoma and normal fat were used for our proof-of-concept experiments. After the measurement of elasticity, histological analyses were performed on the corresponding measurement regions. A pathologist conducted the classification of the tissue samples and made the diagnosis of the tissue types.
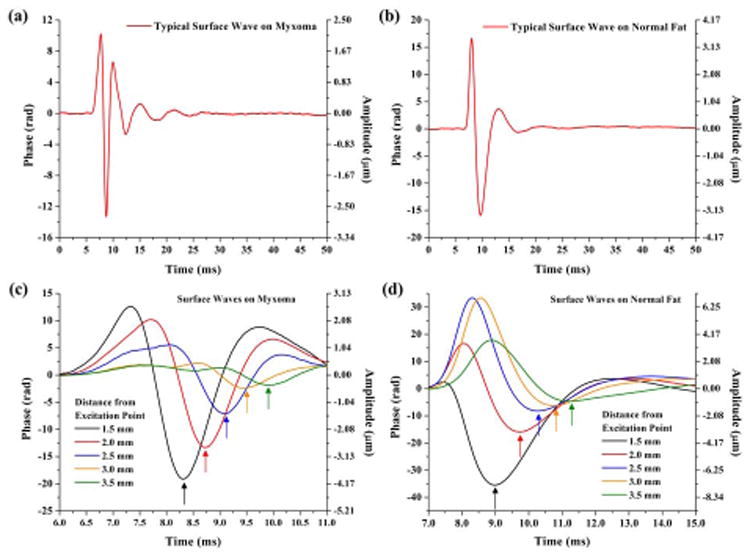
Figures 3(a) and 3(b) show the typical SWs induced by the air-puff excitation on myxoma and normal fat, respectively. It can be seen that the surfaces of the soft tissues return to the original positions with damped oscillations after the external air pressure disappears. This indicates both myxoma and normal fat exhibit elastic properties when compressed with the air puff. The time delays of SWs at different lateral positions detected on myxoma and normal fat are shown in Figs. 3(c) and 3(d), respectively. With the indication of the arrows, it is clear to see that the time delays between SWs are longer in normal fat than in myxoma.
Fig. 3.

(Color online) Typical SWs recorded on (a) myxoma and (b) normal fat; SWs recorded at different spatial locations showing time delays detected on (c) myxoma and (d) normal fat.
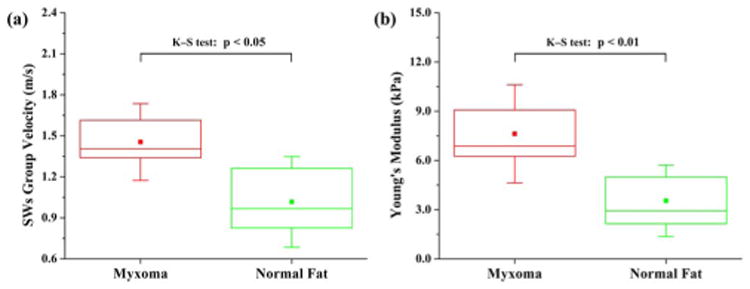
Figure 4(a) shows the group velocity calculated for the SWs on both types of soft tissues. The SWs on myxoma have a higher group velocity of 1.45 ± 0.28 m/s compared with 1.02 ± 0.33 m/s for normal fat. Based on Eq. (1), the Young's moduli of myxoma and normal fat have been quantified to be 7.6 ± 3.0 kPa and 3.5 ± 2.2 kPa, respectively. The distributions of the Young's modulus are shown in Fig. 4(b). From our results, the mean value (3.5 kPa) of the Young's modulus for normal fat agrees well with the results (mean value of 3.25 kPa) from Samani et al. who conducted the elasticity measurement of human normal fat from ex vivo samples [13]. Also, our estimated range of 3.5 ± 2.2 kPa for normal fat coincides with the range (0.5–5.6 kPa) reported previously with different elastography techniques for the Young's modulus of human adipose tissue [4,14,15]. This consistency demonstrates the feasibility of our method to successfully measure the elasticity of soft tissues. From Fig. 4(b), it is clear to see that myxoma possesses higher values of Young's modulus (around twice) than normal fat. This indicates the tissue of myxoma appears to have higher stiffness values, which is in accord with the fact that tumors are stiffer than normal tissue [16]. The two-sample Kolmogorov–Smirnov (K–S) tests performed on the results of group velocity and Young's modulus show the statistical significance of the difference in both the location and the shape of the data distribution, indicating the myxoma can be well differentiated from normal fat with the quantification of elasticity using the proposed method.
Fig. 4.

(Color online) Box plots of (a) the calculated group velocity of SWs and (b) the quantified Young's modulus for myxoma and normal fat; N = 13 and N = 12 for the measurements performed on myxoma and normal fat, respectively. The solid dots and whiskers represent the mean values and standard deviations of data, respectively.
In this Letter, for the first time to our knowledge, we demonstrate that the combination of OCT and a focused air-puff system can be used to measure the elasticity of soft tissues and detect soft-tissue tumors. In these experiments, the distance from the air-puff port to the tissue surface was ∼600 μm with an excitation angle of ∼75° between the air stream direction and the tissue surface [shown in Fig. 2(b)]. The changes of the excitation distance and direction do not affect the measurement results of the Young's modulus. Our supplementary experiments with different concentrations of gelatin phantoms (10%, 12%, 14% w/w, three samples for each) show good agreement between the Young's moduli measured using the proposed method and the reference values measured using uniaxial mechanical testing (data not shown). This comparison further proves the feasibility of our method in assessing the elasticity of soft tissues. Compared with elastography methods utilizing contact excitation [6], this noncontact method has clinical advantages when dealing with delicate soft tissues (e.g., lung, ocular, or brain tissues) where direct contact can cause injury or alter tissue properties through swelling or physical distortion. The described method could also supplement other non-contact excitation methods for tissue elasticity measurements (such as photoacoustic or ultrasound excitation [10,17]) with relatively simple and straightforward control over the excitation amplitude of SWs. However, only the superficial layers of soft tissues can be excited with the air-puff system described in this Letter.
Here we have demonstrated that the combination of a focused air-puff system and a PhS-OCT system can be used to measure the elasticity of soft tissues and differentiate soft-tissue tumors from normal tissues. With further development, this method is potentially useful for the resection margin detection during surgery and can complement structural imaging performed by OCT or other imaging modalities.
Acknowledgments
This study was supported in part by NIH grant 1R01EY022362 and Federal Target Program “Scientific and Scientific-Pedagogical Personnel of Innovative Russia” for 2009–2013 Grant 14.B37.21.1238.
References
- 1.Singer S, Antonescu CR, Riedel E, Brennan MF. Ann Surg. 2003;238:358. doi: 10.1097/01.sla.0000086542.11899.38. [DOI] [PMC free article] [PubMed] [Google Scholar]
- 2.Butcher DT, Alliston T, Weaver VM. Nat Rev Cancer. 2009;9:108. doi: 10.1038/nrc2544. [DOI] [PMC free article] [PubMed] [Google Scholar]
- 3.Pellot-Barakat C, Sridhar M, Lindfors KK, Insala MF. Curr Med Imag Rev. 2006;2:157. [Google Scholar]
- 4.Sinkus R, Lorenzen J, Schrader D, Lorenzen M, Dargatz M, Holz D. Phys Med Biol. 2000;45:1649. doi: 10.1088/0031-9155/45/6/317. [DOI] [PubMed] [Google Scholar]
- 5.Boppart SA, Luo W, Marks DL, Singletary KW. Breast Cancer Res Treat. 2004;84:85. doi: 10.1023/B:BREA.0000018401.13609.54. [DOI] [PubMed] [Google Scholar]
- 6.Liang X, Oldenburg AL, Crecea V, Chaney EJ, Boppart SA. Opt Express. 2008;16:11052. doi: 10.1364/oe.16.011052. [DOI] [PMC free article] [PubMed] [Google Scholar]
- 7.Manapuram RK, Aglyamov S, Menodiado FM, Mashiatulla M, Wang S, Baranov SA, Li J, Emelianov S, Larin KV. Laser Phys. 2012;22:1439. [Google Scholar]
- 8.Li C, Huang Z, Wang RK. Opt Express. 2011;19:10153. doi: 10.1364/OE.19.010153. [DOI] [PubMed] [Google Scholar]
- 9.Li C, Guan G, Cheng X, Huang Z, Wang RK. Opt Lett. 2012;37:722. doi: 10.1364/OL.37.000722. [DOI] [PubMed] [Google Scholar]
- 10.Li C, Guan G, Huang Z, Johnstone M, Wang RK. Opt Lett. 2012;37:1625. doi: 10.1364/OL.37.001625. [DOI] [PubMed] [Google Scholar]
- 11.Hubbell JH, Seltzer SM. NIST report NISTIR 5632. Radiation and Biomolecular Physics Division, Physical Measurement Laboratory, National Institute of Standards and Technology; 1989. Tables of X-ray mass attenuation coefficients and mass energy-absorption coefficients from 1 keV to 20 MeV for elements Z = 1 to 92 and 48 additional substances of dosimetric interest. [Google Scholar]
- 12.Chen EJ, Novakofski J, Jenkins WK, O'Brien JWD. IEEE Trans Ultrason Ferroelectr Freq Control. 1996;43:191. [Google Scholar]
- 13.Samani A, Zubovits J, Plewes D. Phys Med Biol. 2007;52:1565. doi: 10.1088/0031-9155/52/6/002. [DOI] [PubMed] [Google Scholar]
- 14.Samani A, Bishop J, Luginbuhl C, Plewes DB. Phys Med Biol. 2003;48:2183. doi: 10.1088/0031-9155/48/14/310. [DOI] [PubMed] [Google Scholar]
- 15.Nightingale K, McAleavey S, Trahey G. Ultrasound Med Biol. 2003;29:1715. doi: 10.1016/j.ultrasmedbio.2003.08.008. [DOI] [PubMed] [Google Scholar]
- 16.Paszek MJ, Zahir N, Johnson KR, Lakins JN, Rozenberg GI, Gefen A, Reinhart-King CA, Margulies SS, Dembo M, Boettiger D, Hammer DA, Weaver VM. Cancer Cell. 2005;8:241. doi: 10.1016/j.ccr.2005.08.010. [DOI] [PubMed] [Google Scholar]
- 17.Liang X, Orescanin M, Toohey K, Insana M, Boppart S. Opt Lett. 2009;34:2894. doi: 10.1364/OL.34.002894. [DOI] [PMC free article] [PubMed] [Google Scholar]


