

Abstract
Monocyte/macrophage recruitment correlates strongly with the progression of diabetic nephropathy. Tumor necrosis factor-alpha (TNF-α) is produced by monocytes/macrophages but the direct role of TNF-α and/or macrophage-derived TNF-α in the progression of diabetic nephropathy remains unclear. Here we tested whether inhibition of TNF-α confers kidney protection in diabetic nephropathy via a macrophage-derived TNF-α dependent pathway. Compared to vehicle-treated mice, blockade of TNF-α with a murine anti-TNF-α antibody conferred kidney protection in Ins2Akita mice as indicated by reductions in albuminuria, plasma creatinine, histopathologic changes, kidney macrophage recruitment and plasma inflammatory cytokine levels at 18 weeks of age. To assess the direct role of macrophage-derived TNF-α in diabetic nephropathy, we generated macrophage specific TNF-α deficient mice (CD11bCre/TNF-αFlox/Flox). Conditional ablation of TNF-α in macrophages significantly reduced albuminuria, the increase in plasma creatinine and BUN, histopathologic changes and kidney macrophage recruitment compared to diabetic TNF-αFlox/Flox control mice after 12 weeks of streptozotocin-induced diabetes. Thus, production of TNF-α by macrophages plays a major role in diabetic renal injury. Hence, blocking TNF-α could be a novel therapeutic approach for treatment of diabetic nephropathy.
Keywords: albuminuria, diabetic nephropathy, inflammation
Introduction
Diabetic nephropathy (DN) is the leading cause of end stage kidney disease, responsible for over 43% of all cases in the US and this number is likely to increase unabated.1 Thus it is important to identify the mechanisms involved in the development and/or progression of diabetic kidney disease. Early alterations in diabetic kidneys include the development of glomerular hyperfiltration and hypertrophy, followed by thickening of the glomerular basement membrane, mesangial matrix accumulation, increased urinary albumin excretion (UAE) rate and ultimately progression to glomerular sclerosis and end-stage renal failure.
Although a number of therapeutic interventions have been shown to postpone the development or slow down the progression of DN, no intervention to date has been able to halt or reverse its progression. This failure may reflect the complexity of the pathogenic processes and mandates further investigation of other potential pathogenic factors. In this regard, several lines of evidence have incriminated tumor necrosis factor-α (TNF-α) as a mediator of DN. TNF-α is produced not only by monocytes and macrophages, but also by T and B lymphocytes and glomerular mesangial cells.2-4 TNF-α plays an important role in the pathogenesis of immunological renal diseases, such as lupus nephritis, anti-glomerular basement membrane disease, immunoglobulin A (IgA) nephropathy and Henoch-Schönlein purpura.4,5 Levels of TNF-α are increased in the kidney in animal models of DN.6,7 Elevated levels of TNF receptors are predictors of disease progression in humans with DN.8,9 A recent study found that pentoxyfylline, a drug that can inhibit TNF-α production, reduced albuminuria and slowed the loss of glomerular filtration rate (GFR) in patients with DN.10 However, definitive proof that TNF-α contributes to DN, and the source of TNF-α that drives disease progression, remain lacking.
The current studies used pharmacologic and genetic approaches to determine the role of TNF-α in mouse models of DN. Moreover, conditional knockout of TNF-α in macrophages allowed a direct assessment of the role that macrophage-derived TNF-α plays in DN. Our results show that TNF-α does play a pivotal role in the development of DN and that macrophages are an important source of TNF-α in this setting. We believe that attenuation of TNF-α production or actions could be a novel therapeutic target for treatment of DN.
Results
TNF-α inhibition reduces characteristics of DN in Ins2Akita mice
To assess the possible pathogenic significance of TNF-α in DN, we treated Ins2Akita mice with a TNF-α neutralizing antibody,11-13 captopril, or vehicle for 9 weeks, beginning at 9 weeks of age. As shown in Table 1, Ins2Akita vehicle-treated mice had increased blood glucose and HgbA1c levels, decreased body weight, increased kidney weight/body weight ratio, increased urine volume, and reduced fluid composition compared to normal mice. TNF-α inhibition, but not captopril, significantly reduced kidney weight/body weight ratio without affecting other measurements. Importantly, treatment with anti-TNF-α or captopril did not reduce blood glucose levels or blood pressure.
Table 1.
Effects of murine anti-TNF-α antibody on diabetic Ins2Akita mice at 18 weeks of age.
| Treatments | Normal | Ins2Akita + Vehicle | Ins2Akita + Anti-TNF-α | Ins2Akita + Captopril |
|---|---|---|---|---|
| Mouse number | 16 | 7 | 7 | 7 |
| BW (g) | 26.4±0.6 | 22.1±1.1a | 23.8±0.9a | 23.2±0.4a |
| BG (mg/dL) | 129±4 | 460±20d | 451±25d | 472±19d |
| HgbA1C % | 5.5±0.07 | 12.7±0.2d | 12.1±0.5d | 12.2±0.5d |
| UV (ml/24 hrs) | 0.96±0.2 | 4.22±0.9a | 3.15±0.7 | 3.6±1.1 |
| KW/BW (g/100 g BW) | 0.96±0.03 | 1.27±0.06c | 1.08±0.03e | 1.25±0.08c |
| SBP (mmHg) | 122±3 | 124±4 | 114±4 | 124±5 |
| Fluid (%) | 7.1±0.1 | 5.9±0.2b | 5.8±0.1b | 6.0±0.1b |
Data are mean ± SEM.
: p<0.05,
: p<0.005,
: p<0.001,
: p<0.0001 compared to normal;
: p<0.05 compared to Ins2Akita + vehicle.
BW: body weight, BG: blood glucose, HgbA1c: hemoglobin A1c, UV: urine volume, KW/BW: kidney weight/body weight, SBP: systolic blood pressure.
We also measured urine albumin/creatinine ratio and plasma creatinine as indicators of diabetic kidney injury. Vehicle-treated Ins2Akita mice had a significant increase in urine albumin/creatinine ratio (Figure 1A), and plasma creatinine (Figure 1B) compared to non-diabetic mice at 18 weeks of age. Albuminuria and plasma creatinine were significantly reduced in Ins2Akita mice treated with anti-TNF-α antibody or captopril at 18 weeks of age compared to vehicle treated mice.
Figure 1. Effects of TNF-α inhibition on renal function in Ins2Akita mice.
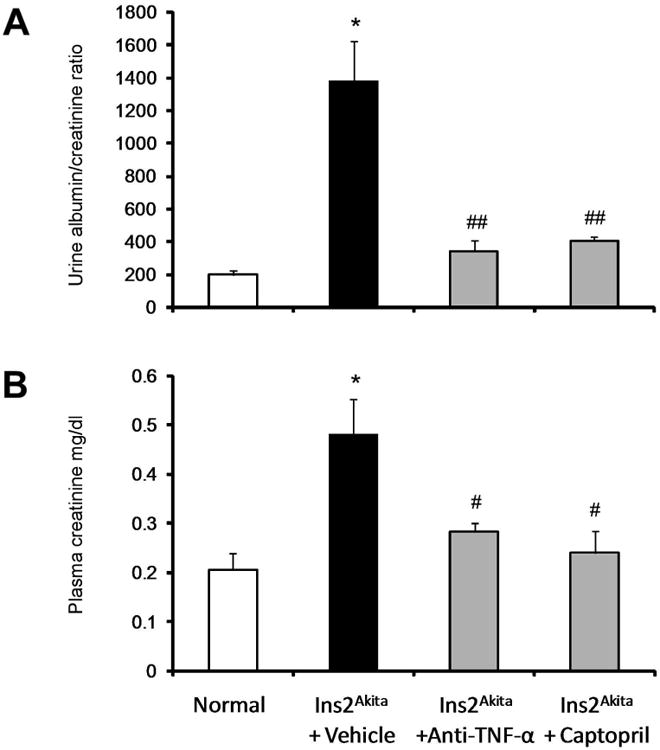
Ins2Akita and their wild type littermate mice were treated with TNF-α inhibitor, captopril or vehicle for 9 weeks. Urine and plasma were collected for measurement of urine albumin/creatinine ratio (A) and plasma creatinine (B) at 18 wk of age. Data are presented as mean ± SEM. *p<0.0001 compared to normal. #p<0.01, ##p<0.0001 compared to Ins2Akita+vehicle.
TNF-α inhibition decreases macrophage recruitment in Ins2Akita mice
To determine whether TNF-α inhibition is critical for kidney macrophage infiltration in DN, we examined the distribution and number of macrophages in the kidney by immunohistochemistry (Mac-2 positive macrophages) (Figure 2A and 2B). The number of glomerular macrophages in normal mice was low and increased significantly in vehicle-treated Ins2Akita mice (p<0.0001). Both TNF-α inhibition and captopril treatment in Ins2Akita mice resulted in significantly reduced glomerular macrophage recruitment (p<0.001) compared to vehicle-treated Ins2Akita mice.
Figure 2. Effects of TNF-α inhibition on macrophage recruitment and histological changes in Ins2Akita mice.
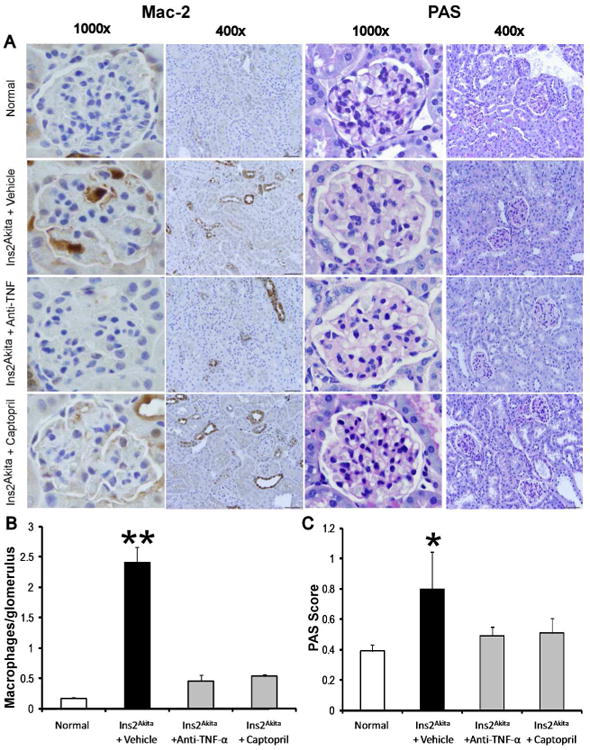
A) Immunohistochemical staining for Mac-2 positive macrophages in glomeruli and PAS-stained sections at 18 wk of age. Images are representative of 7-15 mice in each group. B) Summary data for macrophages/glomerulus. C) Summary data for glomerular PAS score. Data are presented as mean ± SEM. *p<0.01, **p<0.0001 compared to normal. Scale bar: 10 μm.
TNF-α inhibition decreases renal histological changes in Ins2Akita mice
PAS staining of kidney sections (Figure 2A and 2C) revealed increased glomerular cellularity and mesangial expansion (p<0.01) at 18 weeks of age in vehicle-treated Ins2Akita mice vs. normal. Importantly, both TNF-α inhibition and captopril treatments were not significantly different compared to normal.
TNF-α inhibition decreases plasma inflammatory cytokines in Ins2Akita mice
Increased inflammatory cytokines is a major feature and important predictor of DN.7,14 Therefore, we assessed the anti-inflammatory effect of TNF-α inhibition in diabetic mice (Figure 3). Vehicle-treated Ins2Akita mice had significantly increased plasma granulocyte-macrophage colony-stimulating factor (GMCSF) (p<0.001), keratinocyte-derived cytokine (KC) (p<0.01), TNF- α (p<0.05) and monocyte chemoattractant protein-1 (MCP-1) (p<0.05) at 18 week of age compared to normal mice. In contrast, TNF-α inhibition and captopril treatment significantly decreased GMCSF, KC, TNF- α and MCP-1 compared to vehicle-treated Ins2Akita mice at 18 weeks of age.
Figure 3. Effects of TNF-α inhibition on inflammatory cytokines in Ins2Akita mice.
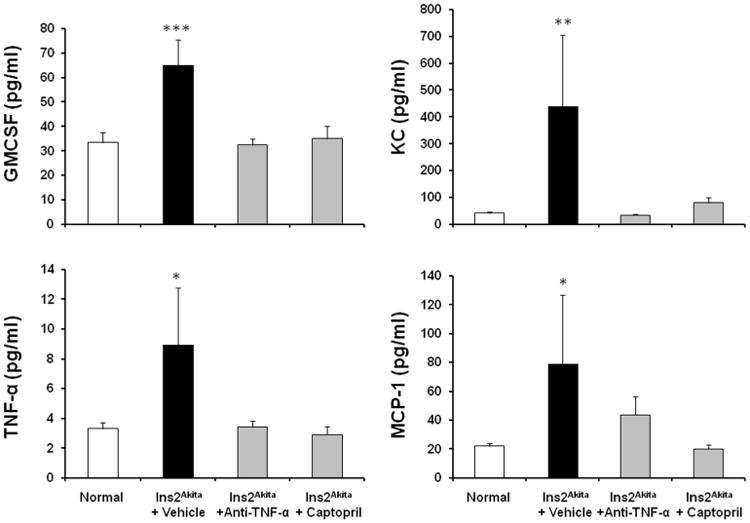
Ins2Akita and their wild type littermate mice were treated with TNF-α inhibitor, captopril or vehicle for 9 weeks. Plasma levels of GMCSF, KC, TNF- α and MCP-1 were determined at 18 wks of age. Data are presented as mean ± SEM. *p<0.05, **p<0.01, ***p<0.001 compared to normal.
TNF-α inhibition decreases TNF receptors in Ins2Akita mice
Elevated levels of TNF receptors are predictive of disease progression in humans with DN.8,9 Therefore, we assessed the effect of TNF-α inhibition on the kidney expression of TNF receptors in diabetic mice (Figure 4). Vehicle-treated Ins2Akita mice had significantly increased kidney TNF receptor-1 (TNFR1; Figure 4A) and TNFR2 (Figure 4B) (p<0.01) at 18 week of age compared to normal mice. In contrast, TNF-α inhibition and captopril treatment significantly decreased both TNFR1 and TNFR2 expression compared to vehicle-treated Ins2Akita mice at 18 weeks of age.
Figure 4. Effects of TNF-α inhibition on kidney TNF receptors expression in lns2Akita mice.
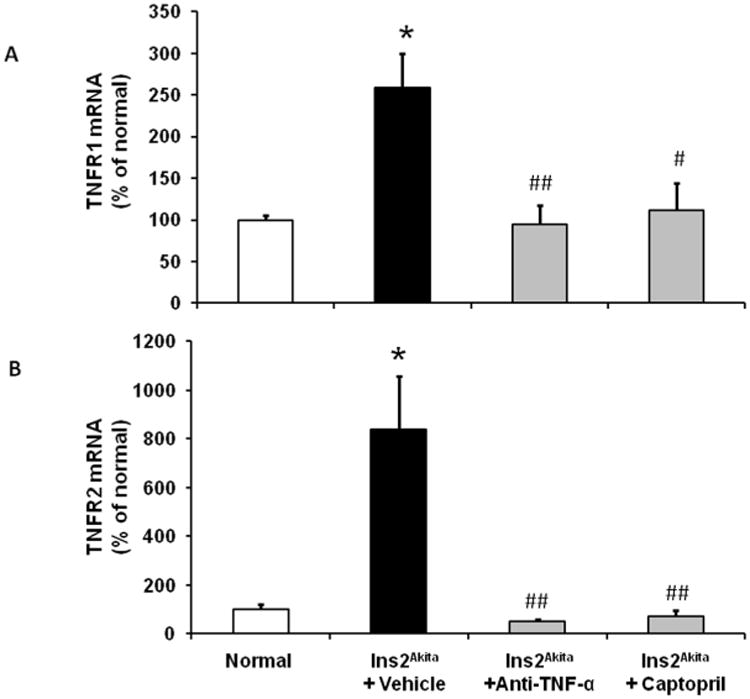
RT-PCR was performed on whole mouse kidney total RNA at 18 wk of age. TNFR1 (A) and TNFR2 (B) mRNA expression were normalized with GAPDH mRNA. Results are means ± SEM. *p<0.01 compared to normal; #p<0.05, ##p<0.01 compared to Ins2Akita±vehicle.
Characterization of macrophage-specific deletion TNF-α deficient mouse
To evaluate the pathogenic role of macrophage-derived TNF-α, we used a Cre-loxP approach to generate mice with macrophage-specific deletion of TNF-α. To confirm deletion of TNF-α, bone marrow was isolated from CD11bCre/TNF-αFlox/Flox and their control TNF-αFlox/Flox littermates. Bone marrow cells were cultured and induced to differentiate into macrophages and then stimulated with lipopolysaccharide (LPS) to induce TNF-α production. TNF-α mRNA expression was significantly lower in macrophages derived from CD11bCre/TNF-αFlox/Flox mice compared to TNF-αFlox/Flox under basal conditions (Figure 5A). LPS treatment for 24 hrs significantly increased TNF-α mRNA expression in macrophages derived from TNF-αFlox/Flox mice but not in macrophages from CD11bCre/TNF-αFlox/Flox mice (Figure 5A). To confirm deletion of TNF-α in macrophages in vivo, CD11bCre/TNF-αFlox/Flox and TNF-αFlox/Flox mice were injected with LPS and then peritoneal macrophages were collected 24 hours later. LPS increased TNF-α mRNA expression in peritoneal macrophages of TNF-αFlox/Flox mice but not in peritoneal macrophages of CD11bCre/TNF-αFlox/Flox mice (Figure 5B).
Figure 5. Characterization of CD11bCre/TNF-αFlox/Flox mice.
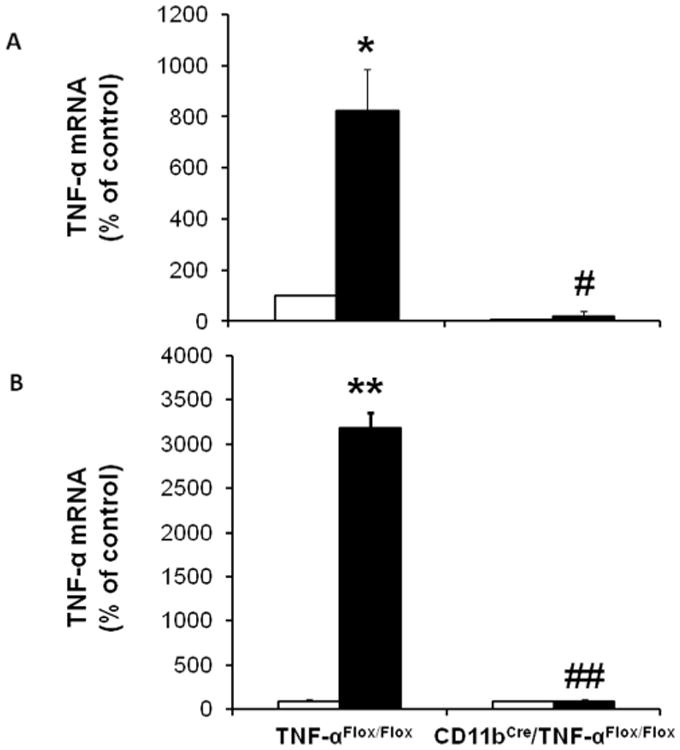
Bone marrow derived (A) or peritoneal (B) macrophages were isolated from TNF-αFlox/Flox and CD11bCre/TNF-αFlox/Flox mice after treatment with LPS or vehicle for 24 hours. RNA was isolated from cells for qRT-PCR quantitation of TNF-α. Results are means ± SEM. Open bar, non-stimulated macrophages; black-filled bar, LPS-stimulated macrophages. *p<0.01, **p<0.0001 compared to non-stimulated macrophages TNF-αFlox/Flox; #p<0.01 ##p<0.0001 compared to LPS-stimulated macrophages TNF-αFlox/Flox.
Selective TNF-α depletion in macrophages attenuates characteristics in diabetic mice
To determine the role of macrophage derived TNF-α in DN, Type 1 diabetes was induced by STZ injection in CD11bCre/TNF-αFlox/Flox and their control TNF-αFlox/Flox mice. As shown in Table 2, diabetic TNF-αFlox/Flox mice had increased blood glucose, decreased body weight, increased kidney weight/body weight ratio, and reduced fluid composition compared to normal mice. In contrast, CD11bCre/TNF-αFlox/Flox had significantly higher body weight than that of diabetic TNF-αFlox/Flox mice and the kidney weight/body weight ratio in diabetic CD11bCre/TNF-αFlox/Flox mice was significantly reduced compared to diabetic TNF-αFlox/Flox mice despite comparable blood glucose levels in diabetic CD11bCre/TNF-αFlox/Flox and TNF-αFlox/Flox mice.
Table 2.
Effects of selective TNF-α depletion in macrophages after 12 weeks of diabetes.
|
|
||||
|---|---|---|---|---|
| TNF αFlox/Flox | CD11 bCre/TNF-αFlox/Flox | |||
|
| ||||
| Treatment | Normal | Diabetes | Normal | Diabetes |
| Mice number | 7 | 11 | 11 | 12 |
| Body Weight (g) | 29.6±1.3 | 16.7±1.1a | 33.1 ±0.5 | 23.1±0.8b,c |
| Blood glucose (mg/dL) | 156±9.9 | 499±0.25a | 149±7.0 | 490±5.4b |
| SBP (mmHg) | 125±1.9 | 121±4.9 | 138±6.1 | 128±4.0 |
| KW/BW (g/100 g BW) | 0.625±0.029 | 1.139±0.028a | 0.652±0.012 | 0.946±0.038b,c |
| % Fluid | 7.03±0.21 | 5.73±0.11a | 7.05±0.10 | 5.88±0.12b |
Data are mean ± SEM.
: p<0.01 compared to normal TNF-αFlox/Flox;
: p<0.01 compared to normal CD11bCre/TNF-αFlox/Flox;
: p<0. 01 compared to diabetic TNF-αFlox/Flox.
SBP: systolic blood pressure, KW/BW: kidney weight/body weight.
Selective TNF-α depletion in macrophages ameliorates diabetes-induced kidney injuries
To evaluate the role of macrophage-derived TNF-α in diabetic kidney injury, urine albumin/creatinine ratio, plasma creatinine and BUN were determined after 12 weeks of STZ-induced diabetes. Urine albumin/creatinine ratio (Figure 6A), plasma creatinine (Figure 6B), and BUN (Figure 6C) increased significantly in diabetic TNF-αFlox/Flox mice compared to normal mice. Interestingly, the urine albumin/creatinine ratio, plasma creatinine and BUN were significantly lower in diabetic CD11bCre/TNF-αFlox/Flox mice compared to diabetic TNF-αFlox/Flox mice.
Figure 6. Selective TNF-α depletion in macrophages reduces renal dysfunction in diabetic mice.
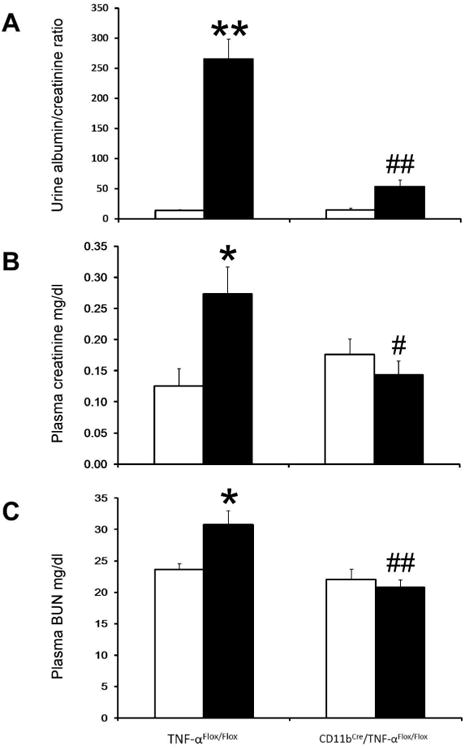
Mouse urinary albumin/creatinine ratio (A), plasma creatinine (B), and BUN (C) were determined after 12 weeks of STZ-induced type 1 diabetes. Results are means ± SEM. Open bar, normal group; black-filled bar, diabetic group. *p<0.05, **p<0.01 compared to normal TNF-αFlox/Flox; #p<0.05, ##p<0.01 compared to diabetic TNF-αFlox/Flox.
Selective TNF-α depletion in macrophages reduces renal macrophage infiltration in diabetes
Macrophage recruitment plays an important role in diabetic renal injury.15 To investigate the role of macrophage-derived TNF-α in macrophage infiltration in the diabetic kidney, immunohistochemistry was performed to detect glomerular macrophages (Figure 7A and 7B). The number of glomerular macrophages was significantly increased in diabetic TNF-αFlox/Flox mice compared to normal TNF-αFlox/Flox mice (p<0.01). Although diabetes also increased glomerular macrophages in CD11bCre/TNF-αFlox/Flox mice (p<0.01), glomerular macrophage infiltration in diabetic CD11bCre/TNF-αFlox/Flox mice was significantly lower compared to diabetic TNF-αFlox/Flox mice (p<0.05).
Figure 7. Selective TNF-α depletion in macrophages reduces macrophage recruitment and histological changes in diabetic mice.
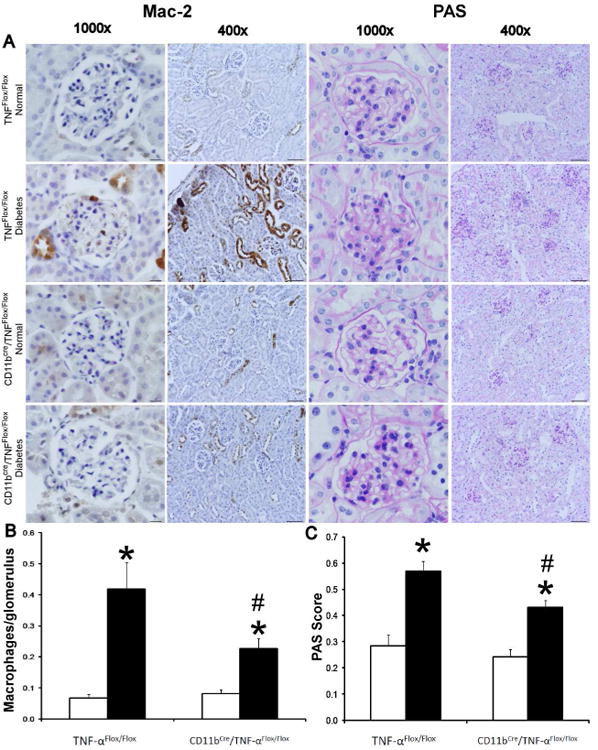
A) Immunohistochemical staining for Mac-2 positive macrophages in glomeruli and PAS-stained sections after 12 weeks of STZ-induced type 1 diabetes. Images are representative of 7-12 mice in each group. B) Summary data for macrophages/glomerulus. C) Summary data for glomerular PAS score. Data are presented as mean ± SEM. *p<0.01 compared to normal; #p<0.05 compared to diabetes TNF-αFlox/Flox. Scale bar: 10 μm.
In addition, total kidney macrophage content was determined by flow cytometry. In TNF-αFlox/Flox mice kidney macrophage content was significantly increased in diabetic mice compared to non-diabetic mice (1.45±0.13 vs. 0.92±0.08 ×10⁴ cells per gram kidney, p<0.01). Diabetic CD11bCre/TNF-αFlox/Flox mice had similar numbers of kidney macrophages as non-diabetic mice and significantly fewer than diabetic TNF-αFlox/Flox mice (0.95±0.1 vs. 1.45±0.13 ×10⁴ per gram kidney, p<0.01).
Selective TNF-α depletion in macrophages reduces kidney histologic changes in diabetic mice
Histologic analysis of kidney tissue sections (Figure 7A and 7C) showed an increase in mesangial cellularity and/or mesangial expansion in diabetic TNF-αFlox/Flox mice compared to non-diabetic mice (p<0.001) and diabetic CD11bCre/TNF-αFlox/Flox mice compared to non-diabetic mice (p<0.001). However, the degree of mesangial cellularity and expansion was significantly lower in diabetic CD11bCre/TNF-αFlox/Flox mice compared to diabetic TNF-αFlox/Flox mice (p<0.01)
Selective TNF-α depletion in macrophages prevented the increase in kidney TNF-α, TNFR1 and TNFR2 expression in diabetic mice
Previous studies have demonstrated an increase in kidney TNF-α mRNA and protein content during diabetes.6,16 Likewise, we found that TNF-α mRNA and protein levels were increased approximately two fold after 12 weeks of diabetes in TNF-αFlox/Flox mice (Figure 8A and 8B). Similarly, TNFR1 and TNFR2 mRNA and protein levels were increased after 12 weeks of diabetes in TNF-αFlox/Flox mice (Figure 8C-8F). Importantly, diabetes did not result in an increase in kidney TNF-α, TNFR1 or TNFR2 mRNA and protein levels in CD11bCre/TNF-αFlox/Flox mice. CCL2/MCP-1 is a macrophage chemokine which is increased in diabetic kidneys.17 Interestingly, CCL2/MCP-1 mRNA expression increased to a similar extent in both diabetic TNF-αFlox/Flox mice and CD11bCre/TNF-αFlox/Flox mice (Figure 8G).
Figure 8. Selective TNF-α depletion in macrophages prevented the increase in kidney TNF-α, TNFR1 and TNFR2 expression in diabetic mice.
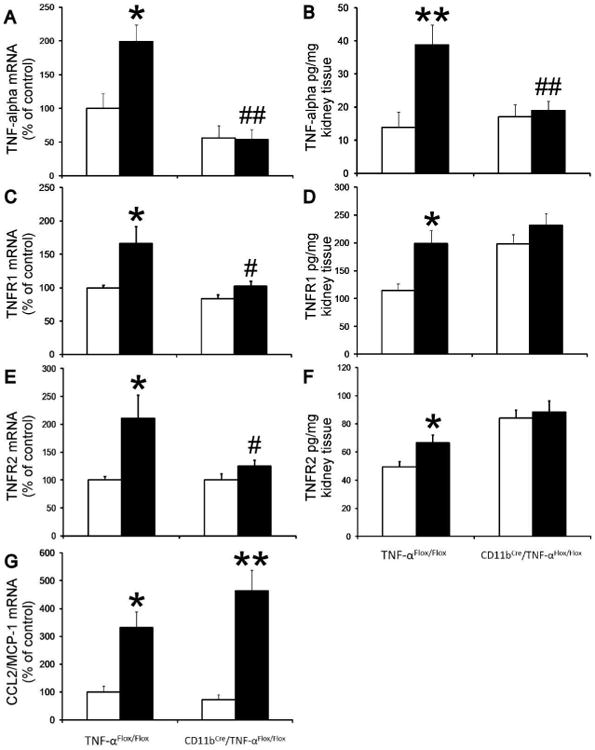
RT-PCR was performed on whole mouse kidney total RNA after 12 weeks following diabetes. TNF-α (A), TNFR1 (C), TNFR2 (E) and MCP-1 (G) mRNA expression were normalized with GAPDH mRNA. Kidney TNF-α (B), TNFR1 (D) and TNFR2 (F) proteins were determined using Elisa kits according to manufacturer's protocol. Open bar, normal group; black-filled bar, diabetic groups. Results are means ± SEM. *p<0.05; **p<0.01 compared to normal; #p<0.05; ##p<0.01 compared to diabetic TNF-αFlox/Flox.
Discussion
Diabetes is the most common cause of end stage renal disease.1 DN may progress in spite of current therapeutic measures, such as control of blood pressure and blood glucose and use of renin-angiotensin-aldosterone system inhibitors.18 Identification of other pathogenic factors may lead to more effective treatment or prevention. Accumulating evidence, reviewed recently,19 suggests that TNF-α is one such factor. Thus, kidney levels of TNF-α are elevated in models of both type 1 and type 2 DM.6,7 Moreover, TNF-α has been shown to influence sodium absorption and hypertrophy in diabetic rats, and thus a soluble TNF antagonist or pentoxyfylline significantly reduced renal hypertrophy possibly by reducing TGF-β.20-22 Interventions which alter TNF-α production also reduce DN in both animals and humans.10 The present studies addressed both the role and origin of TNF-α in DN.
In a murine model of Type 1 DM, we show that a murine TNF-α neutralizing antibody prevents renal hypertrophy, reduces albuminuria and preserves kidney function. Similar results were reported recently in a murine model of type 2 DM using a different TNF-α antibody.23 Taken together, these results clearly establish a role for TNF-α in the pathogenesis of DN.
Previous studies have identified several chemokines and cytokines as pathogenic factors in DN.24 TNF-α is a pleiotropic cytokine which stimulates the production of other cytokines in an autocrine and paracrine fashion.25-28 Thus, inhibition of TNF-α may serve to block a variety of other inflammatory mediators and account for its beneficial effect in DN.
There are few reports of the effects of TNF-α inhibition in proteinuric kidney disease. Several case reports have reported reductions in proteinuria in patients with nephrotic syndrome who received anti-TNF-α agents.29-31 A multicenter Phase II randomized clinical trial (FONT II, NCT00814255) designed to investigate the potential efficacy of adalimumab, a human monoclonal antibody against TNF-α, for resistant FSGS was recently completed although the results are not yet available.32
Angiotensin converting enzyme (ACE) inhibitors (ACEi) are recognized as the standard of care in DN and potential new therapies should be compared to it. Our results indicate that treatment with captopril, an ACEi, was almost as effective as treatment with a murine TNF-α neutralizing antibody in reducing albuminuria, kidney macrophage recruitment, histopathological changes, and plasma inflammatory cytokines. Additional studies to investigate the role of combined TNF-α inhibitor and ACEi treatment will be needed.
A second issue addressed in the current study is the cellular origin of TNF-α. In human studies, glomerular macrophages accumulate in DN33-36 and correlate strongly with the progression of renal impairment.35 Furthermore, in animal models, macrophage accumulation in diabetic kidneys correlates strongly with serum creatinine, interstitial myofibroblast accumulation and interstitial fibrosis scores.37-42 Infiltrating macrophages release lysosomal enzymes, nitric oxide, reactive oxygen species, transforming growth factor-beta, vascular endothelial growth factor and cytokines such as TNF-α, interleukin-1 and interferon (IFN)-γ which could play a pivotal role in the development and progression of DN.43 Diminished macrophage infiltration associated with reduced urinary albumin excretion has been shown in CCR2 and MCP-1-deficient mice in both type-1 and type-2 diabetes.17,44-46 Nonetheless, whether macrophage recruitment is the cause or consequence of chronic kidney injury was uncertain. However, we recently determined, by depleting macrophages in the CD11b-DTR mouse, that macrophages are causally related to DN.15 The mechanism whereby macrophages contribute to DN was not determined in that study. Macrophages are potent producers of TNF-α,47 raising the possibility that macrophages are the source of TNF-α in DN. Indeed, using a novel macrophage-specific deletion of TNF-α, we found that basal kidney levels of TNF-α were reduced by roughly 50% and that the diabetes-induced increase in renal TNF-α expression was completely blocked in the absence of macrophage TNF-α. Of more interest, deletion of macrophage TNF-α protected diabetic mice from nephropathy as reflected by reduced hypertrophy and reduction in albuminuria and glomerular pathology. The lack of TNF-α production also reduced renal macrophage infiltration even though CCL2/MCP-1, a macrophage chemokine, was still induced. CCL2/MCP-1 is produced by monocytes/macrophages, as well as podocytes, mesangial, tubular epithelial and endothelial cells.48-51 Although TNF-α is known to stimulate CCL2 production,27 we did not see a decrease in CCL2/MCP-1 expression in diabetic CD11bCre/TNF-αFlox/Flox mice. This might represent TNF-independent pathways of production or CCL2 production stimulated by TNF-α from non-macrophage sources such as podocytes, mesangial and tubular epithelial cells. This conclusion is supported by several reports indicating that macrophage depletion did not alter or reduce CCL2/MCP-1 expression.52-54
The expression of TNFR1 and TNFR2 may be altered in disease states. Thus, the renal expression of TNFR1 and particularly TNFR2 increased during acute transplant rejection55 and in models of AKI.56 In the latter study, the upregulation of TNFR2 was TNF-dependent, perhaps reflecting the presence of NFkB sites in the TNFR2 promoter.57 Elevated levels of TNF receptors are also predictors of disease progression in humans with DN.8,9 In our study, pharmacologic inhibition of TNF-α and conditional ablation of TNF-α in macrophages both prevented the diabetes-associated increase in TNFR1 and TNFR2 mRNA. The protein levels of TNFR1 and TNFR2 were higher in CD11bCre/TNF-αFlox/Flox compared to TNF-αFlox/Flox under normal conditions but showed no increase upon induction of diabetes. Additional study is needed to clarify the direct roles of TNFR1 and TNFR2 in DN.
We did not investigate in depth the signals leading to macrophage-derived TNF-α production. Stimulation of TLR4 on macrophages results in TNF-α production.58 TLR4 has also been incriminated in the pathogenesis of DN.59-62 Recent work has shown that TLR4 deficient mice are protected from DN and that the levels of certain TLR4 ligands, such as HSP70, HMGB1 and biglycan, are increased in the diabetic kidney.59 Thus, it is possible that macrophage TNF-α production in DN is driven by stimulation of TLR4 by endogenous ligands. Additional study is needed to clarify this hypothesis.
A recent clinical trial evaluated the effects of pentoxifylline, a phosphodiesterase inhibitor, in subjects with DN.10 After 24 months of treatment, modest reductions in albuminuria and stabilization of GFR were observed. Pentoxifylline is a weak inhibitor of TNF-α production and the beneficial effects of pentoxifylline may have been referable to the small reductions in TNF-α seen in the treated patients. Potent TNF-α biologics are in clinical use for inflammatory bowel disease, psoriasis and rheumatoid arthritis.63-66 It is reasonable to speculate that these agents may have more efficacy than pentoxifylline in preventing or retarding the progression of DN. Clinical trials will be needed to address this question.
In summary, using genetic models of TNF-α deficiency, we provide strong evidence that TNF-α produced by macrophages plays an important role in the pathogenesis of DN. We also show that inhibition of TNF-α with a neutralizing antibody, analogous to those available clinically, can reduce features of DN. Inhibition of TNF-α may be a viable strategy to treat DN in humans.
Materials and Methods
Diabetic mouse models
All animal experiments were approved by the Penn State University College of Medicine Institutional Animal Care and Use Committee. Experiments were conducted in male D2.B6-Ins2Akita/MatbJ and their wild type (WT) littermate mice (DBA/2J background; The Jackson Laboratory, stock number 007562) starting at 5 weeks of age (∼2 weeks of diabetes) until 18 weeks of age (∼15 weeks of diabetes). Ins2Akita mice, recommended by the Animal Models of Diabetes Complications Consortium (AMDCC) as a model of DN,67,68 develop hyperglycemia at 3 weeks of age. Mice with deletion of TNF-α in myeloid cells were created by mating CD11bCre mice69 with TNF-αFlox/Flox mice70, both on the C57BL/6 background. The offspring were genotyped and backcrossed with TNF-αFlox/Flox mice to obtain CD11bCre/TNF-αFlox/Flox. TNF-αFlox/Flox mice, lacking CD11bCre, were used as controls. Type 1 diabetes was induced by multiple low doses of streptozocin (STZ; Sigma, St. Louis, MO; 50 mg/kg body wt dissolved in lactated Ringers solution intraperitoneally for 5 consecutive days) as recommended by AMDCC.67,68 Diabetes was confirmed one week later by measurement of blood glucose level. Mice with blood glucose levels > 350 mg/dl were considered diabetic. Mice were provided ad lib access to food and water. Urine collections were obtained by housing mice in metabolic cages. At the end of experiments, mice were euthanized and kidney and blood samples were collected.
Drug delivery
A neutralizing antibody to murine TNF-α (CNTO5048, 10 mg/kg weekly via IP injection, Janssen R&D)11-13, captopril (24 mg/L daily in drinking water; Sigma), or vehicle (PBS) were administered for 9 weeks (in Ins2Akita experiments) starting at 9 weeks of age (6 weeks after onset of diabetes).
Blood pressure measurement
Systolic blood pressure was measured using the Coda blood pressure system (Kent Scientific Corp, Torrington, Connecticut) as previously described.71,72 Mice were habituated to the blood pressure measurement for 5 days before the day of the experiment and then were allowed to rest quietly for 15 minutes at room temperature. All measurements were performed at the same time for all groups to avoid any diurnal variations.
Histology and immunohistochemistry
Mouse kidney tissues were fixed in 4% paraformaldehyde and embedded in paraffin. Periodic acid Schiff (PAS) staining was performed on 3 μm sections. Glomeruli were examined at 400× in a blinded manner. Images were captured with an Olympus BX51 microscope and DP71 digital camera using cellSens Standard 1.6 image software. Images were obtained with 40× and 100× (oil) objective with a total magnification of 400× and 1000×. Semiquantitative scores (0-4+) were assigned based on the masked readings. The mesangial matrix expansion or sclerosis scoring was performed as we described previously.15,42,73 Immunohistochemistry for macrophages was performed using rat anti-mouse Mac-2 antibody (clone M3/38; Cedarlane, Burlington, NC) on paraffin sections. The number of glomerular macrophages were counted in 40 glomeruli per section (number of macrophages in glomeruli divided by the number of glomeruli) in blinded fashion under 40× magnification and averaged as described previously.15,42,73
Flow cytometry
Resident macrophages in kidneys were detected by fluorescence-activated cell sorting in an LSR-II flow cytometer (BD, Franklin Lakes, NJ) as described previously.15,42 In brief, mouse kidneys were removed, minced, digested and then passed through a 40 μm mesh. Samples were pre-incubated with CD16/32 (2.4G) to block non-specific FcR binding site and 7-AAD (Invitrogen, Carlsbad, CA) to exclude dead cells. Kidney macrophages were defined as CD45+CD11bhigh/F4/80low. Counting beads (Product #: PCB100, Invitrogen) were used in the experiments to calculate the total number of CD45+ cell per gram of kidney tissue. Data were analyzed using FlowJo software 8.8.6 (Tree Star, Ashland, OR). All the antibodies were provided by eBioscience.
Plasma cytokines assay
Mouse plasma was collected at sacrifice and frozen at -80C until assayed. 25 μl of plasma samples were analyzed in duplicate using the Milliplex MAP Mouse Cytokine/Chemokine 32-plex assay (Millipore, cat #MCYTMAG-70K-PX32) according to manufacturer's protocol. Samples were run on a Bio-Plex 200 system (Bio-Rad). Individual plasma analyte concentrations were generated by interpolation from a standard curve using the Bio-Plex 6.1 software package (Bio-Rad).
Analytical methodology
Urine albumin was measured by ELISA using an Albuwell M kit (Exocell, Philadelphia, PA) as described previously.15,41,42 Urine and plasma creatinine was determined using an enzymatic assay (Diazyme Laboratories, Poway, CA) as described previously.15,41,42 Blood urea nitrogen (BUN) was determined using QuantiChrom Urea Assay Kit (BioAssay Systems cat#DIUR-500).15,41,42 Body composition was measured using a LF90 Minispec Time Domain Nuclear Magnetic Resonance Spectrometer (Burker Optics, Billerica, MA) as described previously.15,73 Kidney TNF-α protein was determined using mouse TNF-α Elisa Ready-SET-GO kit according to manufacturer's protocol (eBioscience, cat #88-7324). Kidney TNFR1 and TNFR2 proteins were determined using mouse TNFR1 and TNFR2 Quantikine Elisa kits according to manufacturer's protocol (R&D System, cat #MRT10 and MTR20; respectively).
Bone marrow-derived macrophage isolation and culture
Bone marrow cells were isolated from mouse femur and tibia under sterile conditions as described previously.15 In brief, bones were flushed with RPMI 1640 (Invitrogen Life Technologies) plus 10% FCS. The marrow cells were passed sequentially through a 22-gauge needle followed by three passages through a 25-gauge needle to obtain single cell suspensions of bone marrow cells. Bone marrow cells were cultured in RPMI-1640 supplemented with 10% FBS, 1% glutamate, 20μg/mL gentamycin, 55μM 2-mercaptoethanol and 10ng/ml M-CSF (R&D system) for 7 days to induce macrophage differentiation. To induce M1 macrophages, cells were stimulated with 1 μg/mL lipopolysaccharide (LPS, Sigma) for an additional 24 hrs. Cells without stimulation were defined as M0.
Peritoneal macrophage isolation
Mice were injected intraperitoneally with LPS (cat #: L-6529, Sigma) at the dose of 6μg/g body weight. Vehicle solution was used as control. After 24 hours, mice were euthanized and 5 ml 1×PBS were injected into peritoneal cavity, followed by gently massage of mouse abdomen for 30 seconds, and then PBS were recovered using 21G needles. Peritoneal macrophages were spun down at 1200rpm for 10 minutes. Total RNAs were isolated using Tri reagent for qRT-PCR.
Quantitative reverse transcription polymerase chain reaction (qRT-PCR)
Total RNA was isolated from either kidney tissues or cultured cells using Tri reagent (Molecular Research Center, Inc, Cincinnati, OH, USA) per manufacturer's protocol. Single-strand cDNA was synthesized using iScript cDNA Synthesis Kit (Bio-Rad, Hercules, CA) for two-step qRT-PCR. Quantitative PCR was performed using Taqman gene expression assays (TNF-α: Mm00443260_g1, CCL2/MCP-1: Mm00441242_m1, TNFR1: Mm00441883_g1, TNFR2: Mm00441889_m1, GAPDH: Mm99999915_g1; Life Technologies, Grand Island, NY, USA) in a Bio-Rad CFX96 Real-Time System. Data were analyzed using Bio-Rad CFX Manager Software version 2.0. Relative expression quantification was calculated using the 2(-ΔΔCT) equation after normalization to glyceraldehyde-3-phosphate dehydrogenase (GAPDH) as described previously.15,73
Statistical analysis
Comparisons between groups were analyzed using SPSS (version 19.0, SPSS, Chicago, IL). Data are expressed as mean ± SEM. One-way ANOVA was used when more than two groups were compared, and significance of observed differences among the groups was evaluated with a least significant difference post hoc test. Statistical significance was identified at p< 0.05.
Acknowledgments
This study was supported by NIH Grants DK094930 and DK094930S1 (to ASA) and DK081876 (to WBR) and a grant from Johnson and Johnson.
Disclosure: Portions of this work were supported by a grant from Johnson and Johnson, which markets a TNF-α antagonist. At the time of the study, PFW and FXF were employees of Janssen R&D, a subsidiary of Johnson and Johnson.
References
- 1.Boyle JP, Thompson TJ, Gregg EW, et al. Projection of the year 2050 burden of diabetes in the US adult population: dynamic modeling of incidence, mortality, and prediabetes prevalence. Popul Health Metr. 2010;8:29. doi: 10.1186/1478-7954-8-29. [DOI] [PMC free article] [PubMed] [Google Scholar]
- 2.Baud L, Oudinet JP, Bens M, et al. Production of tumor necrosis factor by rat mesangial cells in response to bacterial lipopolysaccharide. Kidney Int. 1989;35:1111–1118. doi: 10.1038/ki.1989.98. [DOI] [PubMed] [Google Scholar]
- 3.Hruby ZW, Lowry RP. Spontaneous release of tumor necrosis factor alpha by isolated renal glomeruli and cultured glomerular mesangial cells. Clin Immunol Immunopathol. 1991;59:156–164. doi: 10.1016/0090-1229(91)90089-s. [DOI] [PubMed] [Google Scholar]
- 4.Tipping PG, Leong TW, Holdsworth SR. Tumor necrosis factor production by glomerular macrophages in anti-glomerular basement membrane glomerulonephritis in rabbits. Lab Invest. 1991;65:272–279. [PubMed] [Google Scholar]
- 5.Wu TH, Wu SC, Huang TP, et al. Increased excretion of tumor necrosis factor alpha and interleukin 1 beta in urine from patients with IgA nephropathy and Schonlein-Henoch purpura. Nephron. 1996;74:79–88. doi: 10.1159/000189285. [DOI] [PubMed] [Google Scholar]
- 6.Hasegawa G, Nakano K, Sawada M, et al. Possible role of tumor necrosis factor and interleukin-1 in the development of diabetic nephropathy. Kidney Int. 1991;40:1007–1012. doi: 10.1038/ki.1991.308. [DOI] [PubMed] [Google Scholar]
- 7.Kalantarinia K, Awad AS, Siragy HM. Urinary and renal interstitial concentrations of TNF-alpha increase prior to the rise in albuminuria in diabetic rats. Kidney Int. 2003;64:1208–1213. doi: 10.1046/j.1523-1755.2003.00237.x. [DOI] [PubMed] [Google Scholar]
- 8.Gohda T, Niewczas MA, Ficociello LH, et al. Circulating TNF receptors 1 and 2 predict stage 3 CKD in type 1 diabetes. J Am Soc Nephrol. 2012;23:516–524. doi: 10.1681/ASN.2011060628. [DOI] [PMC free article] [PubMed] [Google Scholar]
- 9.Niewczas MA, Gohda T, Skupien J, et al. Circulating TNF receptors 1 and 2 predict ESRD in type 2 diabetes. J Am Soc Nephrol. 2012;23:507–515. doi: 10.1681/ASN.2011060627. [DOI] [PMC free article] [PubMed] [Google Scholar]
- 10.Navarro-Gonzalez JF, Mora-Fernandez C, Muros de Fuentes M, et al. Effect of Pentoxifylline on Renal Function and Urinary Albumin Excretion in Patients with Diabetic Kidney Disease: The PREDIAN Trial. J Am Soc Nephrol. 2014 doi: 10.1681/ASN.2014010012. [DOI] [PMC free article] [PubMed] [Google Scholar]
- 11.Lei B, Dawson HN, Roulhac-Wilson B, et al. Tumor necrosis factor alpha antagonism improves neurological recovery in murine intracerebral hemorrhage. J Neuroinflammation. 2013;10:103. doi: 10.1186/1742-2094-10-103. [DOI] [PMC free article] [PubMed] [Google Scholar]
- 12.Charles KA, Kulbe H, Soper R, et al. The tumor-promoting actions of TNF-alpha involve TNFR1 and IL-17 in ovarian cancer in mice and humans. J Clin Invest. 2009;119:3011–3023. doi: 10.1172/JCI39065. [DOI] [PMC free article] [PubMed] [Google Scholar]
- 13.Vincent M, Sayre NL, Graham MJ, et al. Evaluation of an anti-tumor necrosis factor therapeutic in a mouse model of Niemann-Pick C liver disease. PLoS One. 2010;5:e12941. doi: 10.1371/journal.pone.0012941. [DOI] [PMC free article] [PubMed] [Google Scholar]
- 14.Awad AS, Huang L, Ye H, et al. Adenosine A2A receptor activation attenuates inflammation and injury in diabetic nephropathy. Am J Physiol Renal Physiol. 2006;290:F828–837. doi: 10.1152/ajprenal.00310.2005. [DOI] [PubMed] [Google Scholar]
- 15.You H, Gao T, Cooper TK, et al. Macrophages directly mediate diabetic renal injury. Am J Physiol Renal Physiol. 2013;305:F1719–1727. doi: 10.1152/ajprenal.00141.2013. [DOI] [PMC free article] [PubMed] [Google Scholar]
- 16.Nakamura T, Fukui M, Ebihara I, et al. mRNA expression of growth factors in glomeruli from diabetic rats. Diabetes. 1993;42:450–456. doi: 10.2337/diab.42.3.450. [DOI] [PubMed] [Google Scholar]
- 17.Awad AS, Kinsey GR, Khutsishvili K, et al. Monocyte/macrophage chemokine receptor CCR2 mediates diabetic renal injury. Am J Physiol Renal Physiol. 2011;301:F1358–1366. doi: 10.1152/ajprenal.00332.2011. [DOI] [PMC free article] [PubMed] [Google Scholar]
- 18.Abdel-Rahman EM, Saadulla L, Reeves WB, et al. Therapeutic modalities in diabetic nephropathy: standard and emerging approaches. J Gen Intern Med. 2012;27:458–468. doi: 10.1007/s11606-011-1912-5. [DOI] [PMC free article] [PubMed] [Google Scholar]
- 19.Barutta F, Bruno G, Grimaldi S, et al. Inflammation in diabetic nephropathy: moving toward clinical biomarkers and targets for treatment. Endocrine. 2014 doi: 10.1007/s12020-014-0437-1. [DOI] [PubMed] [Google Scholar]
- 20.DiPetrillo K, Gesek FA. Pentoxifylline ameliorates renal tumor necrosis factor expression, sodium retention, and renal hypertrophy in diabetic rats. Am J Nephrol. 2004;24:352–359. doi: 10.1159/000079121. [DOI] [PubMed] [Google Scholar]
- 21.DiPetrillo K, Coutermarsh B, Soucy N, et al. Tumor necrosis factor induces sodium retention in diabetic rats through sequential effects on distal tubule cells. Kidney Int. 2004;65:1676–1683. doi: 10.1111/j.1523-1755.2004.00606.x. [DOI] [PubMed] [Google Scholar]
- 22.DiPetrillo K, Coutermarsh B, Gesek FA. Urinary tumor necrosis factor contributes to sodium retention and renal hypertrophy during diabetes. Am J Physiol Renal Physiol. 2003;284:F113–121. doi: 10.1152/ajprenal.00026.2002. [DOI] [PubMed] [Google Scholar]
- 23.Omote K, Gohda T, Murakoshi M, et al. Role of the TNF pathway in the progression of diabetic nephropathy in KK-A(y) mice. Am J Physiol Renal Physiol. 2014;306:F1335–1347. doi: 10.1152/ajprenal.00509.2013. [DOI] [PubMed] [Google Scholar]
- 24.Navarro-Gonzalez JF, Mora-Fernandez C, Muros de Fuentes M, et al. Inflammatory molecules and pathways in the pathogenesis of diabetic nephropathy. Nat Rev Nephrol. 2011;7:327–340. doi: 10.1038/nrneph.2011.51. [DOI] [PubMed] [Google Scholar]
- 25.Ramesh G, Reeves WB. TNF-alpha mediates chemokine and cytokine expression and renal injury in cisplatin nephrotoxicity. J Clin Invest. 2002;110:835–842. doi: 10.1172/JCI15606. [DOI] [PMC free article] [PubMed] [Google Scholar]
- 26.Thorley AJ, Ford PA, Giembycz MA, et al. Differential regulation of cytokine release and leukocyte migration by lipopolysaccharide-stimulated primary human lung alveolar type II epithelial cells and macrophages. J Immunol. 2007;178:463–473. doi: 10.4049/jimmunol.178.1.463. [DOI] [PubMed] [Google Scholar]
- 27.Chen YM, Chiang WC, Lin SL, et al. Dual regulation of tumor necrosis factor-alpha-induced CCL2/monocyte chemoattractant protein-1 expression in vascular smooth muscle cells by nuclear factor-kappaB and activator protein-1: modulation by type III phosphodiesterase inhibition. J Pharmacol Exp Ther. 2004;309:978–986. doi: 10.1124/jpet.103.062620. [DOI] [PubMed] [Google Scholar]
- 28.Yang Y, Bin W, Aksoy MO, et al. Regulation of interleukin-1beta and interleukin-1beta inhibitor release by human airway epithelial cells. Eur Respir J. 2004;24:360–366. doi: 10.1183/09031936.04.00089703. [DOI] [PubMed] [Google Scholar]
- 29.Leroy S, Guigonis V, Bruckner D, et al. Successful anti-TNFalpha treatment in a child with posttransplant recurrent focal segmental glomerulosclerosis. Am J Transplant. 2009;9:858–861. doi: 10.1111/j.1600-6143.2009.02550.x. [DOI] [PubMed] [Google Scholar]
- 30.Verschueren P, Lensen F, Lerut E, et al. Benefit of anti-TNFalpha treatment for nephrotic syndrome in a patient with juvenile inflammatory bowel disease associated spondyloarthropathy complicated with amyloidosis and glomerulonephritis. Ann Rheum Dis. 2003;62:368–369. doi: 10.1136/ard.62.4.368. [DOI] [PMC free article] [PubMed] [Google Scholar]
- 31.Raveh D, Shemesh O, Ashkenazi YJ, et al. Tumor necrosis factor-alpha blocking agent as a treatment for nephrotic syndrome. Pediatr Nephrol. 2004;19:1281–1284. doi: 10.1007/s00467-004-1573-2. [DOI] [PubMed] [Google Scholar]
- 32.Trachtman H, Vento S, Gipson D, et al. Novel therapies for resistant focal segmental glomerulosclerosis (FONT) phase II clinical trial: study design. BMC Nephrol. 2011;12:8. doi: 10.1186/1471-2369-12-8. [DOI] [PMC free article] [PubMed] [Google Scholar]
- 33.Furuta T, Saito T, Ootaka T, et al. The role of macrophages in diabetic glomerulosclerosis. Am J Kidney Dis. 1993;21:480–485. doi: 10.1016/s0272-6386(12)80393-3. [DOI] [PubMed] [Google Scholar]
- 34.Hirata K, Shikata K, Matsuda M, et al. Increased expression of selectins in kidneys of patients with diabetic nephropathy. Diabetologia. 1998;41:185–192. doi: 10.1007/s001250050888. [DOI] [PubMed] [Google Scholar]
- 35.Nguyen D, Ping F, Mu W, et al. Macrophage accumulation in human progressive diabetic nephropathy. Nephrology (Carlton) 2006;11:226–231. doi: 10.1111/j.1440-1797.2006.00576.x. [DOI] [PubMed] [Google Scholar]
- 36.Bohle A, Wehrmann M, Bogenschutz O, et al. The pathogenesis of chronic renal failure in diabetic nephropathy. Investigation of 488 cases of diabetic glomerulosclerosis. Pathol Res Pract. 1991;187:251–259. doi: 10.1016/s0344-0338(11)80780-6. [DOI] [PubMed] [Google Scholar]
- 37.Nguyen TQ, Tarnow L, Andersen S, et al. Urinary Connective Tissue Growth Factor Excretion Correlates With Clinical Markers of Renal Disease in a Large Population of Type 1 Diabetic Patients With Diabetic Nephropathy. Diabetes Care. 2006;29:83–88. doi: 10.2337/diacare.29.1.83. [DOI] [PubMed] [Google Scholar]
- 38.Yonemoto S, Machiguchi T, Nomura K, et al. Correlations of tissue macrophages and cytoskeletal protein expression with renal fibrosis in patients with diabetes mellitus. Clin Exp Nephrol. 2006;10:186–192. doi: 10.1007/s10157-006-0426-7. [DOI] [PubMed] [Google Scholar]
- 39.Cummings BS, McHowat J, Schnellmann RG. Role of an endoplasmic reticulum Ca2+-independent phospholipase A2 in cisplatin-induced renal cell apoptosis. J Pharmacol Exp Ther. 2004;308:921–928. doi: 10.1124/jpet.103.060541. [DOI] [PubMed] [Google Scholar]
- 40.Chowdhury P, Sacks SH, Sheerin NS. Toll-like receptors TLR2 and TLR4 initiate the innate immune response of the renal tubular epithelium to bacterial products. Clinical & Experimental Immunology. 2006;145:346–356. doi: 10.1111/j.1365-2249.2006.03116.x. [DOI] [PMC free article] [PubMed] [Google Scholar]
- 41.Awad AS, Kinsey GR, Khutsishvili K, et al. Monocyte/macrophage chemokine receptor CCR2 mediates diabetic renal injury. Am J Physiol Renal Physiol. 301:F1358–1366. doi: 10.1152/ajprenal.00332.2011. [DOI] [PMC free article] [PubMed] [Google Scholar]
- 42.Morris SM, Jr, Gao T, Cooper TK, et al. Arginase-2 mediates diabetic renal injury. Diabetes. 60:3015–3022. doi: 10.2337/db11-0901. [DOI] [PMC free article] [PubMed] [Google Scholar]
- 43.Tesch GH. Role of macrophages in complications of type 2 diabetes. Clin Exp Pharmacol Physiol. 2007;34:1016–1019. doi: 10.1111/j.1440-1681.2007.04729.x. [DOI] [PubMed] [Google Scholar]
- 44.Chow FY, Nikolic-Paterson DJ, Ozols E, et al. Intercellular adhesion molecule-1 deficiency is protective against nephropathy in type 2 diabetic db/db mice. J Am Soc Nephrol. 2005;16:1711–1722. doi: 10.1681/ASN.2004070612. [DOI] [PubMed] [Google Scholar]
- 45.Chow FY, Nikolic-Paterson DJ, Ozols E, et al. Monocyte chemoattractant protein-1 promotes the development of diabetic renal injury in streptozotocin-treated mice. Kidney Int. 2006;69:73–80. doi: 10.1038/sj.ki.5000014. [DOI] [PubMed] [Google Scholar]
- 46.Ninichuk V, Clauss S, Kulkarni O, et al. Late onset of Ccl2 blockade with the Spiegelmer mNOX-E36-3′PEG prevents glomerulosclerosis and improves glomerular filtration rate in db/db mice. Am J Pathol. 2008;172:628–637. doi: 10.2353/ajpath.2008.070601. [DOI] [PMC free article] [PubMed] [Google Scholar]
- 47.Nathan CF. Secretory products of macrophages. J Clin Invest. 1987;79:319–326. doi: 10.1172/JCI112815. [DOI] [PMC free article] [PubMed] [Google Scholar]
- 48.Morii T, Fujita H, Narita T, et al. Association of monocyte chemoattractant protein-1 with renal tubular damage in diabetic nephropathy. J Diabetes Complications. 2003;17:11–15. doi: 10.1016/s1056-8727(02)00176-9. [DOI] [PubMed] [Google Scholar]
- 49.Park J, Ryu DR, Li JJ, et al. MCP-1/CCR2 system is involved in high glucose-induced fibronectin and type IV collagen expression in cultured mesangial cells. Am J Physiol Renal Physiol. 2008;295:F749–757. doi: 10.1152/ajprenal.00547.2007. [DOI] [PubMed] [Google Scholar]
- 50.Tarabra E, Giunti S, Barutta F, et al. Effect of the monocyte chemoattractant protein-1/CC chemokine receptor 2 system on nephrin expression in streptozotocin-treated mice and human cultured podocytes. Diabetes. 2009;58:2109–2118. doi: 10.2337/db08-0895. [DOI] [PMC free article] [PubMed] [Google Scholar]
- 51.Rollins BJ, Yoshimura T, Leonard EJ, et al. Cytokine-activated human endothelial cells synthesize and secrete a monocyte chemoattractant, MCP-1/JE. Am J Pathol. 1990;136:1229–1233. [PMC free article] [PubMed] [Google Scholar]
- 52.Haberstroh U, Pocock J, Gomez-Guerrero C, et al. Expression of the chemokines MCP-1/CCL2 and RANTES/CCL5 is differentially regulated by infiltrating inflammatory cells. Kidney Int. 2002;62:1264–1276. doi: 10.1111/j.1523-1755.2002.kid572.x. [DOI] [PubMed] [Google Scholar]
- 53.Ajuebor MN, Das AM, Virag L, et al. Regulation of macrophage inflammatory protein-1 alpha expression and function by endogenous interleukin-10 in a model of acute inflammation. Biochem Biophys Res Commun. 1999;255:279–282. doi: 10.1006/bbrc.1999.0196. [DOI] [PubMed] [Google Scholar]
- 54.Ajuebor MN, Das AM, Virag L, et al. Role of resident peritoneal macrophages and mast cells in chemokine production and neutrophil migration in acute inflammation: evidence for an inhibitory loop involving endogenous IL-10. J Immunol. 1999;162:1685–1691. [PubMed] [Google Scholar]
- 55.Al-Lamki RS, Wang J, Skepper JN, et al. Expression of tumor necrosis factor receptors in normal kidney and rejecting renal transplants. Lab Invest. 2001;81:1503–1515. doi: 10.1038/labinvest.3780364. [DOI] [PubMed] [Google Scholar]
- 56.Ramesh G, Reeves WB. TNFR2-mediated apoptosis and necrosis in cisplatin-induced acute renal failure. Am J Physiol Renal Physiol. 2003;285:F610–618. doi: 10.1152/ajprenal.00101.2003. [DOI] [PubMed] [Google Scholar]
- 57.Santee SM, Owen-Schaub LB. Human tumor necrosis factor receptor p75/80 (CD120b) gene structure and promoter characterization. J Biol Chem. 1996;271:21151–21159. doi: 10.1074/jbc.271.35.21151. [DOI] [PubMed] [Google Scholar]
- 58.Hoshino K, Takeuchi O, Kawai T, et al. Cutting edge: Toll-like receptor 4 (TLR4)-deficient mice are hyporesponsive to lipopolysaccharide: evidence for TLR4 as the Lps gene product. J Immunol. 1999;162:3749–3752. [PubMed] [Google Scholar]
- 59.Ma J, Chadban SJ, Zhao CY, et al. TLR4 activation promotes podocyte injury and interstitial fibrosis in diabetic nephropathy. PLoS One. 2014;9:e97985. doi: 10.1371/journal.pone.0097985. [DOI] [PMC free article] [PubMed] [Google Scholar]
- 60.Lin M, Yiu WH, Wu HJ, et al. Toll-like receptor 4 promotes tubular inflammation in diabetic nephropathy. J Am Soc Nephrol. 2012;23:86–102. doi: 10.1681/ASN.2010111210. [DOI] [PMC free article] [PubMed] [Google Scholar]
- 61.Devaraj S, Tobias P, Jialal I. Knockout of toll-like receptor-4 attenuates the pro-inflammatory state of diabetes. Cytokine. 2011;55:441–445. doi: 10.1016/j.cyto.2011.03.023. [DOI] [PubMed] [Google Scholar]
- 62.Lin M, Yiu WH, Li RX, et al. The TLR4 antagonist CRX-526 protects against advanced diabetic nephropathy. Kidney Int. 2013;83:887–900. doi: 10.1038/ki.2013.11. [DOI] [PubMed] [Google Scholar]
- 63.Monaco C, Nanchahal J, Taylor P, et al. Anti-TNF Therapy: Past, Present and Future. Int Immunol. 2014 doi: 10.1093/intimm/dxu102. [DOI] [PMC free article] [PubMed] [Google Scholar]
- 64.van Schouwenburg PA, Rispens T, Wolbink GJ. Immunogenicity of anti-TNF biologic therapies for rheumatoid arthritis. Nat Rev Rheumatol. 2013;9:164–172. doi: 10.1038/nrrheum.2013.4. [DOI] [PubMed] [Google Scholar]
- 65.Thomson AB, Gupta M, Freeman HJ. Use of the tumor necrosis factor-blockers for Crohn's disease. World J Gastroenterol. 2012;18:4823–4854. doi: 10.3748/wjg.v18.i35.4823. [DOI] [PMC free article] [PubMed] [Google Scholar]
- 66.Levin EC, Debbaneh M, Koo J, et al. Biologic therapy in erythrodermic and pustular psoriasis. J Drugs Dermatol. 2014;13:342–354. [PubMed] [Google Scholar]
- 67.Breyer MD, Bottinger E, Brosius FC, 3rd, et al. Mouse models of diabetic nephropathy. J Am Soc Nephrol. 2005;16:27–45. doi: 10.1681/ASN.2004080648. [DOI] [PubMed] [Google Scholar]
- 68.Brosius FC, 3rd, Alpers CE, Bottinger EP, et al. Mouse models of diabetic nephropathy. J Am Soc Nephrol. 2009;20:2503–2512. doi: 10.1681/ASN.2009070721. [DOI] [PMC free article] [PubMed] [Google Scholar]
- 69.Ferron M, Vacher J. Targeted expression of Cre recombinase in macrophages and osteoclasts in transgenic mice. Genesis. 2005;41:138–145. doi: 10.1002/gene.20108. [DOI] [PubMed] [Google Scholar]
- 70.Grivennikov SI, Tumanov AV, Liepinsh DJ, et al. Distinct and Nonredundant In Vivo Functions of TNF Produced by T Cells and Macrophages/Neutrophils: Protective and Deleterious Effects. Immunity. 2005;22:93–104. doi: 10.1016/j.immuni.2004.11.016. [DOI] [PubMed] [Google Scholar]
- 71.Awad AS, Kinsey GR, Khutsishvili K, et al. Monocyte/Macrophage Chemokine Receptor CCR2 Mediates Diabetic Renal Injury. Am J Physiol Renal Physiol. 2011 doi: 10.1152/ajprenal.00332.2011. [DOI] [PMC free article] [PubMed] [Google Scholar]
- 72.Morris SM, Jr, Gao T, Cooper TK, et al. Arginase-2 mediates diabetic renal injury. Diabetes. 2011;60:3015–3022. doi: 10.2337/db11-0901. [DOI] [PMC free article] [PubMed] [Google Scholar]
- 73.You H, Gao T, Cooper TK, et al. Arginase inhibition mediates renal tissue protection in diabetic nephropathy by a nitric oxide synthase 3-dependent mechanism. Kidney Int. 2013 doi: 10.1038/ki.2013.215. [DOI] [PMC free article] [PubMed] [Google Scholar]