Abstract
Projections from the substantia nigra and striatum traverse through the pallidum on the way to their targets. To date, in vivo characterization of these pathways remains elusive. Here we used high angular resolution diffusion imaging (N=138) to study the characteristics and structural subcompartments of the human pallidum. Our central result shows that the diffusion orientation distribution at the pallidum is asymmetrically oriented in a dorsal to dorsolateral direction, consistent with the orientation of underlying fiber systems. We also observed systematic differences in the diffusion signal between the two pallidal segments. Compared to the outer pallidal segment, the internal segment has more peaks in the diffusion orientation distribution and stronger anisotropy in the primary fiber direction, consistent with known cellular differences between the underlying nuclei. These differences in orientation, complexity, and degree of anisotropy are sufficiently robust to automatically segment the pallidal nuclei using diffusion properties. We characterize these patterns in one data set using diffusion spectrum imaging and replicate in a separate sample of subjects imaged using multi-shell imaging, highlighting the reliability of these diffusion patterns within pallidal nuclei. Thus the gray matter diffusion signal can be useful as an in vivo measure of the collective efferent pathways running through the human pallidum.
Keywords: basal ganglia, diffusion imaging, nigrostriatal, striatonigral, globus pallidus
Introduction
The basal ganglia are a crucial forebrain network associated with many motor and non-motor functions, including reward processing, decision-making, and learning (Hollerman et al., 2000; Haber, 2003; Adam et al 2013). Many aspects of basal ganglia function rely on dopaminergic inputs from the substantia nigra that serve as a modulatory signal for neurons in the subpallium (Haber et al., 2000). These dopaminergic inputs are conducted by a set of fiber bundles that originate in the pars compacta region of the substantia nigra, a portion of which migrate in a dorsolateral direction through the segments of the globus pallidus (Carpenter and Peter, 1972). While a majority of these projections pass through the pallidum and terminate on cells in the striatal nuclei (Carpenter and McMasters, 1964), a significant number of them also terminate in the inner and outer segments of the globus pallidus, forming the nigropallidal pathway (Cossette et al., 1999). Two other major fiber systems traversing through the globus pallidus project from the striatum, including the striatopallidal fiber systems, which form the canonical direct and indirect pathways, and the striatonigral fiber system. Breakdowns in these various pathways form the etiology of several neurodegenerative diseases. For example, axonal degeneration of the nigrostriatal pathway is the pathological hallmark of Parkinson’s Disease (Burke and O’Malley, 2013) while Huntington’s disease is characterized by a loss of medium spiny neurons within the striatum that project to the globus pallidus (Reiner et al., 1988). Thus in vivo characterization of these basal ganglia projections has clear clinical implications.
One problem with characterizing both the nigral and striatal efferents is that they are largely embedded within the gray matter of several basal ganglia nuclei, primarily within the globus pallidus. The internal segment of the globus pallidus is the primary output of the basal ganglia network, sending projections that relay signals from upstream nuclei to the thalamus (Alexander et al., 1986). In primates it is comprised of an external segment (GPe), which serves as an inhibitory relay nucleus within the indirect pathway, and the internal segment (GPi) that aggregates all information from all basal ganglia pathways. While primarily defined by their connectivity and neurophysiological profiles, the GPe and GPi are also distinguishable at the cellular level by differences in cell density, cell type, and morphology (Hardman et al., 2002, Eid et al 2013, Difiglia and Rafols, 1988). One of the most salient differences is that the GPi has a much lower overall neuronal density (see table 2 in Hardman et al., 2002). More importantly, given that the volume of the GPi is smaller than that of the GPe and that both nigrostriatal and striatonigral fibers pass through the globus pallidus on their way to their targets, the GPi also has a greater density of both nigrostriatal and striatonigral efferents than its external counterpart.
Despite the clear morphological differences, in vivo characterization of these critical nuclei and the efferents running through them remains elusive by MRI-based neuroimaging technologies, particularly conventional T1-weighted or T2-weighted imaging sequences used to estimate neuroanatomical structure. This is because T1-weighted and T2-weighted scans have limited power to characterize the microscopic structure of the GPe and the GPi. This limitation can be compensated by the recent advances in high angular resolution diffusion MRI which offers a non-invasive approach to study microscopic structure. For example, Behrens et al. (2003) used gradients of cortical connectivity to parcellate the nuclei of the thalamus and found robust correspondence to known histologically derived subdivisions. A further advantage of diffusion MRI is that it is able to detect microstructural differences in underlying cellular morphologies, including spatial asymmetry in axonal tracts. With these unique features, diffusion MRI has emerged as an increasingly popular tool for characterizing microstructural properties of neural tissue (Abhinav et al., 2014). While most commonly used to study structural subcomponents of large white matter fascicles (Bastiani, 2012, Wang et al, 2013, Fernández-Miranda 2014), diffusion MRI has also been shown to be useful for characterizing differences in local connectivity and anisotropy of gray matter as well (Wiegell et al., 2003; Mang et al., 2012), including sensitivity to both neural and glial distribution patterns (Blumenfeld-Katzir et al., 2011).
Here we adopt an atlas-based approach to studying the orientation distribution functions of the water diffusion, termed spin distribution functions (SDF; Yeh et al. 2010) within the gray matter of the globus pallidus in a stereotaxic space. An SDF provides a nonparametric representation of the diffusion pattern that cannot be offered by conventional tensor-based analysis, thus allowing for characterizing and segmenting structural subcomponents. Unlike tensor-based metrics such as fractional anisotropy, SDFs can also be interpreted in voxels with crossing fiber pathways without violating any methodological assumptions, making them extremely useful in regions with complex microstructural architectures. Here we used data from two high angular resolution diffusion sequences, diffusion spectrum imaging (DSI) and multi-shell imaging (MSI) to examine the diffusion characteristics in the nigral and striatal efferents. The SDF patterns within pallidal voxels were first characterized in the DSI sample and replicated in the MSI sample in order to provide an independent validation data set. Along with characterizing the properties of the SDFs within the pallidum, we also examined whether there are reliable differences in the SDF patterns between the GPe and the GPi that allows for accurate segmentation based solely on diffusion properties. These findings may identify a clear potential for using high angular resolution diffusion MRI as a novel in vivo characterization of the microarchitecture of the human globus pallidus, including the nigral and striatal efferents that break down in various neurological pathologies.
Materials and Methods
Participants and Acquisition
Two separate types of diffusion imaging were used for our analysis.
Diffusion Spectrum Imaging (DSI: CMU-60 Dataset)
Twenty-nine male and thirty-one female subjects were recruited from the local Pittsburgh community and the Army Research Laboratory in Aberdeen Maryland. All subjects were neurologically healthy, with no history of either head trauma or neurological or psychiatric illness. Subject ages ranged from 18 to 45 years of age at the time of scanning, with a mean age of 26 years (+/− 6 standard deviation). Six subjects were left handed (3 males, 3 females).
All participants were scanned on a Siemen’s Verio 3T system in the Scientific Imaging & Brain Research (SIBR) Center at Carnegie Mellon University using a 32-channel head coil. We collected a 50 min, 257-direction DSI scan using a twice-refocused spin-echo EPI sequence and multiple q values (TR = 9,916 ms, TE = 157 ms, voxel size = 2.4mm3, FoV = 231 × 231 mm, b-max = 5,000 s/mm2, 51 slices). Head-movement was minimized during the image acquisition through padding supports and all subjects were confirmed to have minimal head movement during the scan prior to inclusion in the template.
Multi-shell Imaging (MSI; HCP-80 Dataset)
The data were from the Human connectome project at WashU-Minnesota Consortium (Q1 release). Thirty-six male and forty-two female subjects were scanned on a customized Siemens 3T “Connectome Skyra” housed at Washington University in St. Louis. Subject ages ranged from 22 to 36 years of age at the time of scanning, with a mean age of 29.44 (+/− 3.5 standard deviation). All subjects were healthy, with no history of neurological or psychiatric illness. The two subjects that have subsequently been found by the HCP to exhibit gray matter heterotopia have been excluded from this analysis. The HCP DWI session was acquired using a spin-echo EPI sequence and (TR = 5520 ms, TE = 89.5 ms, voxel size = 1.25 mm3, FoV = 210 × 180, 3 shells of b = 1000TR = 5520 ms, TE = 89.5 ms, voxel size = 1.25 mm3, FoV = 210 × 180, 3 shells of b = 2000, 3000 s/mm2, 111 slices, 90-directions for each shell).
Diffusion MRI Reconstruction
All images were processed with a q-space diffeomorphic reconstruction method described previously (Yeh and Tseng, 2011) using DSI Studio (http://dsi-studio.labsolver.org/). The SDFs were reconstructed to a spatial resolution of 1 mm3. The white matter surface was rendered independently from an externally supplied 1 mm3 resolution white matter template. The quantitative anisotropy (QA; Yeh et al., 2010) and fiber orientation of the two major fibers in each voxel were exported into a separate file for analysis.
SDF Analysis
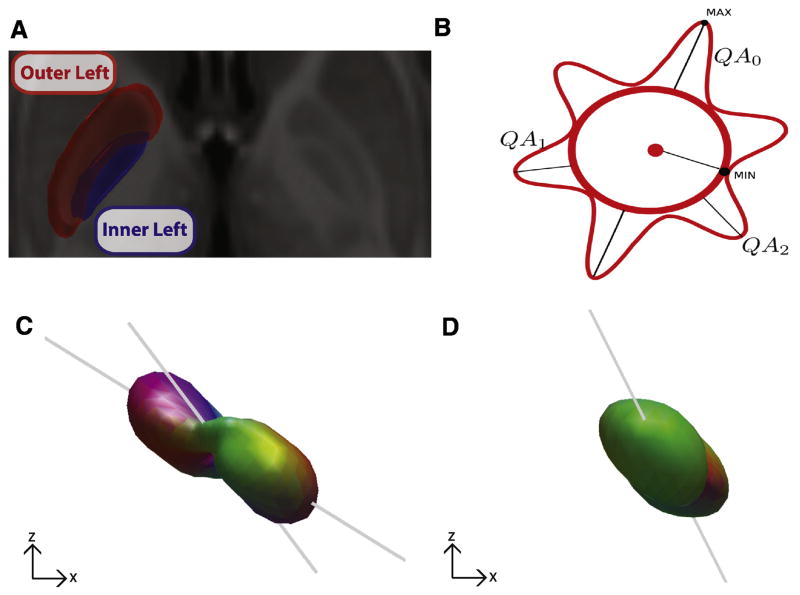
Masks of the inner and outer segments of the pallidum were manually drawn by identifying the internal medullarly lamina in each hemisphere on the high resolution T1 ICBN MNI template. In each hemisphere, the GPe was drawn by including those voxels between the anterior and posterior limbs of the internal capsule, the putamen, and the internal medullary lamina (outer left in Fig. 2A). Similarly, the GPi was drawn by including the voxels between the internal medullary lamina, the posterior limb and genu of the internal capsule (inner left in Fig. 2A). All region of interest masks were drawn in MRICron (Rorden and Brett, 2000) and exported as NifTI images.
Fig. 2.
Comparison of the SDFs between the inner and outer semgents of the globus pallidus. A. The inner (blue) and outer (red) segments of the left and right pallidum were manually drawn on the high resolution T1 ICBM 152 template. B. Schematized version of an SDF illustrating three resolved fibers (QA0, QA1, QA2), their magnitude (i.e., lengths, reflecting QA) and orientation. C,D Representative SDFs from the left internal segment (C) and left external segment (D) in the coronal plane from a single subject from the DSI dataset. Gray lines indicate direction of fiber orientations.
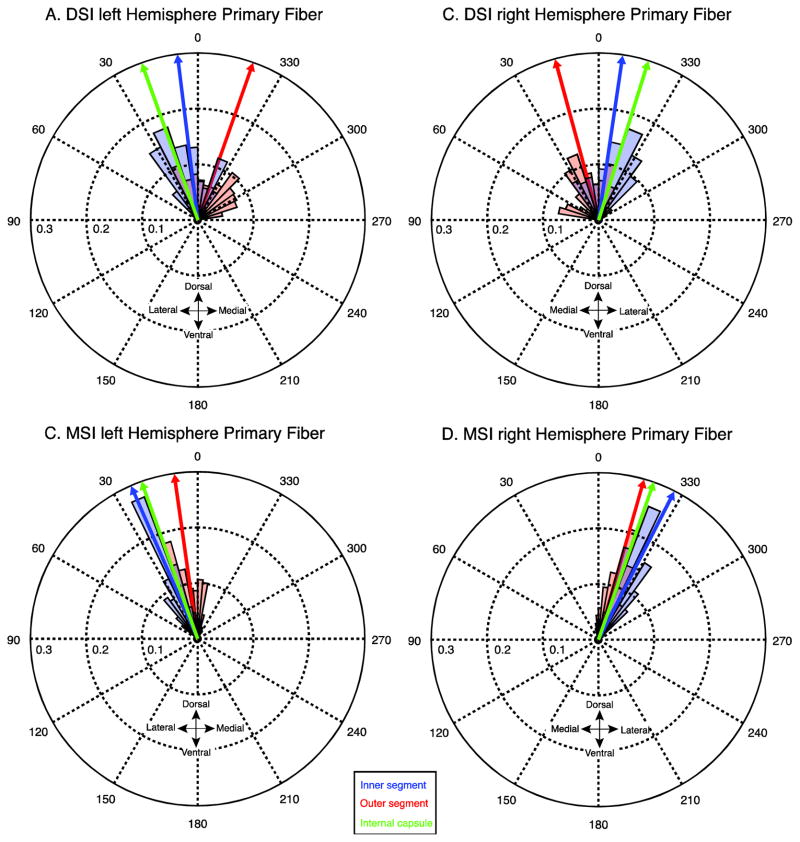
We then isolated the SDFs within each voxel of both region masks for analysis. For illustration, Fig. 2B shows a schematized version of a SDF illustrating three resolved fibers, with their independent magnitude (i.e., lengths, reflecting QA) and orientation. Two representative 3D SDFs from a voxel within the left GPi and a voxel within the left GPe are shown in Fig. 2 C,D. For each voxel, we took three independent measures of the SDF structure: the primary fiber orientation, the number of resolved fibers across a range of QA thresholds, and the QA magnitude of the primary fiber. To generate the angular distribution histograms (Figs. 3,4), we used the circstat toolbox (Berens 2009) and computed the circular mean of the voxel orientations across subjects. The internal capsule orientation (green arrows in Fig. 3,4) was calculated by averaging the primary fiber orientations across a 4mm3 voxel cube situated prominently within the internal capsule in the left and right hemispheres. For plotting purposes, a gaussian smoothing kernel was applied to the QA maps (Fig. 6 A–D) for each subject (2 FWHM).
Fig. 3.
Angular distributions of mean primary fibers from the DSI (A,B) and MSI (C,D) datasets. The orientation of the primary fibers in each voxel are averaged across subjects and binned (red and blue shaded regions). The size of the shaded regions (bins) correspond to the mass of the distribution that is concentrated at that orientation for the inner segment (blue) and outer segment (red). Blue, red, and green arrows indicate the circular mean of the distributions in the inner, outer and internal capsule respectively.
Fig. 4.
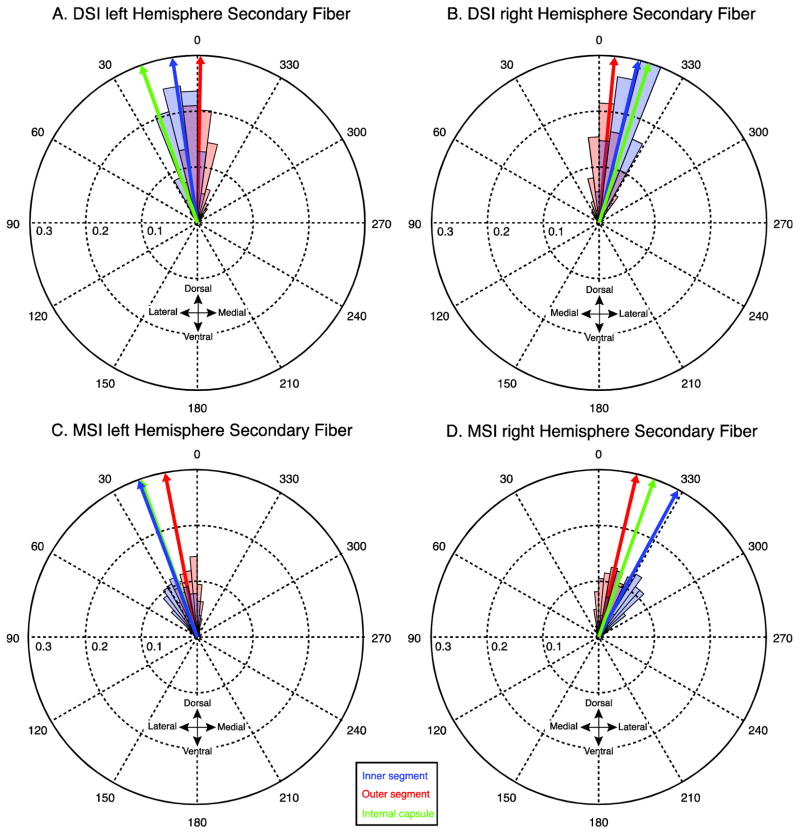
Angular distributions of mean secondary fibers from the DSI (A,B) and MSI (C,D) datasets. The orientation of the secondary fibers in each voxel are averaged across subjects and binned (red and blue shaded regions). The size of the shaded regions (bins) correspond to the mass of the distribution that is concentrated at that orientation for the inner segment (blue) and outer segment (red). Blue, red, and green arrows indicate the circular mean of the distributions in the inner, outer and internal capsule respectively.
Fig. 6.
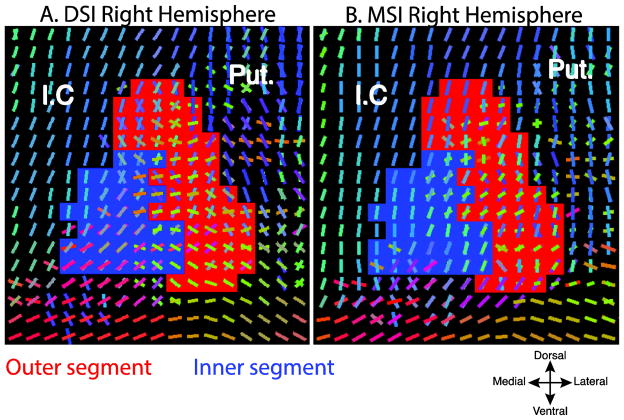
Voxelwise geometries of the primary and secondary fibers, inner (blue) and outer (red), segments of two example subjects from the DSI (A) and MSI (B) datasets. Slices are both from y = −1 (MNI). (Putamen (Put.), Internal capsule (I.C.). Fiber orientations are color coded according to their orientation.
We extracted the primary fiber orientation, the number of fibers in each voxel, and the QA of the primary fiber from all voxels in each mask. Then we clustered the combined data across both masks using these diffusion features with a standard clustering approach in Matlab (R2014a). We specified two clusters, corresponding to the two subnuclei of the globus pallidus, used squared euclidean distance as the distance metric and the k-means++ algorithm for cluster center initialization (replicates = 10). The clusters to the inner and outer segment were assigned based on the number of correctly assigned voxels relative to the hand drawn masks. This algorithm generated inner and outer segment maps for each subject and hemisphere in each dataset. To generate the probabilistic maps of each segment across all subjects in a sample (Fig. 7), voxel probabilities were estimated by averaging the binary categorization of each voxel in the inner and outer segment maps. Separate probability masks were calculated for in the DSI and MSI data sets, as well as across both samples (Merged). In order to quantify accuracy, we defined the classification accuracy as the number of voxels correctly assigned to the inner/outer segment from the k-means analysis using the manual segmentation as the correct assignment divided by the total number of voxels in that segment (Fig. 8).
Fig. 7.
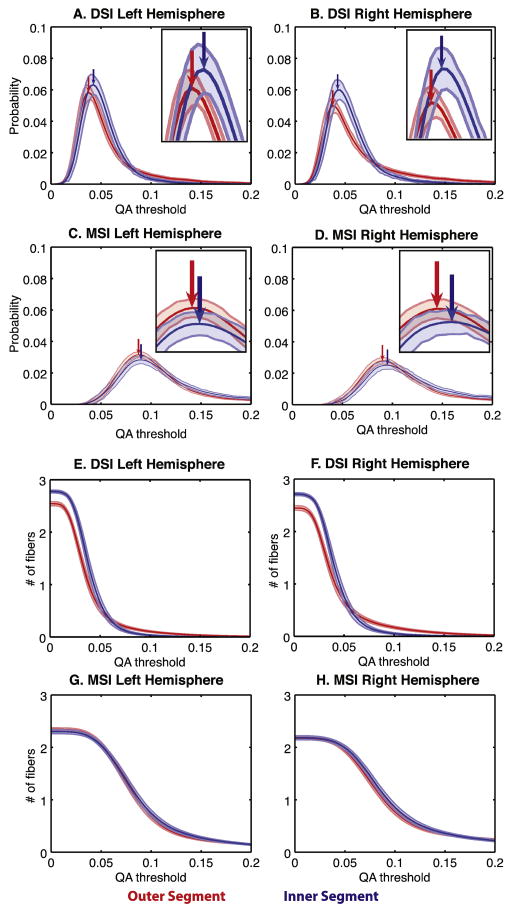
A–D. Probability density functions of the primary fiber QA of the inner (blue) and outer (red) segments in the DSI(A,B) and MSI(C,D) datasets. E–H The number of resolved fibers thresholded by QA in the inner and outer segments in the DSI (A,B) and MSI datasets (C,D). Arrows indicate peaks of the distributions. Lines indicate mean and shaded regions are 95% confidence intervals.
Fig. 8.
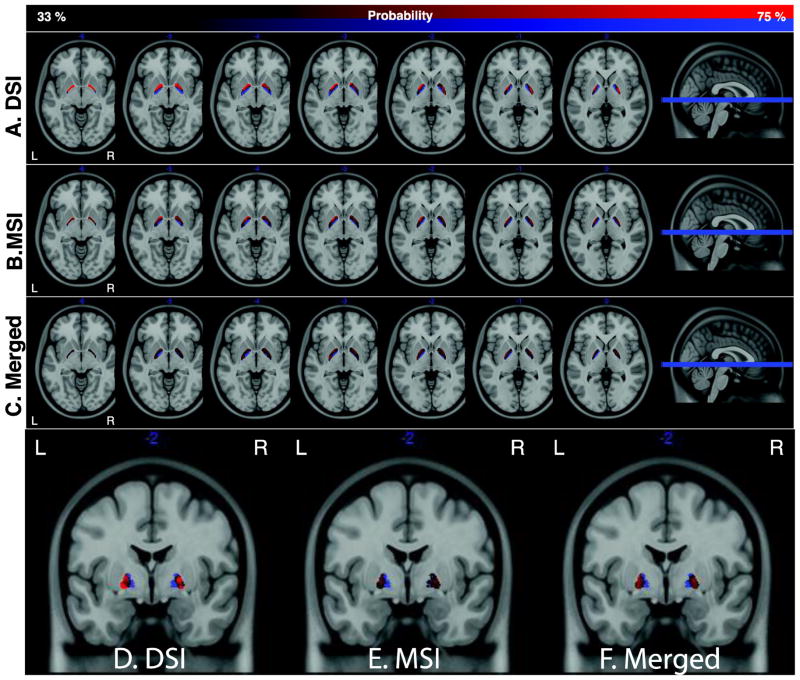
A–C. Probabilistic maps, across subjects, of the inner and outer segments in the DSI (A), MSI (B), and merged (C) datasets. Maps are thresholded between 33–77% probability. The background image in each image is the T1 ICBM template. Axial images span z coordinates [−6,0]. D–F. Coronal images of the same probabilistic maps at y = −2.
Accuracy of the clustered segments was compared against the hand-segmented region of interest masks and a chance null distribution was estimated using a permutation procedure. On each iteration of the permutation test, every pallidal voxel was pseudorandomly assigned to either the inner or outer segment. The voxel’s permuted assignment was then compared to the voxel’s real assignment in the manually segmented pallidum masks and counted as correct if it matched that assignment. All of the correct assignments were counted for each iteration of the permutation test (n=1000). Chance accuracies were tallied across all iterations and averaged and compared against the 95% confidence intervals of the true accuracies.
To quantify how much each feature contributes to the separation of the two pallidal segments, we used logistic regression on both samples (i.e., DSI and MSI) and in each hemisphere separately. Based on the hand-drawn masks we assigned voxels in the internal segment a value of 1 and voxels in the external segment a value of 0. For each subject, the three features used for clustering, coronal angle of the primary fiber, number of fibers, and QA, were standardized (z-scored) and submitted to a binary logistic regression using the glmfit function in Matlab. A summary of the model fits is shown in Table 1.
Table 1.
Results of the logistic regression fit to each subject in the DSI and MSI datasets for the left and right pallidum. Each value indicates mean (standard error).
| p-Value(%<0.05) | R2 | Beta | |||||||||
|---|---|---|---|---|---|---|---|---|---|---|---|
|
|
|||||||||||
| Region | Model | Angle | # of Fibers | QA | Model | Angle | # of Fibers | QA | Angle | # of Fibers | QA |
| DSI-L | 100% | 95% | 88% | 43% | 0.075 (0.0052) | 0.041 (0.0044) | 0.027 (0.0027) | 0.014 (0.0025) | 0.50 (0.032) | 0.45 (0.026) | −0.054 (0.033) |
| DSI-R | 100% | 90% | 83% | 37% | 0.062 (0.0050) | 0.029 (0.0038) | 0.030 (0.0031) | 0.023 (0.0030) | −0.38 (0.032) | 0.37 (0.024) | −0.14 (0.031) |
| MSI-L | 97% | 94% | 53% | 54% | 0.028 (0.0017) | 0.020 (0.0017) | 0.0037 (0.0006) | 0.0027 (0.0004) | 0.33 (0.016) | −0.16 (0.021) | −0.20 (0.018) |
| MSI-R | 97% | 92% | 36% | 62% | 0.022 (0.0014) | 0.014 (0.0012) | 0.0026 (0.0004) | 0.0046 (0.0007) | −0.28 (0.013) | −0.12 (0.020) | −0.23 (0.020) |
Results
Dorsolateral orientation of the pallidal diffusion signal
The nigrostriatal and striatonigral fibers traverse the pallidum on the way to their targets, resulting in a primarily dorsolateral-ventromedial orientation of the collective axons (Fig. 1A). In humans, the two segments of the pallidum are separated by a thin white matter band, called the internal medullary lamina, shown in coronal sections from the Big Brain atlas in Fig. 1B and 1C (Amunts et al., 2013). To characterize the orientations of the fibers in the inner and outer segment of the globus pallidus, we isolated the voxels corresponding to the two segments (Methods, Fig 2A). Within each of these region masks we estimated the SDFs from the diffusion signal of each voxel (Fig 2B–D), which is a 3D representation of the underlying diffusion orientation distribution. The first three peaks in each SDF were extracted and their orientation and anisotropy intensity, called quantitative anisotropy (QA; Fig. 2B, see Methods), were recorded for every voxel in each mask. Two representative SDFs from an example subject from the DSI dataset show how the shapes of the SDFs differ between the inner (Fig. 2C) and outer (Fig. 2D) segments of the pallidum.
Fig. 1.
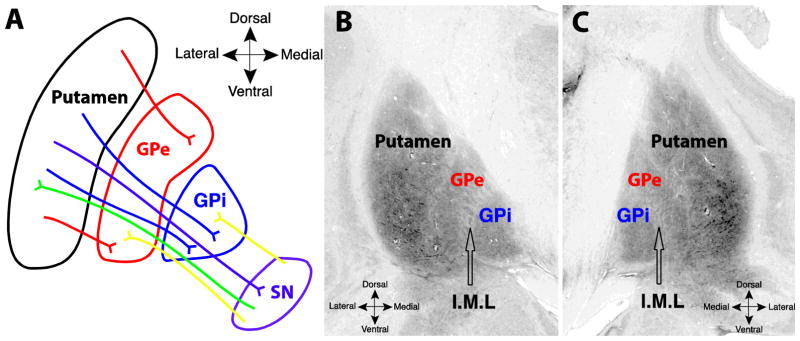
A. Schematic of fiber systems traversing the internal (GPi) and external (GPe) segments of the pallidum, including projections to and from the substantia nigra. Labeled pathways include nigrostriatal (green) striatopallidal (red, blue), nigropallidal (yellow), and striatonigral (purple). B and C. Coronal images from the Big Brain atlas, showing the putamen, GPe, and GPi, in the left (B) and right (C) hemispheres; black arrows point to the approximate center of the internal medullary lamina (I.M.L) separating the two segments (slice 3894, Amunts 2013).
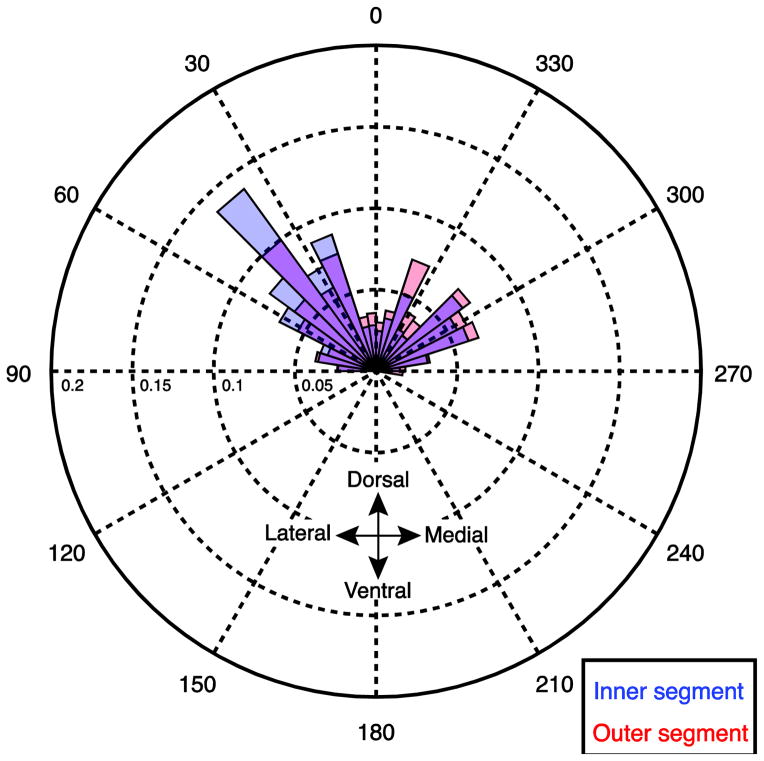
Figure 3 shows the distribution of principal fiber angles across subjects in the DSI and MSI samples. Each distribution was confirmed to be non-uniform using a Rayleigh’s test (z values > 36.12, p-values < 0.001) and exhibited consistent peaks in the orientations in the fibers in both region masks and both data samples. In both the DSI and MSI samples, the distribution of the angles in the inner segment is predominately concentrated in the dorsolateral direction, consistent with the known orientation of the major nigral and striatal efferents (Wilson 1914, Szabo 1967, Szabo 1962, Fox and Rafols, 1976, Carpenter and Peter 1972). Compared to the inner segment, the distribution of the angles in the outer segment is rotated medially, clockwise in the left hemisphere and anticlockwise in the right hemisphere. Interestingly, this rotation is more pronounced in the DSI dataset, resulting in the majority of fibers pointing dorsomedially (towards the internal capsule). One possibility is that the predominantly dorsal and dorsolateral fiber systems are not contributing to the strongest anisotropy pattern in the DSI sample, but are still present at lower anisotropy thresholds. To explore this, we looked at the orientation of the secondary fibers in both datasets (Fig. 4). Indeed, in the right hemisphere the secondary fiber in the DSI dataset was oriented in a more dorsolateral direction as predicted if it were reflecting the angle of the underlying nigral and striatal efferents (red histogram in Fig. 4 B). However, the orientations of the fibers in the left external segment are clustered around 0 degrees (Fig. 4A). We determined that this is due to a bimodal distribution in the outer segment fibers which can be clearly seen by comparing the angular distributions of the raw (non-averaged) data from every subject and voxel (see Fig. 5): one distribution has a peak oriented in a dorsolateral direction, consistent with the orientation of the efferent pathways running through the pallidum, and a second with a peak oriented in a dorsomedial direction. This bimodal pattern causes the circular mean to collapse towards 0 degrees (i.e., dorsally). Therefore, the DSI dataset is more sensitive to a distinct fiber system within the external segment that is not detected in the MSI sample and contributes to the purely dorsal directional estimate in the mean fiber directions for the outer segment.
Figure 5.
Angular distributions of all secondary fiber orientations (non-averaged) from every subject in the left hemisphere of the DSI sample. The size of the shaded regions (bins) correspond to the mass of the distribution that is concentrated at that orientation for the inner segment (blue) and outer segment (red).
These patterns of fiber peak orientations within the SDF are also clearly visible in the geometries of the extracted fibers at each voxel. Figure 6 shows a coronal slice from two representative subjects from the DSI and MSI samples. A majority of the primary and secondary fibers overlap in the inner segment (blue voxels) and are generally oriented dorsolaterally, whereas the primary and secondary fibers in the external segment (red voxels) show less overlap and exhibit a greater abundance of dorsomedial orientations as compared to the internal segment. Thus, the gray matter diffusion signal within the pallidal nuclei has asymmetries in peak anisotropy directions that are consistent with the orientation of nigral and striatal efferents running through the pallidum, suggesting that the diffusion signal is sensitive to these underlying pathways.
Differential diffusion patterns between inner & outer pallidal segments
Along with differences in fiber orientation, we also observed general differences in the sensitivity and intensity of the diffusion signal between the two pallidal segments. Tensor-based analyses have shown that the anisotropy patterns around the principal fiber direction tend to be highly sensitive to underlying cellular morphology differences (Wiegell et al., 2003). Figure 7, panels A through D, shows the across-subject probability distributions of the mean QA in the principal fiber direction, for both pallidal segments. The peaks (arrows) of the distributions occurred at consistently higher thresholds in the inner segment in both hemispheres and both samples. Thus, the inner segment exhibited a mean shift in QA compared to the outer segment mask, suggesting a slightly stronger diffusion intensity for the inner pallidal segment.
Differences between the pallidal segments were also reflected in the complexity of the SDF geometry. The sensitivity curves in Figure 7, panels E through H, show the average number of resolved fibers (y-axis) as a function of QA threshold (x-axis). Thus this measures the complexity of the diffusion geometry in each voxel by showing the robustness of the fiber peaks within the reconstructed SDF across a range of thresholds. As expected, the number of resolved fibers decays rapidly as the threshold increases. Notably, compared to the outer segment, in the DSI sample we detected more fibers in the inner segment at thresholds less than QA = 0.05 (Fig. 7 E,F), and more fibers in the outer segment at thresholds higher than 0.05. In the MSI sample, these distributions largely overlapped (Fig. 7 G,H), although the inner segment in the right hemisphere showed a smaller shift in the same direction as was observed in the DSI dataset. Taken together, the differences in orientation, intensity and sensitivity between the structures suggest that the diffusion signal is picking up on reliable differences in the cellular content of the two nuclei.
Reliable segmentation of pallidal nuclei
If these differences are reflecting distinctive cellular architectures and local connectivity patterns then it should be possible to classify the two segments based purely on the properties of the DWI signal. To this end we used k-means clustering to segment all voxels within the globus pallidus using three voxel features as inputs: primary fiber orientation, anisotropy of the peak fiber, and number of detected fibers. Based on these properties alone, we generated probabilistic maps of the inner and outer segments for both the DSI and MSI samples (Fig. 8 A,B). Qualitative comparison of these maps shows a reliable and highly similar pattern of segmentation between the two pallidal regions. This is particularly evident in regions where outer and inner segments are divided along a curve approximately situated on the internal medullarly lamina in both hemispheres (Fig. 8 A,B, and coronal slices Fig. 8 D–E).
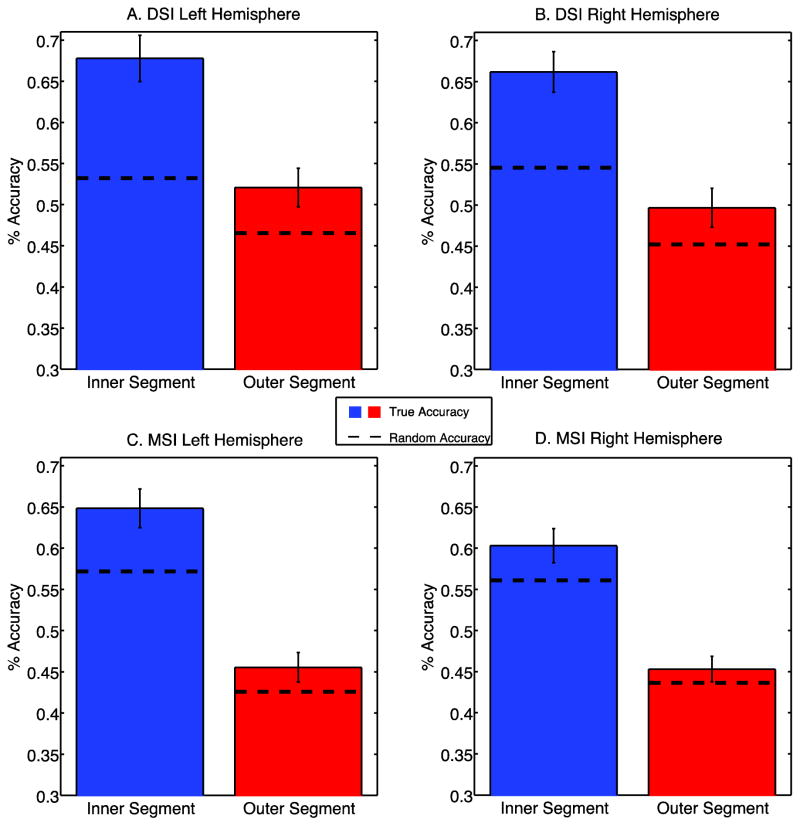
While these segmentation maps are not as clean as the hand-drawn maps based on the T1 signal (Fig. 2A), the general pattern of clustering is much better than expectations from chance. To explicitly quantify this, we compared the automatic segmentations to the hand drawn maps against chance accuracies generated from a permutation test (see Methods). Random accuracies ranged from 22% to 77% and were consistently higher in the inner segment (37% to 77%) relative to the outer segment (22% to 62%) reflecting the fact that there were fewer voxels within the inner segment and thus a higher chance of randomly overlapping with the correct assignment. As can be seen in Fig. 9, our classification significantly outperformed chance in all cases except the right hemisphere of the outer segment in the MSI dataset (Fig. 9D). Furthermore, accuracies were generally higher in the DSI sample than the MSI sample, likely due to the fact that the DSI sample was separable along all three features included in the clustering, while the MSI sample was not clearly separable based on the sensitivity curve measure (Fig. 7G–H).
Fig. 9.
A–D. Mean accuracy results from k-means classification in the DSI (A,B) and MSI (C,D) datasets. Dotted lines show random accuracies obtained from 1000 iterations of a permutation test where clustered categories were scrambled. Error bars indicate 95% confidence intervals across subjects.
In order to quantify how much each feature contributes to the separation of the two nuclei, we used a logistic regression model to evaluate each SDF feature independently (Table 1). On average, the coronal angle and the number of fibers each account for similar proportions of the variance between the inner and outer segments (0.0026–0.041%), while the QA value of the primary fiber accounted for the smallest proportion of variance (0.0027–0.023%). On average, the primary fiber angle was the most significant predictor of pallidal segment. This suggests that the primary fiber orientation is the dominant feature, although all three features do appear to contribute to the clustering results.
Consistency across data sets
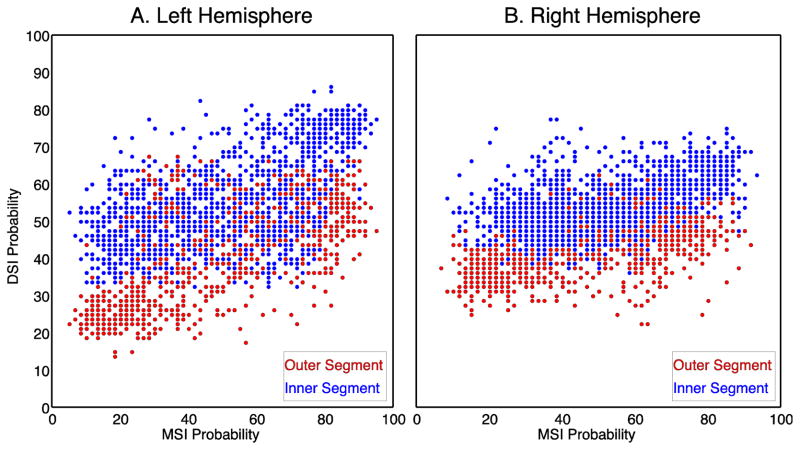
So far we have shown that both DSI and MSI samples exhibit similar differences in the pallidal segment diffusion signals and similar automatic parcellations of the internal and external pallidal masks. In order to quantify the similarity of the results between the two samples, we correlated the voxelwise probabilities between the DSI and MSI datasets (Fig. 10) for the internal and external segments separately. Overall, voxelwise probabilities between the two samples were moderately correlated in both hemispheres (r(138) =0.67 in left hemisphere vs. r(138) = 0.56 in the right hemisphere), suggesting that the SDF signal is capturing reliable topographic differences in underlying microstructural properties that is generally consistent across samples and the type of diffusion imaging approach used.
Fig. 10.
The voxelwise MSI probability (averaged across individual subjects) plotted against voxelwise DSI probability for each voxel in the left (A) and right (B) hemispheres. Each point corresponds to an individual voxel in either the outer (red) or inner (blue) segment.
Because both the DSI and MSI samples provided similar probability profiles, we aggregated both data sets to form a composite probabilistic map of the internal and external pallidal segments based on the underlying diffusion structure. These merged maps are shown in Figure 8C,F. Collapsing across the two acquisition methods revealed an even clearer distinction between the two pallidal nuclei. This confirms that classification-based purely on the properties of the diffusion signal is sufficiently robust across differences in acquisition approach and scan environments to capture the major divisions of the inner and outer segments of the globus pallidus.
Discussion
For the first time we are able to show that the orientation distribution of the diffusion within the human pallidum is consistent with the presence of nigral and striatal efferents that run through these nuclei. Because a large portion of these pathways is buried within the pallidum, a region of high iron density, visualization of these efferents has been challenging with conventional imaging approaches. If diffusion MRI proves to be a reliable method of assessing the integrity of these pathways and their degradation in movement disorders, then quantifying degradation within the pallidum will be necessary to obtain accurate measurements of associated changes. We have demonstrated that the SDF was also able to pick up on established histological differences between the internal and external segment of the globus pallidus (Hardman et al., 2002, Eid et al., 2013, Difiglia and Rafols 1988), resulting in the first automatic segmentation of these two nuclei. Thus, these measures are sufficiently robust to detect known differences in the pallidal segments. Furthermore, these differences in the diffusion signal between the internal and external segments were mostly consistent regardless of the acquisition method used (i.e., DSI vs. MSI) and able to classify the separate segments with accuracies well above chance expectations.
Although diffusion anisotropy measures are typically used to visualize pathways within core white matter regions of the brain, we showed that tissue characteristics derived from the diffusion MRI signal, including differences in connectivity, intensity and sensitivity, can distinguish nuclear properties within the pallidum itself (see also Wiegell et al., 2003; Mang et al., 2012). We presume that orientations of the fibers in the two pallidal nuclei along with differences in density and myelination contribute to the characteristics of the SDFs within these voxels (Beaulieu, 2002). The predominately dorsolateral orientation of the resolved fiber peaks within the pallidal segments is consistent with the primary orientation of the striatopallidal, striatonigral and nigrostriatal/pallidal tracts (Wilson 1914, Szabo 1967, Szabo 1962, Fox and Rafols, 1976, Carpenter and Peter, 1972). The more pronounced dorsolateral orientation of the internal segment compared to the external segment in both the primary (Fig. 3) and secondary fibers (Fig. 4) is consistent with the volumetric differences between the two segments, since the nigrostriatal and striatonigral fibers traverse both segments. The medial shift observed in the outer segment (Fig. 3) is likely reflecting a distinct fiber system, possibly projections from the subthalamic nucleus. This open question can be resolved by a direct comparison of SDFs with postmortem histological analysis, which should be a goal of future work.
We should point out that the orientation of the peak fibers may not be completely consistent across diffusion imaging approaches. For example, there is a more pronounced medial shift in the external segment orientations in the DSI sample (Fig. 3A,B) than in the MSI sample (Fig. 3 C,D). This may be due to the fact that the DSI sample is more sensitive to underlying microarchitectural features that contribute to a medial bias in the SDF signal. However, the secondary fiber in this sample was oriented in a more dorsal and dorsolateral direction (Fig. 4, 5). This suggests that these nigral and striatal efferents are also present in the DSI sample, but to a weaker degree than in the MSI sample. This difference is likely due to the diffusion sampling scheme used in DSI and MSI. The DSI used a stronger diffusion sensitization strength (i.e. higher b-value) than the MSI, and it is more sensitive to restricted diffusion in gray matter.
Our results have relevance to the investigation of basal ganglia function in neurologically healthy individuals. In the canonical direct-indirect pathway model of motor facilitation (Albin et al., 1989, DeLong 2000), activity in the GPe is correlated with inhibiting movement initiation, through disinhibition of the sub-thalamic nucleus, which in turn excites the GPi/SNr. Conversely, during movement facilitation, activity within the GPi decreases. Dysfunction of the direct and indirect pathways results in an imbalance between the two circuits, which causes impaired motor production as seen in Parkinson’s and Huntington’s disease. If the efficiency of processing with striatopallidal pathways is reflected in their microstructural integrity, then individual variation in performance on tasks may be correlated with the QA distributions of the striatopallidal fiber systems. In addition, being able to detect signatures of the underlying cellular content of the pallidal nuclei in vivo has the potential to be a biomarker for measuring the integrity of basal ganglia pathways in neurological pathologies. Degradation of nigropallidal pathways, or changes in nigropallidal plasticity (Whone et al. 2003), may be reflected in the integrity of the microstructural architecture exhibited by the SDFs within the pallidum. Future comparative and clinical studies are needed in order to evaluate this hypothesis.
While our present results show promise for using the diffusion imaging signal as a measure of cellular architecture within sub-cortical nuclei, this approach still has some inherent limitations. First, as mentioned previously, diffusion imaging provides an indirect measure of cellular architecture. While validation work in animal models has provided insights into the underlying cellular properties for white matter using tensor-based reconstruction approaches (Wang et al., 2011, Wang et al., 2014, Thomas et al., 2014, Vollmar et al 2010), model-based approaches have not been validated against histological models, particularly in gray matter (Blumenfeld-Katzir et al., 2011). Therefore, we do not know for sure what properties of the SDF reflect what properties of the underlying tissue. Future studies could probe precisely how changes in SDF properties are associated with variations in density, number of fibers, and myelination, by combining histological analysis and diffusion imaging in animal models and post mortem tissue analysis of the pallidum.
In addition, although we demonstrated that the boundaries of the pallidal nuclei are resolvable based solely on diffusion information, the segmentations are imperfect. In particular, there is a cluster of voxels in the anterior region of the pallidum that was misclassified in a significant number of subjects, and the parcellations were less accurate in the MSI data set as a whole. The proximity of the globus pallidus to the major white matter tracts of the internal capsule may contribute to partial voluming problems that contaminate the SDF signal in these voxels, resulting in classification errors. Future work could adaptively cluster using more sophisticated approaches to allow for noise clusters that could arise from errors in masking.
Despite this partial voluming problem, the segmentation results reported here still provide evidence of robust differences between the segments of the human pallidum. For example, unlike most subcortical parcellations (e.g. Wiegell et al., 2003), we are not supplementing the clustering features with additional distance information that adds a strong prior on expected location of the nuclei. Such spatial priors would dramatically clean up the underlying maps; however, the distance from the expected nuclear location would become the dominant clustering feature. Although omitting these priors may lead to noisier segmentations, our approach provides a more robust measure for future studies to assess the pallidal cellular integrity in clinical populations.
Regardless of these limitations we have shown that the inner and outer segments of the globus pallidus not only express common asymmetries in their underlying SDFs, consistent with major efferent pathways, but also reliably differ among several properties of the diffusion signals. This was reliable enough that a simple and automatic clustering approach, based on properties of the SDF, resolved the inner and outer segments better than chance, regardless of the imaging acquisition used (i.e., DSI or MSI). This population atlas based analysis approach enables future studies to quantify the extent to which microstructural variability correlates with functional properties of the system, such as individual differences in inhibitory control ability and or clinical pathologies of the underlying fiber systems. This provides a powerful new tool for investigating the cellular architecture of basal ganglia systems in vivo.
Highlights.
Fiber pathways passing through the human globus pallidus are difficult to visualize.
Diffusion signal in pallidal voxels consistent with direction of efferents pathways.
Diffusion MRI provides an unbiased method of parcellating the globus pallidus.
Probabilistic parcellations of pallidum are consistent across multiple datasets.
Acknowledgments
Data were provided [in part] by the Human Connectome Project, WU-Minn Consortium (Principal Investigators: David Van Essen and Kamil Ugurbil; 1U54MH091657) funded by the 16 NIH Institutes and Centers that support the NIH Blueprint for Neuroscience Research; and by the McDonnell Center for Systems Neuroscience at Washington University. This project was also supported in part by NSF BIG-DATA grant 1247658 and the Army Research Laboratory under Cooperative Agreement Number W911NF-10-2-0022. The views and conclusions contained in this document are those of the authors and should not be interpreted as representing the official policies, either expressed or implied, of the Army Research Laboratory or the U.S. Government. The U.S. Government is authorized to reproduce and distribute reprints for Government purposes notwithstanding any copyright notation herein. This research was also supported in part by T32 NS007433-17.
Footnotes
Publisher's Disclaimer: This is a PDF file of an unedited manuscript that has been accepted for publication. As a service to our customers we are providing this early version of the manuscript. The manuscript will undergo copyediting, typesetting, and review of the resulting proof before it is published in its final citable form. Please note that during the production process errors may be discovered which could affect the content, and all legal disclaimers that apply to the journal pertain.
References
- Abhinav K, Yeh F-C, Pathak S, Friedlander RM, Fernandez-Miranda JC. Advanced diffusion MRI fiber tracking in neurosurgical and neurodegenerative disorders and neuroanatomical studies: A review. Biochimica et Biophysica Acta (BBA) - Molecular Basis of Disease. 2014 doi: 10.1016/j.bbadis.2014.08.002. [DOI] [PubMed] [Google Scholar]
- Albin RL, Young AB, Penney JB. The functional anatomy of basal ganglia disorders. Trends in Neurosciences. 1989;12(10):366–375. doi: 10.1016/0166-2236(89)90074-X. [DOI] [PubMed] [Google Scholar]
- Alexander GE, DeLong MR, Strick PL. Parallel organization of functionally segregated circuits linking basal ganglia and cortex. Annual Review of Neuroscience. 1986;9:357–381. doi: 10.1146/annurev.neuro.9.1.357. [DOI] [PubMed] [Google Scholar]
- Amunts K, Lepage C, Borgeat L, Mohlberg H, Dickscheid T, Rousseau M-E, Evans AC. BigBrain: an ultrahigh-resolution 3D human brain model. Science (New York, NY) 2013;340(6139):1472–5. doi: 10.1126/science.1235381. [DOI] [PubMed] [Google Scholar]
- Bastiani M, Shah NJ, Goebel R, Roebroeck A. Human cortical connectome reconstruction from diffusion weighted MRI: The effect of tractography algorithm. NeuroImage. 2012;62(3):1732–1749. doi: 10.1016/j.neuroimage.2012.06.002. [DOI] [PubMed] [Google Scholar]
- Behrens TEJ, Johansen-Berg H, Woolrich MW, Smith SM, Wheeler-Kingshott CAM, Boulby PA, Matthews PM. Non-invasive mapping of connections between human thalamus and cortex using diffusion imaging. Nature Neuroscience. 2003;6(7):750–757. doi: 10.1227/01.NEU.0000309595.77090.89. [DOI] [PubMed] [Google Scholar]
- Beaulieu C. The basis of anisotropic water diffusion in the nervous system - A technical review. NMR in Biomedicine. 2002 doi: 10.1002/nbm.782. [DOI] [PubMed] [Google Scholar]
- Berens P. CircStat: A MATLAB toolbox for circular statistics. Journal of Statistical Software. 2009;31:1–21. doi: 10.1002/wics.10. [DOI] [Google Scholar]
- Blumenfeld-Katzir T, Pasternak O, Dagan M, Assaf Y. Diffusion MRI of structural brain plasticity induced by a learning and memory task. PLoS ONE. 2011;6(6) doi: 10.1371/journal.pone.0020678. [DOI] [PMC free article] [PubMed] [Google Scholar]
- Burke RE, O’Malley K. Axon degeneration in Parkinson’s disease. Experimental Neurology. 2013 doi: 10.1016/j.expneurol.2012.01.011. [DOI] [PMC free article] [PubMed] [Google Scholar]
- Carpenter MB, Peter P. Nigrostriatal and nigrothalamic fibers in the rhesus monkey. The Journal of Comparative Neurology. 1972;144(1):93–115. doi: 10.1002/cne.901440105. [DOI] [PubMed] [Google Scholar]
- Carpenter MB, Mcmasters RE. Lesions of the Substantia Nigra in the Rhesus Monkey. Efferent Fiber Degeneration and Behavioral Observations. The American Journal of Anatomy. 1964;114:293–319. doi: 10.1002/aja.1001140209. [DOI] [PubMed] [Google Scholar]
- Cossette M, Lévesque M, Parent A. Extrastriatal dopaminergic innervation of human basal ganglia. Neuroscience Research. 1999;34(1):51–54. doi: 10.1016/s0168-0102(99)00029-2. [DOI] [PubMed] [Google Scholar]
- DeLong MR. Primate models of movement disorders of basal ganglia origin. Trends in Neurosciences. 1990;13(7):281–285. doi: 10.1016/0166-2236(90)90110-V. [DOI] [PubMed] [Google Scholar]
- Adam R, Leff A, Sinha N, Turner C, Bays P, Draganski B, Husain M. Dopamine reverses reward insensitivity in apathy following globus pallidus lesions. Cortex. 2013;49(5):1292–1303. doi: 10.1016/j.cortex.2012.04.013. [DOI] [PMC free article] [PubMed] [Google Scholar]
- Difiglia M, Rafols JA. Synaptic organization of the globus pallidus. Journal of Electron Microscopy Technique. 1988;10(3):247–263. doi: 10.1002/jemt.1060100304. [DOI] [PubMed] [Google Scholar]
- Eid L, Champigny MF, Parent A, Parent M. Quantitative and ultrastructural study of serotonin innervation of the globus pallidus in squirrel monkeys. European Journal of Neuroscience. 2013;37(10):1659–1668. doi: 10.1111/ejn.12164. [DOI] [PubMed] [Google Scholar]
- Fernández-Miranda JC, Wang Y, Pathak S, Stefaneau L, Verstynen T, Yeh FC. Asymmetry, connectivity, and segmentation of the arcuate fascicle in the human brain. Brain Structure and Function. 2014 doi: 10.1007/s00429-014-0751-7. [DOI] [PubMed] [Google Scholar]
- Fox CA, Rafols JA. The striatal efferents in the globus pallidus and in the substantia nigra. Research Publications - Association for Research in Nervous and Mental Disease. 1976;55:37–55. [PubMed] [Google Scholar]
- Haber SN, Fudge JL, McFarland NR. Striatonigrostriatal pathways in primates form an ascending spiral from the shell to the dorsolateral striatum. The Journal of Neuroscience: The Official Journal of the Society for Neuroscience. 2000;20(6):2369–2382. doi: 10.1523/JNEUROSCI.20-06-02369.2000. http://www.jneurosci.org/content/20/6/2369. [DOI] [PMC free article] [PubMed] [Google Scholar]
- Haber SN. The primate basal ganglia: Parallel and integrative networks. Journal of Chemical Neuroanatomy. 2003;26:317–330. doi: 10.1016/j.jchemneu.2003.10.003. [DOI] [PubMed] [Google Scholar]
- Hardman CD, Henderson JM, Finkelstein DI, Horne MK, Paxinos G, Halliday GM. Comparison of the basal ganglia in rats, marmosets, macaques, baboons, and humans: Volume and neuronal number for the output, internal relay, and striatal modulating nuclei. Journal of Comparative Neurology. 2002;445(3):238–255. doi: 10.1002/cne.10165. [DOI] [PubMed] [Google Scholar]
- Hollerman JR, Tremblay L, Schultz W. Involvement of basal ganglia and orbitofrontal cortex in goal-directed behavior. Progress in Brain Research. 2000;126:193–215. doi: 10.1016/S0079-6123(00)26015-9. [DOI] [PubMed] [Google Scholar]
- Mang SC, Busza A, Reiterer S, Grodd W, Klose AU. Thalamus segmentation based on the local diffusion direction: A group study. Magnetic Resonance in Medicine. 2012;67(1):118–126. doi: 10.1002/mrm.22996. [DOI] [PubMed] [Google Scholar]
- Reiner A, Albin RL, Anderson KD, D’Amato CJ, Penney JB, Young AB. Differential loss of striatal projection neurons in Huntington disease. Proceedings of the National Academy of Sciences of the United States of America. 1988;85(15):5733–5737. doi: 10.1073/pnas.85.15.5733. [DOI] [PMC free article] [PubMed] [Google Scholar]
- Rorden C, Brett M. Stereotaxic display of brain lesions. Behavioural Neurology. 2000;12(4):191–200. doi: 10.1155/2000/421719. [DOI] [PubMed] [Google Scholar]
- Szabo J. The efferent projections of the putamen in the monkey. Experimental Neurology. 1967;19(4):463–476. doi: 10.1016/0014-4886(67)90166-5. [DOI] [PubMed] [Google Scholar]
- Szabo J. Topical distribution of the striatal efferents in the monkey. Experimental Neurology. 1962;5(1):21–36. doi: 10.1016/0014-4886(62)90067-5. [DOI] [Google Scholar]
- Thomas C, Ye FQ, Irfanoglu MO, Modi P, Saleem KS, Leopold DA, Pierpaoli C. Anatomical accuracy of brain connections derived from diffusion MRI tractography is inherently limited. Proceedings of the National Academy of Sciences. 2014;111(46):16574–16579. doi: 10.1073/pnas.1405672111. [DOI] [PMC free article] [PubMed] [Google Scholar]
- Vollmar C, O’Muircheartaigh J, Barker GJ, Symms MR, Thompson P, Kumari V, Koepp MJ. Identical, but not the same: Intra-site and inter-site reproducibility of fractional anisotropy measures on two 3.0T scanners. NeuroImage. 2010;51(4):1384–1394. doi: 10.1016/j.neuroimage.2010.03.046. [DOI] [PMC free article] [PubMed] [Google Scholar]
- Wang Y, Fernández-Miranda JC, Verstynen T, Pathak S, Schneider W, Yeh FC. Rethinking the role of the middle longitudinal fascicle in language and auditory pathways. Cerebral Cortex. 2013;23(10):2347–2356. doi: 10.1093/cercor/bhs225. [DOI] [PubMed] [Google Scholar]
- Wang Y, Wang Q, Haldar JP, Yeh FC, Xie M, Sun P, Song SK. Quantification of increased cellularity during inflammatory demyelination. Brain. 2011;134:3587–3598. doi: 10.1093/brain/awr307. [DOI] [PMC free article] [PubMed] [Google Scholar]
- Wang X, Cusick MF, Wang Y, Sun P, Libbey JE, Trinkaus K, Song SK. Diffusion basis spectrum imaging detects and distinguishes coexisting subclinical inflammation, demyelination and axonal injury in experimental autoimmune encephalomyelitis mice. NMR in Biomedicine. 2014;27(7):843–852. doi: 10.1002/nbm.3129. [DOI] [PMC free article] [PubMed] [Google Scholar]
- Wiegell MR, Tuch DS, Larsson HB, Wedeen VJ. Automatic segmentation of thalamic nuclei from diffusion tensor magnetic resonance imaging. Neuroimage. 2003;19(2 Pt 1):391–401. doi: 10.1016/S1053-8119(03)00044-2. [DOI] [PubMed] [Google Scholar]
- Wilson SaK. An experimental research into the anatomy and physiology of the corpus striatum. Brain. 1914;36:427–492. [Google Scholar]
- Whone AL, Moore RY, Piccini PP, Brooks DJ. Plasticity of the nigropallidal pathway in Parkinson’s disease. Annals of Neurology. 2003;53(2):206–213. doi: 10.1002/ana.10427. [DOI] [PubMed] [Google Scholar]
- Yeh FC, Tseng WYI. NTU-90: A high angular resolution brain atlas constructed by q-space diffeomorphic reconstruction. NeuroImage. 2011;58(1):91–99. doi: 10.1016/j.neuroimage.2011.06.021. [DOI] [PubMed] [Google Scholar]
- Yeh FC, Wedeen VJ, Tseng WYI. Generalized q-sampling imaging. IEEE Transactions on Medical Imaging. 2010;29(9):1626–1635. doi: 10.1109/TMI.2010.2045126. [DOI] [PubMed] [Google Scholar]


