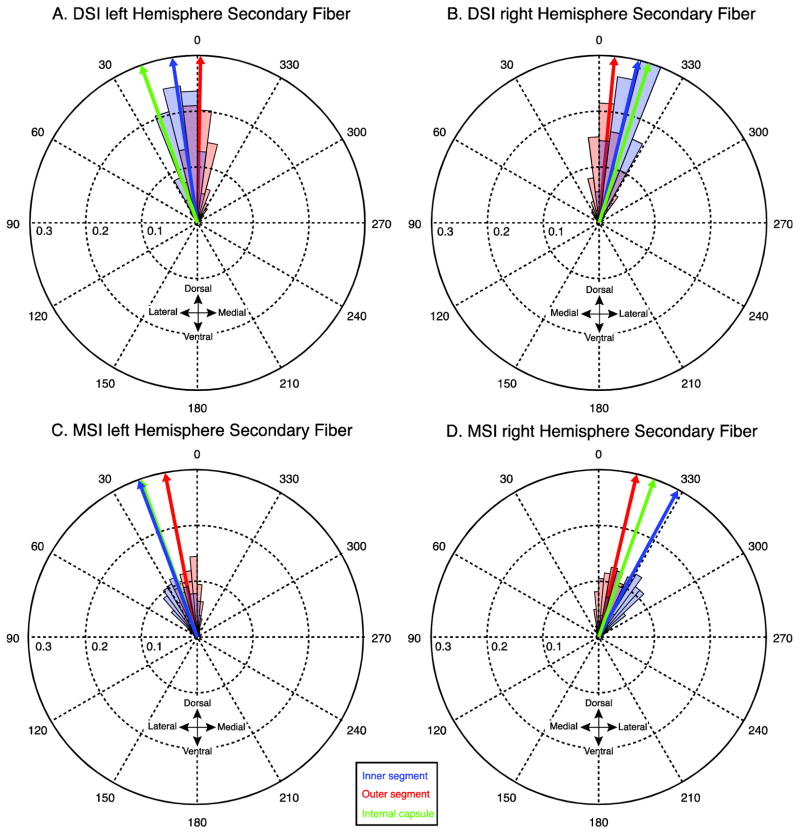
Fig. 4.
Angular distributions of mean secondary fibers from the DSI (A,B) and MSI (C,D) datasets. The orientation of the secondary fibers in each voxel are averaged across subjects and binned (red and blue shaded regions). The size of the shaded regions (bins) correspond to the mass of the distribution that is concentrated at that orientation for the inner segment (blue) and outer segment (red). Blue, red, and green arrows indicate the circular mean of the distributions in the inner, outer and internal capsule respectively.

