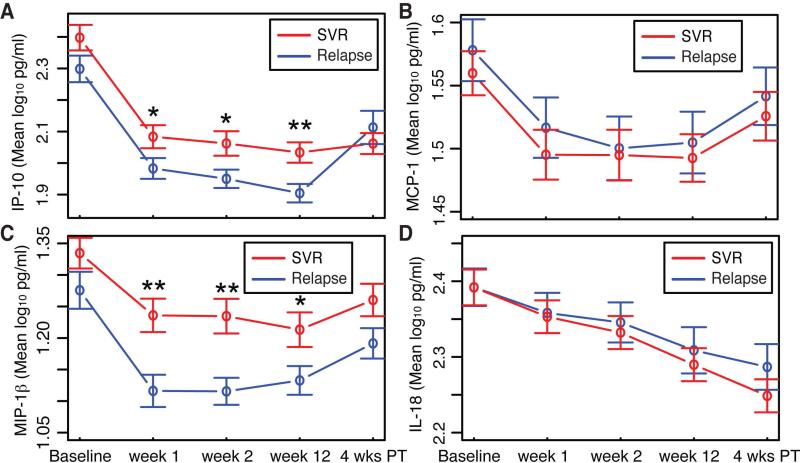
Figure 2.
Temporal dynamics of cytokines and chemokines during HCV infection and treatment. (A) Mean IP-10 (B) MCP-1 (C) MIP-1β (D) IL-18 levels (pg/ml) at baseline, weeks 1, 2, and 12 on SOF and RBV, and 4 weeks post-treatment by treatment outcome. t test p-value <0.01 **, <0.05 *. 4 wks PT, 4 weeks post treatment; SVR, sustained virologic response.

