

Abstract
The accumulation of lipofuscin, an autofluorescent aging marker, in the retinal pigment epithelium (RPE) has been implicated in the development of age-related macular degeneration (AMD). Lipofuscin contains several visual cycle by products, most notably the bisretinoid N-retinylidene-N-retinylethanolamine (A2E). Previous studies with human donor eyes have shown a significant mismatch between lipofuscin autofluorescence (AF) and A2E distributions. The goal of the current project was to examine this relationship in a primate model with a retinal anatomy similar to that of humans. Ophthalmologically naive young (<10 yrs., N=3) and old (>10 yrs., N=4) Macaca fascicularis (macaque) eyes, were enucleated, dissected to yield RPE/choroid tissue, and flat-mounted on indium-tin-oxide-coated conductive slides. To compare the spatial distributions of lipofuscin and A2E, fluorescence and mass spectrometric imaging were carried out sequentially on the same samples. The distribution of lipofuscin fluorescence in the primate RPE reflected previously obtained human results, having the highest intensities in a perifoveal ring. Contrarily, A2E levels were consistently highest in the periphery, confirming a lack of correlation between the distributions of lipofuscin and A2E previously described in human donor eyes. We conclude that the mismatch between lipofuscin AF and A2E distributions is related to anatomical features specific to primates, such as the macula, and that this primate model has the potential to fill an important gap in current AMD research.
INTRODUCTION
Lipofuscin is the yellow autofluorescent lysosomal waste that accumulates within post-mitotic cells throughout several organ systems in the human body1, 2. In the eye, lipofuscin is found most notably in the RPE3. Ocular lipofuscin is a normal aging marker and is readily observed clinically by virtue of fundus AF, which may be detected as early as infancy4, 5. Lipofuscin AF continues to increase until approximately 70-75 years, with the greatest accumulations observed in a perifoveal ring and a slight dip in the fovea1, 4, 5. The age-related accumulation of lipofuscin has been suggested to be related to several pathologies in different organs6-8, including the RPE9, 10. Abnormally high amounts of RPE lipofuscin have been linked to several visual diseases, most notably Stargardt disease, a form of juvenile macular degeneration11, 12, although little is currently known about the mechanism by which this or other pathologies arise9, 10, 13.
The AF of lipofuscin allows to easily map and track its changing distribution within the RPE through age and disease4, 5. However, due to its highly lipophilic nature, analyzing the composition of lipofuscin has proven to be difficult. The understanding of lipofuscin composition has mostly been limited to extractions of organic fractions, prohibiting the observation of spatial molecular changes. Previous studies by Ng et al.14 have shown that RPE lipofuscin is a complex mixture of lipids and proteins, but less than 2% by weight of the analyzed extract is amino acid based. Specific molecular compositions are still not well understood, and whole tissue distributions are even less so.
Although the molecular content of lipofuscin is largely unknown, over 20 bisretinoid constituents have been identified in the RPE15. A2E, a byproduct of the visual cycle, was the first bisretinoid to be isolated from human eyes16 and is certainly the best studied [see ref. 13 for a review]. The formation of A2E, begins with two 11-cis or all-trans retinal molecules binding to phosphatidylethanolamine within the photoreceptor outer segments, forming the precursor A2-PE17-19. The photoreceptor outer segments are then taken up via phagocytosis by the adjacent RPE cells and degraded within the RPE lysosomes, resulting in the accumulation of A2E19, 20. Classical thinking based on chloroform/methanol extractions indicated that A2E was a major component of lipofuscin, although studies from several laboratories have suggested that human lipofuscin is different in this regard21-23. A2E has been found to be toxic in a number of in vitro studies (see ref 13 for a review) but reports disagreed as to whether its presence in vivo should be regarded as protective or pathological, as its retinaldehyde precursors exhibit significantly higher toxicity compared to A2E24, 25.
Through the utilization of our multimodal imaging techniques, it has recently become possible to compare the spatial distribution of lipofuscin with distributions of numerous small molecules in the same tissue. This multimodal imaging determines lipofuscin distribution from the topography of fluorescence and generates the images of molecules via the spatial distributions of their molecular weights utilizing matrix-assisted laser desorption/Ionization imaging mass spectrometry (MALDI-IMS)26-29. These studies uncovered that the distribution patterns of lipofuscin and A2E vary with the species: in the murine RPE they exhibited a marked correlation, whereas they exhibited a significant mismatch within the human tissue27, 30. A key difference here may be retinal organization, because mice lack a macula and have different rod and cone photoreceptor distributions. Therefore, we were interested in species, such as macaques, which have a retinal anatomy similar to humans31-34. Additional advantages to using primate eyes are the ability of thorough longitudinal diagnostic documentation during the lifetime and the controlled process of tissue acquisition (light, temperature, enucleation, etc.).
Here we provide evidence that, as has previously been shown utilizing similar methods in humans, the distributions of A2E and lipofuscin fluorescence exhibit significant spatial mismatch in the macaque RPE. Thus, in terms of the relationship of lipofuscin and A2E, humans resemble primate rather than murine species. These observations make primate species an essential model for future studies regarding the development and progression of degenerative macular pathologies.
RESULTS
Figure 1 represents fluorescence images of young (Fig. 1a; left eye; age: 7 years) and old (Fig. 1b; right eye; age: 18 years) macaque RPE acquired with identical illumination and exposure settings (λexc = 430-480 nm; λem > 490 nm). There is an apparent increase in lipofuscin fluorescence with age, a slight shift in color can be observed across the RPE with age, and AF intensity exhibits a specific gradient. In all samples examined, AF was highest in the central region of the RPE, peaking in a perifoveal ring, decreased in mid-periphery, and was lowest in far-peripheral tissue. The macroscopic gradient observed in the whole eyecup images of Figures 1a and 1b was also recognized in the fluorescence micrographs (Figs. 1c-1e) taken at identical excitation, light intensity, and exposure time (λexc = 450-490 nm; λem > 510 nm). These images were obtained from an 18 year old macaque RPE at the locations indicated in the inset to Figure 1f. Again, lipofuscin AF is most intense in the micrograph taken in the central region (Fig. 1c), tapering off to nearly undetectable levels in the far-periphery (Fig. 1e). Figure 1f provides quantitative intensity gradient data for the young and old cohorts compared in the three above regions (center, mid-periphery, and far-periphery). Spectral analyses in representative young (Fig. 1g) and old (Fig. 1h) animals provide evidence of emission maxima at approximately 600 nm in the center. In comparison, the spectra from the mid-peripheral regions are blue-shifted (575 nm), and the far-periphery exhibits an additional shift toward blue (550 nm).
Figure 1. Color AF images and associated spectra of macaque RPE.

AF images of whole RPE eyecups from a 7 year-old (a) and an 18 year-old (b) macaque (λexc = 430-480 nm; λem > 490 nm). Bright green autofluorescent spots are dissection artifacts. Microscopic imaging (10x len, λexc = 450-490 nm; λem > 510 nm) of an 18 year-old RPE and lipofuscin in the center (c), mid-periphery (d), and far-periphery (e). Approximate regions are indicated in the schematics of the whole RPE (f). Comparison of overall average (± SD) fluorescence intensities from old (n=4) and young (n=3) RPE samples from central, mid-peripheral, and far-peripheral regions across the RPE (f). Spectra from 7 year-old (g) and 18 year-old (h) whole RPE tissues indicating changes in the spectral composition of lipofuscin at the regions across the eyecup denoted in the insets. The location of the optic nerve head is denoted by an asterisk on each sample. Scale Bars: a, b = 5 mm; c, d, e = 60 μm.
Figure 2 provides evidence that MALDI images of A2E (Fig. 2a) and oxidized A2E (Fig. 2b) display an inverse distribution: both species were more abundant in the periphery. It is especially striking when compared to the AF image using the same false color intensity scale (Fig. 2c), which shows that the highest AF is in a central perifoveal ring. In order to further highlight this spatial mismatch, an overlay of the A2E and AF images was generated (Fig. 2d), indicating that there was an almost complete spatial segregation of the strongest AF and A2E signals (red and green areas) and only very limited overlap (yellow) was found.
Figure 2. Lipofuscin AF and MALDI images of A2E.

a) The distribution of A2E across the RPE in a 7 year-old macaque. b) MALDI image of singly oxidized A2E (m/z 608) across the macaque RPE in the same tissue. c) Lipofuscin AF image collected utilizing an IVIS 200 bioluminescence imaging system (λexc = 450 – 490 nm, λem = 575 – 650 nm) shown on the indicated false color scale. d) Overlay of lipofuscin AF (green) and the molecular image of A2E (red) in the same tissue. All Scale bars = 5 mm. The optic nerve head is denoted by an asterisk.
Mass spectral analysis (Fig. 3) confirmed the presence of A2E (m/z 592) and oxidized A2E (m/z 608) in the tissue as evidenced by the average mass spectrum shown in Figure 3a. In addition to identifying A2E and oxidized A2E, MALDI-IMS is also useful for identifying potentially relevant additional compounds. Table 1 represents the most abundant recurrent molecules and in how many samples (from a total of 7) we identified the particular molecular peak. The chemical identities of these peaks are, however, unknown at this time and the identification of these abundant molecular species will require further analysis.
Figure 3. Mass spectral data in macaque RPE.

a) Average mass spectrum (MALDI profile) of the 7 year-old macaque across the entire RPE eyecup in the m/z 550-1000 range. The peaks for A2E and single oxidized A2E (A2E+ox.) are indicated. All peaks were normalized to the A2E peak. Mass spectra from central (b) and peripheral (c) regions indicated on the tissue outline in the m/z range of 550-1000. Spectra are shown on the same scale.
TABLE 1.
Abundant molecular peaks in the macaque RPE.
| m/z | n |
|---|---|
| 527 | 6 |
| 543 | 6 |
| 550 | 6 |
| 573 | 6 |
| 583 | 6 |
| 566 | 5 |
| 758 | 5 |
| 775 | 5 |
| 1032 | 4 |
A total of 7 data sets were included in the analysis. Molecular weight (m/z) and the number of datasets the molecule was prominent (n) are shown.
As expected from the image of A2E (Fig. 2a) mass spectra from areas in the periphery (Fig. 3b) and the center (Fig. 3c) exhibited significant differences in terms of the levels of A2E. In these macaque tissues, we found an approximately 5 fold relative increase in A2E in the periphery (50 au) compared to the center (10 au). In contrast, the relative ratios of oxidized A2E to A2E did not appear to change, either topographically (within the same eyes) or with age (between samples). This ratio was approximately 0.3 across the board (Fig. 4).
Figure 4. The ratio of oxidized A2E to A2E.

The values represent data from average mass spectra of young (< 10 years, n=3) and mature (> 10 years, n=4) macaque tissues.
In order to confirm that the obtained mass peak is indeed A2E, FT-MS was employed. While FT-MS provides limited advantages regarding spatial resolution, its sensitivity and mass resolution are significantly higher, thus the technology allows for an extended period of high resolution fragmentation analysis. While on tissue fragmentation is challenging in itself, even more so on tissue which has been previously been analyzed by MALDI-IMS. A2E standards have previously been shown to fragment into unique ions via mass spectrometric methods (Fig. 5), and we were able to obtain two of the 8 ions through our fragmentation re-analysis: m/z=468 and 392. The m/z 468 fragment corresponds to nearly the entire A2E molecule, after loss of the terminal 1,3,3-trimethylcyclohexene, consistent with it being a fragment unique to an A2E precursor. The presence of the m/z 392 fragment ion also agreed with the precursor ion being from A2E. The lack of other fragmentation ions is likely attributed to several factors, including on-tissue isolation, repeated analysis, and MS/MS fragmentation characteristics of the FT-MS instrument, which often yield only the most stable fragmentation ions in a background of native tissue analysis.
Figure 5. The fragmentation of the A2E molecule.
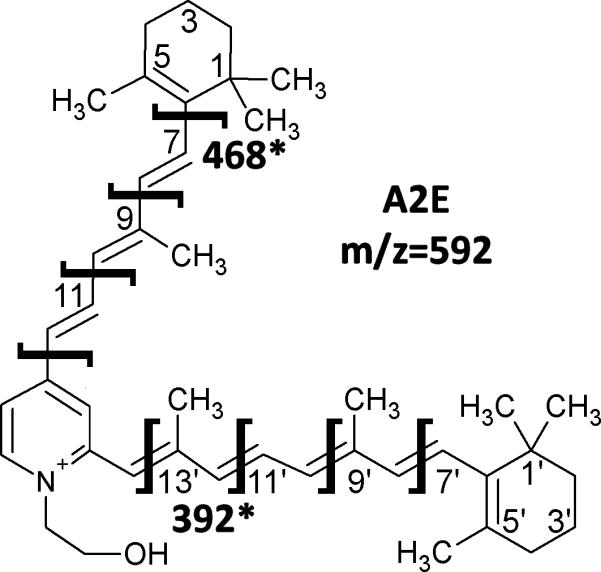
Structure of A2E with expected sites of fragmentation. The sites of the fragments recovered in the tissue analysis are highlighted with masses listed.
DISCUSSION
Age-related macular degeneration is currently the most important cause of vision loss in the elderly population of industrialized countries35. One of the crucial in vivo diagnostic signals in the eye, potentially linked to pathology, is the age-related accumulation of lipofuscin AF. However, in order to assess its role in the disease, the molecules responsible for this fluorescence need to be identified. Clinical imaging methodologies utilized today lack the molecular specificity to achieve this task and previous ex vivo analyses have provided conflicting results. A2E, identified as a major component of the chloroform extract of lipofuscin, has an AF broadly similar to that of lipofuscin and is toxic in cell cultures30, 36. Molecularly specific spatial investigations in various transgenic models of mice have supported this idea. However, similar studies in humans have identified that the concentration of A2E is highest at the ora serrata, in the far-periphery of the human eye, questioning the idea that A2E is responsible for the bulk of lipofuscin AF or diseases broadly associated with that fluorescence.
A greater understanding of the role of lipofuscin and A2E is imperative for understanding complex ocular pathologies such as Stargardt disease and AMD. Thus, the relationship between A2E, lipofuscin, and retinal disease must be reexamined in models, which more closely resemble the organization of the human eye. One convenient model system is the primate, macaque, which have a macula just like humans. Although macaque eyes are significantly smaller compared to those of humans, additional similarities include a high degree of similarity in number and topographical distributions of photoreceptor subtypes31-34.
The multimodal imaging approach utilized in our studies collects whole tissue AF, the dominant signal of which originates from lipofuscin with screening from melanin and some smaller contributions by Bruch's membrane3, 37, 38. Our fluorescence studies provided evidence that the spectral properties and spatial patterns of lipofuscin AF in the macaque closely follow that of the human tissues. Similar to humans, the fluorescence spectrum in the macaque RPE was also dominated by a peak with a maximum and shape similar to that of A2E standards. Fluorescence intensity was highest in a perifoveal ring, tapering off toward the periphery, a classic finding in the human RPE4. Moreover, comparison of old and young samples showed that overall AF intensity increased with age, again, consistent with results seen in the human RPE. These data are not entirely surprising due to the high degree of similarity between the organizations of the macaque and human retinas, however, they agree with the notion that RPE lipofuscin AF is a normal aging marker across species.
MALDI-IMS is a useful technique in the spatial localization of individual molecules but it becomes particularly advantageous when combined with other imaging modalities. The experiments in the macaques uncovered that, as established in the human, A2E was present in higher quantities in the periphery23 when compared to the central RPE. In lack of direct quantitative A2E measurements, these data do not show, however, that A2E is solely present in the periphery and near absent from portions of the center, rather that there is a 5-10 fold accumulation of A2E in the periphery compared to the center. Following the pattern of A2E distribution, the detected oxidized states of A2E also exhibited a preferential peripheral distribution, although in lower quantities. Moreover, the relative ratios of the two species did not fluctuate appreciably across samples in terms of topography or age. These data reinforce what was found in rodents29, that oxidized A2E is directly linked to the amount of A2E present.
Therefore, as has been previously demonstrated in humans, A2E in the macaque RPE does not correlate with lipofuscin AF. These experiments validate the human studies in an independent and practically preferential model system. The main advantages to using macaques are the ability of longitudinal diagnostic documentation and the controlled process of tissue acquisition. In consequence, these data justify the reconsideration of the relationship between A2E and lipofuscin formulated over the past several decades. The spatial analysis provides consistent evidence across species that A2E itself and its oxidized species are likely not the dominant fluorophore within RPE lipofuscin. However, further investigation is required to quantitate absolute A2E levels across the tissues; moreover, the essential biochemical pathways involved need to be identified. From these data alone, it is not possible to determine whether it is a matter of topographically-controlled higher clearance, less accumulation, or an entirely separate biochemical process that is responsible for the respective gradients in lipofuscin and A2E accumulations. One possibility could be the light-mediated breakdown of the A2E molecule being more prevalent in the center versus the periphery. The variable presence of rod photopigment across the retina may also account for the topographical changes in A2E concentration39, 40. Another possibility, as proposed by Bhosale et al, is the attenuation of A2E formation in the RPE by the presence of ocular anti-oxidant carotenoids (lutein and zeaxanthin), which show an inverse distributional correlation to that of A2E23. An additional key issue is if lipofuscin, or a specific component of it, is associated with disease.
MALDI-IMS has the ability to answer fundamental questions surrounding retinal degenerative disorders, as molecularly-specific topographical information is collected on numerous compounds at the same time. However, a crucial aspect is having an appropriate model of the human RPE. The high degree of homology between human and macaque retinas in key anatomical and biochemical features affords an indispensable cross-species comparability. The work of Hunter et al. on light damage in the macaque is one example emphasizing such utility41. The establishment of the macaque model is also essential due to limited longitudinal follow-up in humans. One essential new approach may be careful longitudinal studies of lipofuscin fluorescence-associated molecular changes throughout the life span, which is expected to allow for greater insight into underlying causes of diseases as well as identifying potential biomarkers.
In light of our results on A2E and lipofuscin distributions, the macaque model is clearly preferential to rodents for understanding human pathology. While several important animal models exist, most notably the Abca4 knockout mouse model of Stargardt's 42, these models only partially mimic human disease: Abca4 mice do not exhibit an impairment of visual function similar to humans37. More importantly, a model of AMD has never successfully been established, likely due to the multifaceted nature of the disease, leaving a void in this important field of vision research. These results indicate that even though transgenic mice are invaluable as genetic models, they are too far removed from human anatomy and physiology. However, as the accessibility of the primate model is more limited, species exhibiting a marked and unique retinal topography, such as the ground squirrel with their area centralis, could provide unique information on the molecular origins of A2E/lipofuscin signals. These rodent models could provide useful information regarding A2E, while being relatively higher throughput as compared to primates, providing a more multidimensional approach to the study of macular degeneration.
EXPERIMENTAL
Tissue preparation
Tissues from ocularly naïve primates were analyzed less than 24 hours post mortem. After shipment in ringer's solution on ice, the tissues were placed on fresh ice for the remainder of the dissection procedures, which followed the one previously published for human tissue28. In short, the cornea was first removed, then the sclera was carefully detached to yield the bulbus intact with the choroid, Bruch's membrane, RPE, and retina. Using flattening cuts, the tissues were mounted on indium-tin-oxide-coated conductive slides (Bruker Daltonics, Billerica, MA) with the retina on top. Then the retina was carefully lifted from the RPE and the remaining tissues dried at room temperature under dim red light. All animal procedures were designed and performed in accordance with the Office of Laboratory Animal Welfare guidelines and were approved by the Medical University of South Carolina Animal Care and Use Committee.
Fluorescence imaging
Immediately after drying, fluorescence spectra and color images were collected using a Maestro 2 imager (Perkin Elmer, Waltham, MA), using the blue filter set (λexc = 430-480 nm; λem > 490 nm) and an exposure time of 5.00 seconds. Similar to previous procedures28, fluorescence intensity was also quantitated in an IVIS 200 imager (Perkin Elmer) utilizing the GFP filter (λexc = 445-490 nm) for excitation and the DsRed filter (λem = 575-650nm) for emission with the exposure time set to 2s. Color fluorescence micrographs were captured with a Nikon D5100 camera (Nikon Inc., Melville, NY) set to 500 ms exposure time on a Zeiss Axioplan 2 microscope (Carl Zeiss, Thornwood, NY) using a 10x objective lens (λexc = 450-490 nm; λem > 510 nm).
Mass spectrometry
Following fluorescence measurements, the samples were coated with 40 mL of sinapinic acid (Sigma-Aldrich Corp.) matrix in 70:30 ethanol/water using a hand thin layer chromatography sprayer (Kimble-Kontes, Vineland, NJ) and stored under vacuum in the dark for further analysis.
Mass spectra and images were collected using an AutoFlex II TOF/TOF instrument (Bruker) with an acquisition range of m/z = 500 – 1400, a raster width of 350 μm, a laser diameter of 25 μm, operating at 200 Hz, and gating suppression set to m/z 490.
Tandem mass spectra of A2E were acquired on a Solarix 7T FT-ICR mass spectrometer (Bruker) equipped with a MALDI source. The instrument collected 400 microsamples per spot operating at 1000 Hz and with a laser diameter of 25 μm.
Data analysis
Fluorescence spectral data were analyzed by selecting similar size regions of interest (ROI) as well as a background that did not contain any tissue. In Microsoft Excel (Microsoft Corp., Redmond, WA), background interference was subtracted from the ROIs. The spectra were corrected for artifacts introduced by filter changes within the imager using normalization factors established through comparison the spectrum for A2E to A2E spectra imaged using a confocal microscope (Leica Corp., Wetzlar, Germany). Total fluorescence intensity for each ROI was calculated the area under the spectral curve. To better compare spectral shapes, the ROI spectra were normalized to the most intense peak.
For studies of age-related effects, tissues were classified into young (< 10 years; n=3) and old (> 10 years; n=4) groups. Fluorescence characteristic to these groups was calculated by averaging the total fluorescence values for the ROIs from each sample in the age group.
Greyscale images of A2E and oxidized A2E distributions were visualized after normalization to total ion current in FlexImaging 3.0 (Bruker) and saved into image formats accessible with ImageJ (NIH, Bethesda, MD) for further analysis. To create the heat-map topographies, the images were translated to the intensity scale coded by the look-up-tables indicated in the images and then they were smoothed using a 7 point blur filter. Mass spectra were generated in Microsoft Excel from exported data. MS/MS spectra were generated using FlexImaging 4.1 (Bruker) with a data reduction of 1 and normalization by root mean squares.
CONCLUSIONS
The results obtained in this study mirror those collected previously with similar methods in human RPE tissues. Thus, the macaque has proven to be an ideal and potentially very useful model organism in the continued study of macular disease. In order to further our knowledge of this multifaceted disease, it will be important to maintain both high throughput non-primate models (for ease of therapeutic intervention), as well as a primate model which very closely reflects uniquely human characteristics (to establish fundamentals). Our data show that the anatomical similarities between this macaque model and humans have resulted in similarities in the accumulations and spatial distributions of specific molecules, indicating an important biochemical link, which is apparently missing to mice. Thus, this primate model has the potential to answer several important questions surrounding AMD and other retinal degenerative disorders.
ACKNOWLEDGEMENTS
This research was supported in part by a grant from Allergan, Inc., Irvine, CA; by NIH grants EY19065 (ZA), EY014850 (YK); an unrestricted grant to MUSC, Department of Ophthalmology, from Research to Prevent Blindness, New York, NY, and the state of South Carolina Smart State Endowed Research program to R.R.D. RKC is an RPB Senior Scientific Investigator. The work has in part been conducted in the MUSC Mass Spectrometry Institutional Research Resource Facility and in the Cell & Molecular Imaging Shared Resource of the Hollings Cancer Center, which was supported by Cancer Center Support Grant P30 CA138313 to the Hollings Cancer Center, MUSC.
Footnotes
Part of the data in this paper were presented during the 16th International Congress on Photobiology held in Cordoba, Argentina, in September (8th - 12th), 2014.
REFERENCES
- 1.Porta EA. Pigments in aging: an overview. Annals of the New York Academy of Sciences. 2002;959:57–65. doi: 10.1111/j.1749-6632.2002.tb02083.x. [DOI] [PubMed] [Google Scholar]
- 2.Nakano M, Oenzil F, Mizuno T, Gotoh S. Age-related changes in the lipofuscin accumulation of brain and heart. Gerontology. 1995;41(Suppl 2):69–79. doi: 10.1159/000213726. [DOI] [PubMed] [Google Scholar]
- 3.Feeney L. Lipofuscin and melanin of human retinal pigment epithelium. Fluorescence, enzyme cytochemical, and ultrastructural studies. Investigative ophthalmology & visual science. 1978;17:583–600. [PubMed] [Google Scholar]
- 4.Wing GL, Blanchard GC, Weiter JJ. The topography and age relationship of lipofuscin concentration in the retinal pigment epithelium. Investigative ophthalmology & visual science. 1978;17:601–607. [PubMed] [Google Scholar]
- 5.Delori FC, Dorey CK, Staurenghi G, Arend O, Goger DG, Weiter JJ. In vivo fluorescence of the ocular fundus exhibits retinal pigment epithelium lipofuscin characteristics. Investigative ophthalmology & visual science. 1995;36:718–729. [PubMed] [Google Scholar]
- 6.Ulfig N. Altered lipofuscin pigmentation in the basal nucleus (Meynert) in Parkinson's disease. Neuroscience research. 1989;6:456–462. doi: 10.1016/0168-0102(89)90007-2. [DOI] [PubMed] [Google Scholar]
- 7.Nakanishi H, Amano T, Sastradipura DF, Yoshimine Y, Tsukuba T, Tanabe K, Hirotsu I, Ohono T, Yamamoto K. Increased expression of cathepsins E and D in neurons of the aged rat brain and their colocalization with lipofuscin and carboxy-terminal fragments of Alzheimer amyloid precursor protein. Journal of neurochemistry. 1997;68:739–749. doi: 10.1046/j.1471-4159.1997.68020739.x. [DOI] [PubMed] [Google Scholar]
- 8.Bajaj NP, Al-Sarraj ST, Anderson V, Kibble M, Leigh N, Miller CC. Cyclin-dependent kinase-5 is associated with lipofuscin in motor neurones in amyotrophic lateral sclerosis. Neuroscience letters. 1998;245:45–48. doi: 10.1016/s0304-3940(98)00176-1. [DOI] [PubMed] [Google Scholar]
- 9.Winkler BS, Boulton ME, Gottsch JD, Sternberg P. Oxidative damage and age-related macular degeneration. Molecular vision. 1999;5:32. [PMC free article] [PubMed] [Google Scholar]
- 10.Sparrow JR, Boulton M. RPE lipofuscin and its role in retinal pathobiology. Experimental eye research. 2005;80:595–606. doi: 10.1016/j.exer.2005.01.007. [DOI] [PubMed] [Google Scholar]
- 11.Burke TR, Duncker T, Woods RL, Greenberg JP, Zernant J, Tsang SH, Smith RT, Allikmets R, Sparrow JR, Delori FC. Quantitative fundus autofluorescence in recessive Stargardt disease. Investigative ophthalmology & visual science. 2014;55:2841–2852. doi: 10.1167/iovs.13-13624. [DOI] [PMC free article] [PubMed] [Google Scholar]
- 12.Delori FC, Staurenghi G, Arend O, Dorey CK, Goger DG, Weiter JJ. In vivo measurement of lipofuscin in Stargardt's disease--Fundus flavimaculatus. Investigative ophthalmology & visual science. 1995;36:2327–2331. [PubMed] [Google Scholar]
- 13.Eldred GE, Lasky MR. Retinal age pigments generated by self-assembling lysosomotropic detergents. Nature. 1993;361:724–726. doi: 10.1038/361724a0. [DOI] [PubMed] [Google Scholar]
- 14.Ng KP, Gugiu B, Renganathan K, Davies MW, Gu X, Crabb JS, Kim SR, Rozanowska MB, Bonilha VL, Rayborn ME, Salomon RG, Sparrow JR, Boulton ME, Hollyfield JG, Crabb JW. Retinal pigment epithelium lipofuscin proteomics. Molecular & cellular proteomics : MCP. 2008;7:1397–1405. doi: 10.1074/mcp.M700525-MCP200. [DOI] [PMC free article] [PubMed] [Google Scholar]
- 15.Sparrow JR, Gregory-Roberts E, Yamamoto K, Blonska A, Ghosh SK, Ueda K, Zhou J. The bisretinoids of retinal pigment epithelium. Progress in retinal and eye research. 2012;31:121–135. doi: 10.1016/j.preteyeres.2011.12.001. [DOI] [PMC free article] [PubMed] [Google Scholar]
- 16.Sakai N, Decatur J, Nakanishi K, Eldred G. Ocular Age Pigment “A2-E”: An Unprecedented Pyridinium Bisretinoid. J Am Chem Soc. 1996;118:1559–1560. [Google Scholar]
- 17.Parish CA, Hashimoto M, Nakanishi K, Dillon J, Sparrow J. Isolation and one-step preparation of A2E and iso-A2E, fluorophores from human retinal pigment epithelium. Proceedings of the National Academy of Sciences of the United States of America. 1998;95:14609–14613. doi: 10.1073/pnas.95.25.14609. [DOI] [PMC free article] [PubMed] [Google Scholar]
- 18.Quazi F, Molday RS. ATP-binding cassette transporter ABCA4 and chemical isomerization protect photoreceptor cells from the toxic accumulation of excess 11-cis-retinal. Proceedings of the National Academy of Sciences of the United States of America. 2014;111:5024–5029. doi: 10.1073/pnas.1400780111. [DOI] [PMC free article] [PubMed] [Google Scholar]
- 19.Boyer NP, Higbee D, Currin MB, Blakeley LR, Chen C, Ablonczy Z, Crouch RK, Koutalos Y. Lipofuscin and N-retinylidene-N-retinylethanolamine (A2E) accumulate in retinal pigment epithelium in absence of light exposure: their origin is 11-cis-retinal. The Journal of biological chemistry. 2012;287:22276–22286. doi: 10.1074/jbc.M111.329235. [DOI] [PMC free article] [PubMed] [Google Scholar]
- 20.Liu J, Itagaki Y, Ben-Shabat S, Nakanishi K, Sparrow JR. The biosynthesis of A2E, a fluorophore of aging retina, involves the formation of the precursor, A2-PE, in the photoreceptor outer segment membrane. The Journal of biological chemistry. 2000;275:29354–29360. doi: 10.1074/jbc.M910191199. [DOI] [PubMed] [Google Scholar]
- 21.Haralampus-Grynaviski NM, Lamb LE, Clancy CM, Skumatz C, Burke JM, Sarna T, Simon JD. Spectroscopic and morphological studies of human retinal lipofuscin granules. Proceedings of the National Academy of Sciences of the United States of America. 2003;100:3179–3184. doi: 10.1073/pnas.0630280100. [DOI] [PMC free article] [PubMed] [Google Scholar]
- 22.Feldman TB, Yakovleva MA, Arbukhanova PM, Borzenok SA, Kononikhin AS, Popov IA, Nikolaev EN, Ostrovsky MA. Changes in spectral properties and composition of lipofuscin fluorophores from human-retinal-pigment epithelium with age and pathology. Analytical and bioanalytical chemistry. 2015;407:1075–1088. doi: 10.1007/s00216-014-8353-z. [DOI] [PubMed] [Google Scholar]
- 23.Bhosale P, Serban B, Bernstein PS. Retinal carotenoids can attenuate formation of A2E in the retinal pigment epithelium. Archives of biochemistry and biophysics. 2009;483:175–181. doi: 10.1016/j.abb.2008.09.012. [DOI] [PMC free article] [PubMed] [Google Scholar]
- 24.Maeda A, Golczak M, Chen Y, Okano K, Kohno H, Shiose S, Ishikawa K, Harte W, Palczewska G, Maeda T, Palczewski K. Primary amines protect against retinal degeneration in mouse models of retinopathies. Nature chemical biology. 2012;8:170–178. doi: 10.1038/nchembio.759. [DOI] [PMC free article] [PubMed] [Google Scholar]
- 25.Roberts JE, Kukielczak BM, Hu DN, Miller DS, Bilski P, Sik RH, Motten AG, Chignell CF. The role of A2E in prevention or enhancement of light damage in human retinal pigment epithelial cells. Photochemistry and photobiology. 2002;75:184–190. doi: 10.1562/0031-8655(2002)075<0184:troaip>2.0.co;2. [DOI] [PubMed] [Google Scholar]
- 26.Ablonczy Z, Smith N, Anderson DM, Grey AC, Spraggins J, Koutalos Y, Schey KL, Crouch RK. The utilization of fluorescence to identify the components of lipofuscin by imaging mass spectrometry. Proteomics. 2014;14:936–944. doi: 10.1002/pmic.201300406. [DOI] [PMC free article] [PubMed] [Google Scholar]
- 27.Ablonczy Z, Higbee D, Grey AC, Koutalos Y, Schey KL, Crouch RK. Similar molecules spatially correlate with lipofuscin and N-retinylidene-N-retinylethanolamine in the mouse but not in the human retinal pigment epithelium. Archives of biochemistry and biophysics. 2013;539:196–202. doi: 10.1016/j.abb.2013.08.005. [DOI] [PMC free article] [PubMed] [Google Scholar]
- 28.Ablonczy Z, Higbee D, Anderson DM, Dahrouj M, Grey AC, Gutierrez D, Koutalos Y, Schey KL, Hanneken A, Crouch RK. Lack of correlation between the spatial distribution of A2E and lipofuscin fluorescence in the human retinal pigment epithelium. Investigative ophthalmology & visual science. 2013;54:5535–5542. doi: 10.1167/iovs.13-12250. [DOI] [PMC free article] [PubMed] [Google Scholar]
- 29.Ablonczy Z, Gutierrez DB, Grey AC, Schey KL, Crouch RK. Molecule-specific imaging and quantitation of A2E in the RPE. Advances in experimental medicine and biology. 2012;723:75–81. doi: 10.1007/978-1-4614-0631-0_11. [DOI] [PMC free article] [PubMed] [Google Scholar]
- 30.Grey AC, Crouch RK, Koutalos Y, Schey KL, Ablonczy Z. Spatial localization of A2E in the retinal pigment epithelium. Investigative ophthalmology & visual science. 2011;52:3926–3933. doi: 10.1167/iovs.10-7020. [DOI] [PMC free article] [PubMed] [Google Scholar]
- 31.Wikler KC, Rakic P. Distribution of photoreceptor subtypes in the retina of diurnal and nocturnal primates. The Journal of neuroscience : the official journal of the Society for Neuroscience. 1990;10:3390–3401. doi: 10.1523/JNEUROSCI.10-10-03390.1990. [DOI] [PMC free article] [PubMed] [Google Scholar]
- 32.Curcio CA, Sloan KR, Jr., Packer O, Hendrickson AE, Kalina RE. Distribution of cones in human and monkey retina: individual variability and radial asymmetry. Science. 1987;236:579–582. doi: 10.1126/science.3576186. [DOI] [PubMed] [Google Scholar]
- 33.Packer O, Hendrickson AE, Curcio CA. Photoreceptor topography of the retina in the adult pigtail macaque (Macaca nemestrina) The Journal of comparative neurology. 1989;288:165–183. doi: 10.1002/cne.902880113. [DOI] [PubMed] [Google Scholar]
- 34.Wikler KC, Williams RW, Rakic P. Photoreceptor mosaic: number and distribution of rods and cones in the rhesus monkey retina. The Journal of comparative neurology. 1990;297:499–508. doi: 10.1002/cne.902970404. [DOI] [PubMed] [Google Scholar]
- 35.Pascolini D, Mariotti SP, Pokharel GP, Pararajasegaram R, Etya'ale D, Negrel AD, Resnikoff S. 2002 global update of available data on visual impairment: a compilation of population-based prevalence studies. Ophthalmic epidemiology. 2004;11:67–115. doi: 10.1076/opep.11.2.67.28158. [DOI] [PubMed] [Google Scholar]
- 36.Sparrow JR, Parish CA, Hashimoto M, Nakanishi K. A2E, a lipofuscin fluorophore, in human retinal pigmented epithelial cells in culture. Investigative ophthalmology & visual science. 1999;40:2988–2995. [PubMed] [Google Scholar]
- 37.Charbel Issa P, Barnard AR, Singh MS, Carter E, Jiang Z, Radu RA, Schraermeyer U, MacLaren RE. Fundus autofluorescence in the Abca4(−/−) mouse model of Stargardt disease--correlation with accumulation of A2E, retinal function, and histology. Investigative ophthalmology & visual science. 2013;54:5602–5612. doi: 10.1167/iovs.13-11688. [DOI] [PMC free article] [PubMed] [Google Scholar]
- 38.Ach T, Tolstik E, Messinger JD, Zarubina AV, Heintzmann R, Curcio CA. Lipofuscin re-distribution and loss accompanied by cytoskeletal stress in retinal pigment epithelium of eyes with age-related macular degeneration. Investigative ophthalmology & visual science. 2015 doi: 10.1167/iovs.14-16274. [DOI] [PMC free article] [PubMed] [Google Scholar]
- 39.Tornow RP, Stilling R. Variation in sensitivity, absorption and density of the central rod distribution with eccentricity. Acta anatomica. 1998;162:163–168. doi: 10.1159/000046482. [DOI] [PubMed] [Google Scholar]
- 40.Young RW. The renewal of rod and cone outer segments in the rhesus monkey. The Journal of cell biology. 1971;49:303–318. doi: 10.1083/jcb.49.2.303. [DOI] [PMC free article] [PubMed] [Google Scholar]
- 41.Hunter JJ, Morgan JI, Merigan WH, Sliney DH, Sparrow JR, Williams DR. The susceptibility of the retina to photochemical damage from visible light. Progress in retinal and eye research. 2012;31:28–42. doi: 10.1016/j.preteyeres.2011.11.001. [DOI] [PMC free article] [PubMed] [Google Scholar]
- 42.Weng J, Mata NL, Azarian SM, Tzekov RT, Birch DG, Travis GH. Insights into the function of Rim protein in photoreceptors and etiology of Stargardt's disease from the phenotype in abcr knockout mice. Cell. 1999;98:13–23. doi: 10.1016/S0092-8674(00)80602-9. [DOI] [PubMed] [Google Scholar]