Abstract
We present a 3D 1H-detected solid-state NMR (SSNMR) approach for main-chain signal assignments of 10–100 nmol of fully protonated proteins using ultra-fast magic-angle spinning (MAS) at ~80 kHz with a novel spectral-editing method, which permits drastic spectral simplification. The approach offers ~110 fold time saving over a traditional 3D 13C-detected SSNMR approach.
13C high-resolution solid-state NMR (SSNMR) spectroscopy has been a powerful tool to analyze protein structures of amyloid, membrane-bound, or nano-crystalline proteins, for which X-ray crystallography has been traditionally ineffective. However, limited sensitivity and resultant requirements of large sample amount have been a major bottleneck in traditional 13C-detected SSNMR analysis of proteins for spectral assignment and structural analysis. A traditional 13C 2D-3D SSNMR analysis has typically required 0.2–1 μmol of 13C- and 15N-labeled samples for signal assignments. 1H indirect detection was introduced to 13C and 15N high-resolution SSNMR about a decade ago for sensitivity enhancement.1–4 The recent introduction of high-level deuteration and partial back-exchange of amide 1H (10–20%) has greatly improved the 1H resolution in protein SSNMR,5, 6 offering a practical protocol for 1H-detected protein SSNMR. However, the sensitivity in the method has been limited by a gross loss of 1H signals from amide sites (80–90%) due to deuteration. 1H-detected 13C SSNMR for a fully protonated protein at fast MAS (40–60 kHz) has offered signal assignments for proteins.7, 8 However, this method is still hampered by relatively broad 1H line widths (0.3–1 ppm); the resolution is generally insufficient even for small proteins. Recent studies described 1H indirect detection at a spinning frequency of 60 kHz, resulting in resolved amide 1H resonances for fully deuterated proteins with fully back-exchanged amide 1H.9, 10 Although those studies demonstrated higher 1H resolution (0.1 ppm) and the feasibility of main-chain sequential assignments for micro-crystalline samples, these analyses using 3D SSNMR typically require 2–4 mg or 0.1–0.5 μmol of isotope-labeled protein samples, preparation of which can be still prohibitive for many proteins of biological interest. The limited sensitivity is presumably attributed to inefficient polarization transfer from amide 1H to remote 13C nuclei and many polarization transfer steps. Also, assignments from 1H-detected 3D SSNMR is not so straightforward since the limited resolution in 1H dimension typically causes spectral overlapping. Equally importantly, it has been difficult to achieve a net sensitivity gain by 1H-detected (N+1)-dimensional SSNMR over a corresponding N-dimensional 13C direct detected SSNMR without employing deuteration.11 In this work, we present a novel approach for streamlining main-chain assignments of fully protonated proteins by 1H-detected high-field SSNMR under ultra-fast MAS (UFMAS) at 80 kHz. Then, we show that main-chain assignments are feasible from a small set of 3D data with minimal sample requirements (10–100 nmol) by a combination of 1H-detected SSNMR under UFMAS, a high field, paramagnetic doping, and a novel spectral editing. Our approach establishes advantage of 1H indirect detection method over traditional 13C direct detection for concurrent improvement in sensitivity and resolution for fully protonated proteins for the first time. The new approach collectively enhances sensitivity by 30–100 fold over a traditional moderate-field 13C SSNMR approach.
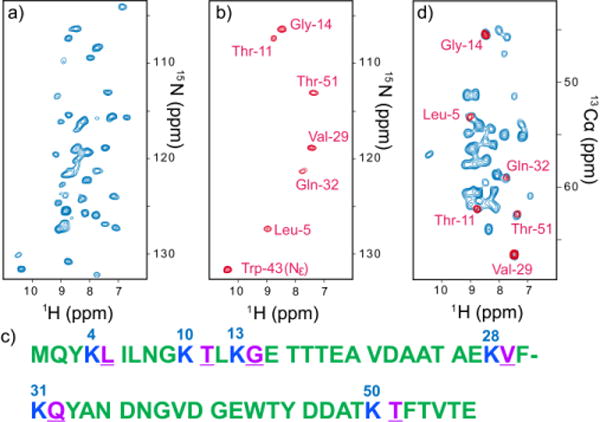
Fig. 1a shows 1H-detected 2D 1H/15N correlation SSNMR spectrum of a micro-crystalline GB1 sample that was uniformly 13C- and 15N-labeled except for lysine residues (Lys-reverse-labeled) under UFMAS at 80 kHz. 15N/1H correlations were observed for all the 15N–1H groups of 56-residues GB1, except for 6 unlabeled lysine residues and 2 residues in the loop region (Ala-23 and Asp-47) (the sequence in Fig. 1c). The line widths of the resolved amide 1H resonances in Fig. 1a are 0.21 ± 0.03 ppm. A corresponding 2D 15N/1H spectrum collected under MAS at 50 kHz (see Fig. S4) showed 1H widths of 0.3–0.4 ppm, which are not sufficient to resolve individual lines even for a small protein. This demonstrates drastic 1H resolution improvements by a factor of 1.5–2 under UFMAS at 80 kHz.
Fig. 1.

(a, b) 2D 1H-detected 15N/1H correlation spectra (a) without and (b) with HIGHLIGHT REDOR for the micro-crystalline sample of Lys-reverse-labeled GB1, along with the sequence shown in (c). (d) 2D 1H-detected CA(N)H correlation spectra (blue) without and (red) with HIGHLIGHT REDOR, for the same sample. The sample was doped with 20 mM Cu-EDTA. The data were collected with recycle delays of 1 s at a spinning speed of 80,000 ± 5 Hz. The dephasing time due to 13CO-15N for HIGHLIGHT REDOR was 4.2 ms. The pulse sequences for the HIGHLIGHT experiments used for (b, d) are shown in Fig. S2 and S3.
With the excellent resolution, our next step is sequential assignments by 1H-detected 3D experiments. Although a few previous studies reported sequential signal assignments of fully protonated proteins by 1H-detected SSNMR,8, 12 main-chain signal assignments by 1H-detected SSNMR have largely relied on spectral resolution in the 1H dimension in 3D correlation spectra such as those obtained in CANH and CA(CO)NH experiments. In such experiments, nearly complete resolution is needed in a 2D 15N/1H chemical-shift correlation spectrum to achieve unambiguous sequential assignments. Due to spectral overlap, however, for many proteins it is not straightforward to establish starting points for sequential assignments with unambiguous assignments over a long protein sequence.
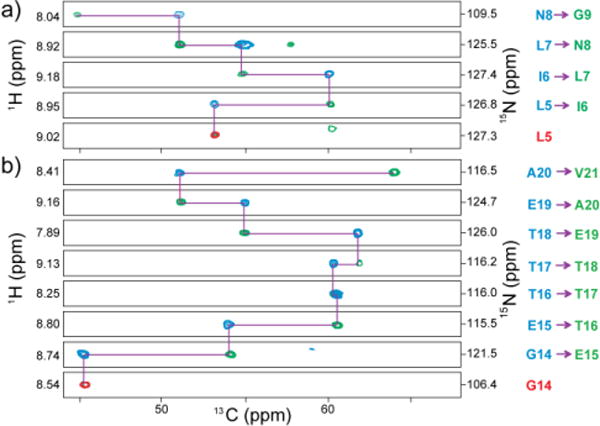
As an effective approach to address the spectral overlap problem in 1H-detected SSNMR and to establish multiple starting points, here we introduce an approach called HIGHLIGHT (HIGH-speed-spinning-optimized Labeled-residue-IGnited Hetero-nuclear Total spectral quenching), which enables selective observation of residues adjacent to unlabeled residues in a reverse-labeled protein. For this purpose, we specifically designed a 13CO–15N frequency-selective REDOR (fsREDOR) scheme,13, 14 which selectively quenches signals of 15N bonded to 13CO under UFMAS by selectively “recoupled” 13CO–15N dipolar coupling (for details, see the Experimental section and Fig. S1). As the residues “highlighted” by this method are often varied in their amino acid types, spectral assignments are more straightforward than in selective amino acid labeling. In Fig. 1 (a, b), we compare 2D 15N/1H correlation spectra for a Lys-reverse-labeled micro-crystalline GB1 sample without (a) or with (b) HIGHLIGHT 13CO–15N REDOR. By contrast, in the highlighted spectrum in (b), signals from six residues (Leu-5, Thr-11, Gly-14, Val-29, Gln-32, and Thr-51; residues in magenta in Fig. 1c) following lysine resides (Lys-4, -10, -13, 28, -31, and -50) can be observed clearly, beside the side-chain signal from 15N–1H from Trp-43, which can be discriminated in the 2D CA(N)H experiment depicted in (d). The spectra in (a) and (b) were obtained only in 10 min and 20 min respectively by 1H detection and additional sensitivity enhancement with paramagnetic-assisted condensed data collection (PACC) method,15 which employs short recycle delays of 0.3–1 s in the following experiments by taking advantage of short 1H T1 values in the presence of a paramagnetic dopant (~20 mM Cu-EDTA). In Fig. 1d, we show an overlay of 1H-detected 2D CA(N)H correlation spectra without (blue) and with (red) selective dephasing due to 13CO–15N dipolar coupling. It is obvious that only the residues following unlabeled lysine emerged in the HIGHLIGHT spectrum. In HIGHLIGHT REDOR, the intensities of the quenched residues were reduced to 0–12%, whereas 43–65% of the signals remained for highlighted residues in which 15N groups were not directly bonded to 13CO. Although a similar spectral-editing approach using “afterglow” spectroscopy has been proposed,16 this method only suppresses signals for non-target residues to ~1/3 of their initial values, leaving substantial background signals. Unlike other experiments designed for a low spinning speed (~13 kHz),14, 16 the HIGHLIGHT approach is effective under UFMAS, which is essential for an improvement in sensitivity by 1H detection. Unlike amino-acid-selective labeling, the HIGHLIGHT approach offers excellent spectral dispersion from diverse amino acid types. Except for the duplicated Thr residues, signals could be assigned to unique residues based on 13Cα shifts even from the 2D data in (d), which was collected in only 22 min. The HIGHLIGHT approach is also highly effective for spectral editing, for example, to reduce the number of resonances to a manageable level (30–70 resonances) for a larger protein over 200 residues. The excellent spectral dispersion from different amino-acid types should be useful for such applications. Based on the excellent results of the novel spectral-editing method, which permits dramatic spectral simplifications, we next discuss how we utilize this approach for main-chain signal assignments in protein SSNMR. Because most of the residues of the sample are isotope-labeled, it is straightforward to collect standard 1H-detected 3D correlation data such as 3D CANH, CA(CO)NH, and CONH for sequential signal assignments. Fig. 2 shows overlaid strip plots for 3D CANH (green) and 3D CA(CO)NH (blue) spectra, along with those for 3D CANH obtained with HIGHLIGHT REDOR (red). The starting points of the sequential assignments for the residues following lysine residues are indicated by the highlighted signals in red (L5, G14 in Fig. 2). Based on these results only from the two data sets, we completed main-chain 1H, 13Cα, 15N signal assignments, except for the lysine residues, a few other residues in the loop region (Ala-23 and Asp-47) and 15N/1H assignment ambiguity for Asn-8 and Ala-20, as summarized in Table S1. We confirmed that (ϕ, ψ) torsion angles predicted by TALOS+ software17 from the obtained 1H, 15N, and 13C shifts showed excellent agreements with those from the crystal structure for most of the residues except for those around the unassigned residues (i.e. Lys; see Table S2 in SI). The average S/N ratios for the 3D CANH, 3D CA(CO)NH, and HIGHLIGHT 3D CANH data in Fig. 2 are as much as 15.9, 18.9, and 8.7, respectively. Thus, nominal 3D experimental times needed to obtain average S/N ratios of ~6 are only 2.5 min, 20.5 min, and 28.5 min for 3D CANH, 3D CA(CO)NH and HIGHLIGHT 3D CANH experiments for ~100 nmol of the GB1 protein sample, respectively. Therefore, our data suggest that with enhanced sensitivity by 1H detection and PACC methods under UFMAS at 80 kHz, SSNMR analyses using 3D CANH and CA(CO)NH with the HIGHLIGHT approach for ~10 nmol (or ~60 μg) of the protein or equivalent fully protonated proteins are feasible within only ~3.4 days in order to achieve main-chain signal assignments and shift-based structural profiling. For complete assignments of the backbone, we successfully obtained 3D CONH data (13CO assignments in Table S1 in SI), which took 2 h. Additionally, we collected a 3D CXCANH spectrum in 11.6 h. The CXCANH offered assignments for 13Cβ resonances and some of the 13Cγ resonances (13Cβ shifts are listed in Table S1).
Fig. 2.

Overlaid 3D strip plots for sequential assignments from (a) Leu-5 through Gly-9 and (b) Gly-14 through Asp-22 for a micro-crystalline sample of Lys-reverse-labeled GB1 protein obtained by 3D CANH (green), CA(CO)NH (blue), and 3D CANH with 4.2 ms HIGHLIGHT REDOR mixing data (red). The recycle delays were 0.3 s, 0.4 s, and 1 s for 3D CANH, 3D CA(CO)NH, and 3D CANH with HIGHLIGHT REDOR, respectively. All experiments were performed at a MAS spinning speed of 80 kHz with ~0.5 mg of sample. The total experimental times were 20 min for 3D CANH, 3.7 h for 3D CA(CO)NH, and 1 h for 3D CANH with HIGHLIGHT REDOR (for details, see the Experimental section and Fig. S2).
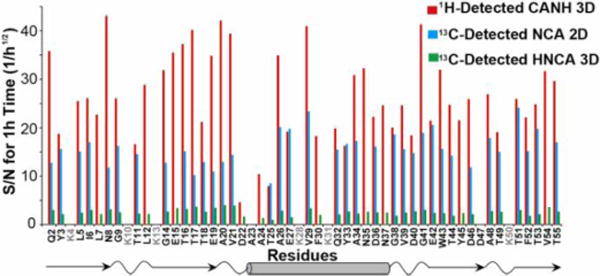
It is noteworthy that a 1H-detected 3D correlation SSNMR experiment for reverse-labeled or uniformly labeled proteins under UFMAS also offers a sensitivity advantage over the corresponding 2D 13C-detected experiment. Fig. 3 shows a comparison of signal-to-noise ratios from 2D slices from the 1H-detected 3D CANH correlation data (red bars) with those from 13C-detected 2D NCA spectrum (blue bars) and 13C-detected 3D HNCA data (green bars) for different residues. The observed sensitivity improvements in the 1H-detected 3D experiments were 1.8-fold and 10.7-fold on average, relative to the corresponding 2D and 3D 13C-detected experiments. To the best of our knowledge, this is the first time that a significant sensitivity advantage has been demonstrated for 1H-detected 3D correction relative to the 2D 13C detected spectrum of a non-deuterated protein. The data also suggest that in addition to 50- to 100-fold time-saving by the PACC method and a high-magnetic field, 1H-detected SSNMR under UFMAS at 80 kHz further speeds up main-chain assignments by two orders of magnitude over traditional 13C-detected 3D SSNMR. It should be noted that standard 13C-detected correlations such as 3D CONCA typically require even more time than 13C-detected 3D HNCA with an additional polarization transfer step. With the advantage, it is now feasible to complete assignments by a small set of 3D data and structural analysis for a 10–100 nmol of a fully protonated protein micro-crystalline sample unlike previous studies using fast MAS at ~60 kHz.
Fig. 3.

A comparison of signal-to-noise (S/N) ratios of 2D slices from 1H-detected 3D CANH correlation (red bars), 13C-detected 2D NCA correlation (blue bars), and 13C-detected 3D HNCA correlation (green bars) of the GB1 sample. All the ratios were normalized to an experimental times of 1 h. The S/N ratios were normalized to the root-square of the experimental time. The secondary structures at the bottom were obtained from a published structure (PDB id: 2QMT).18 The S/N ratios for the overlapping peaks in the 2D NCA data are not shown. The average S/N ratios for an hour of the experimental time were 27.5, 15.2, and 2.6 for 3D CANH, 2D NCA, and 3D HNCA spectra, respectively.
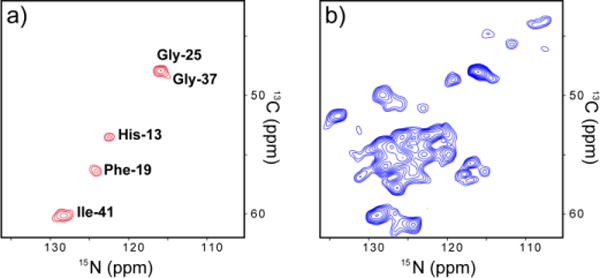
At the end, we demonstrate preliminary data showing that this HIGHLIGHT approach allows one to extend the advantage of 1H-detected SSNMR under UFMAS to heterogeneous non-crystalline proteins of biological importance. For heterogeneous proteins such as amyloid fibrils, 1H resolution is generally limited. Although 1H-detected SSNMR showed promise in a recent study of deuterated Aβ(1–40) amyloid fibers for assignments of relatively resolved spectral regions involving Gly19, a strategy of assignments by 1H-detected SSNMR for heterogeneous proteins has been lacking particularly when the resonances are congested. In particular, sequential assignments are practically impossible when several residues having the same amino-acid type coexist in similar secondary structures. Figure 4 shows our preliminary data of 2D 13Cα/15N projection spectra of 3DCANH data (a) with and (b) without HIGHLGHT REDOR for amyloid fibrils of Aβ(1–42) that is valine reverse 13C- and 15N-labeled (i.e. uniformly labeled except for valine). In (a), only 5 signals following valine residues are clearly resolved with spectral editing by the HIGHLIGHT approach, despite the nominal sample amount (~0.5 mg). In contrast, the 2D 13Cα/15N projection in (b) shows substantial spectral overlapping. Indeed, in our attempt of traditional 13C-detected 3D sequential assignments for 2 mg of uniformly 13C- and 15N- labeled Aβ(1–42) fibril, all the valine 13Cα and 15N resonances overlap around the same spectral region (data not shown). Thus, tracing the signals for valine and the residues following valine was not possible in a traditional 13C-detected 3D SSNMR approach. The approach presented here offers a new avenue to achieve spectral resolution and assignments for residues following selected unlabeled residues as re-starting points of sequential assignments with a minimal quantity of the amyloid protein of ~100 nmol or less. Although the 1H resolution for the amyloid protein sample is limited (1H line widths ~0.9 ppm) due to its inherent structural heterogeneity (Fig. S5a–c), our data clearly suggest that spectral editing by the HIGHLIGHT approach and 1H-deteted SSNMR offer excellent means to assign unresolved resonances in sequential assignments with greatly enhanced sensitivity and resolution.
Fig. 4.

2D 13Cα/15N projection spectra of 3D CANH data (a) with 4.2ms HIGHLIGHT REDOR mixing and (b) without the HIGHLGHT REDOR for amyloid fibril of Aβ(1–42) that is valine-reverse 13C- and 15N-labeled. Three 2D 13Cα/15N slices from the 3D CANH spectrum are shown in Fig. S5. The experimental times are (a) 17.8 h and (b) 3.6 h.
In conclusion, we demonstrated a general approach to achieve main-chain spectral assignments for a nominal quantity of a fully protonated protein sample by implementing combined use of 1H detection under UFMAS at 80 kHz, PACC, and high-field SSNMR for the first time. First, we demonstrated that 1H-detected SSNMR using the HIGHLIGHT approach could be highly effective for main-chain assignments for reverse-labelled proteins. Second, we experimentally demonstrated that 1H indirect detection in 2D–3D SSNMR experiments notably improved sensitivity and resolution over traditional 13C-direct detection in the corresponding 1-2D experiments. The approach does not require a high-level of 2H-labeling, which can be cumbersome as it generally limits expression yield. Lastly, the very high sensitivity achieved through a combination of high field SSNMR, PACC approach, and 1H-detection using UFMAS at 80 kHz opens the door to nanomolar-scale SSNMR for main-chain signal assignments and conformation analysis of fully protonated proteins.
All SSNMR experiments were performed on a Bruker Avance III 750MHz spectrometer at the UIC Center for Structural Biology using a JEOL 1 mm 1H/13C/15N/2H quad-resonance MAS probe. The details of the experiments and the pulse sequences used for Fig. 1–4 are listed in the ESI (Fig. S1–3).
Supplementary Material
Acknowledgments
This study was supported primarily from the U.S. National Science Foundation (CHE 957793 and CHE 1310363) for YI. The instrumentation of the 750 MHz SSNMR at UIC was supported by an NIH HEI grant (1S10 RR025105). The preparation of Aβ(1–42) fibril sample was supported by an NIH RO1 grant (9R01GM098033) for YI.
Footnotes
Electronic Supplementary Information (ESI) available: [detailed protocols for the NMR experiments, including the pulse sequences used]. See DOI: 10.1039/b000000x/
References
- 1.Ishii Y, Tycko R. J Magn Reson. 2000;142:199–204. doi: 10.1006/jmre.1999.1976. [DOI] [PubMed] [Google Scholar]
- 2.Ishii Y, Yesinowski JP, Tycko R. J Am Chem Soc. 2001;123:2921–2922. doi: 10.1021/ja015505j. [DOI] [PubMed] [Google Scholar]
- 3.Paulson EK, Morcombe CR, Gaponenko V, Dancheck B, Byrd RA, Zilm KW. J Am Chem Soc. 2003;125:15831–15836. doi: 10.1021/ja037315+. [DOI] [PubMed] [Google Scholar]
- 4.Schnell I, Saalwachter K. J Am Chem Soc. 2002;124:10938–10939. doi: 10.1021/ja026657x. [DOI] [PubMed] [Google Scholar]
- 5.Chevelkov V, Rehbein K, Diehl A, Reif B. Angew Chem Int Edit. 2006;45:3878–3881. doi: 10.1002/anie.200600328. [DOI] [PubMed] [Google Scholar]
- 6.Reif B. J Magn Reson. 2012;216:1–12. doi: 10.1016/j.jmr.2011.12.017. [DOI] [PubMed] [Google Scholar]
- 7.Zhou DH, Shah G, Cormos M, Mullen C, Sandoz D, Rienstra CM. J Am Chem Soc. 2007;129:11791–11801. doi: 10.1021/ja073462m. [DOI] [PubMed] [Google Scholar]
- 8.Marchetti A, Jehle S, Felletti M, Knight MJ, Wang Y, Xu ZQ, Park AY, Otting G, Lesage A, Emsley L, Dixon NE, Pintacuda G. Angew Chem Int Edit. 2012;51:10756–10759. doi: 10.1002/anie.201203124. [DOI] [PubMed] [Google Scholar]
- 9.Knight MJ, Webber AL, Pell AJ, Guerry P, Barbet-Massin E, Bertini I, Felli IC, Gonnelli L, Pierattelli R, Emsley L, Lesage A, Herrmann T, Pintacuda G. Angew Chem-Int Edit. 2011;50:11697–11701. doi: 10.1002/anie.201106340. [DOI] [PubMed] [Google Scholar]
- 10.Barbet-Massin E, Pell AJ, Retel JS, Andreas LB, Jaudzems K, Franks WT, Nieuwkoop AJ, Hiller M, Higman V, Guerry P, Bertarello A, Knight MJ, Felletti M, Le Marchand T, Kotelovica S, Akopjana I, Tars K, Stoppini M, Bellotti V, Bolognesi M, Ricagno S, Chou JJ, Griffin RG, Oschkinat H, Lesage A, Emsley L, Herrmann T, Pintacuda G. J Am Chem Soc. 2014;136:12489–12497. doi: 10.1021/ja507382j. [DOI] [PMC free article] [PubMed] [Google Scholar]
- 11.Wang S, Parthasarathy S, Xiao Y, Nishiyama Y, Endo Y, Nemoto T, Matsuda I, Long F, Yamauchi K, Asakura T, Takeda M, Terauchi T, Kainosho M, Ishii Y. Plos One. 2015;10:e0122714. doi: 10.1371/journal.pone.0122714. [DOI] [PMC free article] [PubMed] [Google Scholar]
- 12.Zhou DH, Shea JJ, Nieuwkoop AJ, Franks WT, Wylie BJ, Mullen C, Sandoz D, Rienstra CM. Angew Chem Int Edit. 2007;46:8380–8383. doi: 10.1002/anie.200702905. [DOI] [PMC free article] [PubMed] [Google Scholar]
- 13.Jaroniec CP, Tounge BA, Herzfeld J, Griffin RG. J Am Chem Soc. 2001;123:3507–3519. doi: 10.1021/ja003266e. [DOI] [PubMed] [Google Scholar]
- 14.Traaseth NJ, Veglia G. J Magn Reson. 2011;211:18–24. doi: 10.1016/j.jmr.2011.03.013. [DOI] [PMC free article] [PubMed] [Google Scholar]
- 15.Wickramasinghe NP, Parthasarathy S, Jones CR, Bhardwaj C, Long F, Kotecha M, Mehboob S, Fung LWM, Past J, Samoson A, Ishii Y. Nature Methods. 2009;6:215–218. doi: 10.1038/nmeth.1300. [DOI] [PMC free article] [PubMed] [Google Scholar]
- 16.Banigan JR, Gayen A, Traaseth NJ. J Biomol NMR. 2013;55:391–399. doi: 10.1007/s10858-013-9724-z. [DOI] [PMC free article] [PubMed] [Google Scholar]
- 17.Shen Y, Delaglio F, Cornilescu G, Bax A. J Biomol NMR. 2009;44:213–223. doi: 10.1007/s10858-009-9333-z. [DOI] [PMC free article] [PubMed] [Google Scholar]
- 18.Schmidt HLF, Sperling LJ, Gao YG, Wylie BJ, Boettcher JM, Wilson SR, Rienstra CA. J Phys Chem B. 2007;111:14362–14369. doi: 10.1021/jp075531p. [DOI] [PMC free article] [PubMed] [Google Scholar]
- 19.Linser R, Dasari M, Hiller M, Higman V, Fink U, del Amo JML, Markovic S, Handel L, Kessler B, Schmieder P, Oesterhelt D, Oschkinat H, Reif B. Angew Chem Int Edit. 2011;50:4508–4512. doi: 10.1002/anie.201008244. [DOI] [PubMed] [Google Scholar]
Associated Data
This section collects any data citations, data availability statements, or supplementary materials included in this article.


