

Abstract
The G2-to-M transition (or prophase) checkpoint of the cell cycle is a critical regulator of mitotic entry. SIRT2, a tumor suppressor gene, contributes to the control of this checkpoint by blocking mitotic entry under cellular stress. However, the mechanism underlying both SIRT2 activation and regulation of the G2-to-M transition remains largely unknown. Here, we report the formation of a multiprotein complex at the G2-to-M transition in vitro and in vivo. Group IVA cytosolic phospholipase A2 (cPLA2α) acts as a bridge in this complex to promote binding of SIRT2 to cyclin A-Cdk2. Cyclin A-Cdk2 then phosphorylates SIRT2 at Ser331. This phosphorylation reduces SIRT2 catalytic activity and its binding affinity to centrosomes and mitotic spindles, promoting G2-to-M transition. We show that the inhibitory effect of cPLA2α on SIRT2 activity impacts various cellular processes, including cellular levels of histone H4 acetylated at K16 (Ac-H4K16) and Ac-α-tubulin. This regulatory effect of cPLA2α on SIRT2 defines a novel function of cPLA2α independent of its phospholipase activity and may have implications for the impact of SIRT2-related effects on tumorigenesis and age-related diseases.
INTRODUCTION
Checkpoint controls are biochemical pathways that slow or retard cell cycle progression in response to stress or damage to ensure genomic stability (1). Most of the research on mitotic checkpoints has focused on the spindle checkpoint, which monitors the transition from metaphase to anaphase (2). The G2-to-M transition (prophase) checkpoint, on the other hand, when activated, inhibits cells from entering mitosis from the late G2 phase and early prophase (1, 3). This checkpoint is sensitive to a wide variety of insults, many of which do not directly damage DNA (4), such as hypothermia, anoxia, osmotic shock, and, in particular, microtubule inhibitors (5). Microtubule inhibitors induce mitotic stress by affecting several processes that occur during mitosis. These processes include separation of the centrosomes in prophase, alignment of the chromosomes on the spindle in metaphase, and sister-chromatid separation in anaphase (6–8).
SIRT2 (sirtuin-2), an NAD+-dependent histone deacetylase (HDAC), is part of the prophase checkpoint. During interphase, SIRT2 is predominantly cytoplasmic, but at the late G2 phase SIRT2 localizes to the centrosomes; and during mitosis SIRT2 is associated with mitotic spindles and midbody (9). SIRT2 plays an important role in the early mitotic checkpoint by actively delaying passage into mitosis in response to mitotic stress caused by microtubule inhibitors (10–13). SIRT2 has been shown to be downregulated in glioma and gastric cancers, and SIRT2 downregulation in glioma cells has been shown to increase aneuploidy (11, 12). SIRT2-deficient mice are cancer prone, suggesting that the SIRT2 protein functions as a tumor suppressor (14). Although the deacetylase activity of SIRT2 is necessary for its checkpoint function (11), it is not fully understood how SIRT2 acts in the mitotic checkpoint or how it is regulated in response to mitotic stress.
Here, we identified group IVA cytosolic phospholipase A2 (cPLA2α) as a binding partner that regulates SIRT2 catalytic activity. cPLA2α is a member of a family of phospholipase A2 enzymes that are characterized by their ability to cleave arachidonic acid (AA) from the sn-2 position of diacyl phospholipids (15). Since AA is the precursor for prostaglandins and leukotrienes, cPLA2α is considered to be a critical mediator of eicosanoid generation and inflammatory signaling cascades (16). The overexpression of cPLA2α has been reported in various human malignancies (17–19), and deregulation of cPLA2α expression has been implicated in tumor development. We previously reported that APCMin/+ cPLA2α−/− mice had fewer and smaller small intestine polyps than littermate APCMin/+ cPLA2α+/− mice (20). However, the molecular mechanisms through which the deregulation of cPLA2α occurs or contributes to tumor development remain unclear. We performed a yeast two-hybrid screen to identify putative cPLA2α-binding partners that could account for the proliferative function of cPLA2α (21). A total of 106 clones from a G0 human fibroblast library were screened using a fragment of cPLA2α consisting of amino acids (aa) 1 to 215 (cPLA2α1–215) as bait. cPLA2α1–215 contains the C2 (Ca2+-binding) domain and is the principal region of cPLA2α involved in protein-protein interactions (15). Yeast two-hybrid results were confirmed by coimmunoprecipitation (co-IP) and coimmunolocalization studies (21). Here, we identify SIRT2 as a cPLA2α-interacting protein. We show that cPLA2α inhibits the catalytic activity of SIRT2 and its G2/M checkpoint activity. This inhibitory function is mediated through phosphorylation of SIRT2 at Ser331 (p-SIRT2 S331) by cyclin A-Cdk2. Thus, cPLA2α is a novel regulator of SIRT2 function and the G2-to-M transition, which may explain its effects on cell proliferation and potentiation of malignant growth. Given that G2-to-M transition defects have been implicated in aging, senescence, and fibrotic diseases, these mechanisms may link cPLA2α to a number of nonmalignant disease states.
MATERIALS AND METHODS
Plasmids, cell lines, and chemicals.
HEK293 and LLC-PK1 cells were purchased from ATCC (Manassas, VA) and grown in Dulbecco's modified Eagle's medium (DMEM) with F-12 medium containing 10% fetal calf serum (FCS). LLC-mCherry, LLC-SIRT2-mCherry, LLC-EGFP (where EGFP is enhanced green fluorescent protein), and LLC-cPLA2α-EGFP cell lines were generated by transfecting LLC-PK1 cells with pmCherry-C1, pmCherry-C1-hSIRT2, pEGFP-N1, or pEGFP-N1-hcPLA2α plasmids, respectively. SIRT2 cloned in the experiments of this study is isoform 2 (GenBank accession number NP_085096.1). Forty-eight hours after transfection, 250 μg/ml G418 was added to the cells and maintained for 2 weeks. At that time, stably transfected colonies were selected. Generation of LLC-cytosolic PLA2α (LLC-cPLA2α) has been previously described (22). Generation of mouse embryonic fibroblasts (MEFs) from cPLA2α−/− mice has been already described (23). Colchicine (catalog number C9754), nocodazole (M1404), colcemid (D7385), and calcium ionophore A23187 (C7522) were purchased from Sigma (St. Louis, MO). Pyrrophenone (catalog number 525143) was purchased from Calbiochem (San Diego, CA). For generation of lentiviral supernatants, pLKO.1-puro EGFP or pLKO.1-puro SIRT2 was transfected into 293T cells with packaging plasmids pCMV-dR8.2 dvpr and pCMV-VSVG (where CMV is cytomegalovirus and VSVG is vesicular stomatitis virus G protein) using FuGENE 6. High titers of recombinant viruses were obtained 48 h after transfection and used to infect MEFs. Small interfering RNAs (siRNAs) against SIRT2 (siSIRT2) (HSC.RNAI.NO12237.12.1 and HSC.RNAI.NO12237.12.10) and cPLA2α (HSC.RNAI.NO24420.12.2 and HSC.RNAI.NO24420.12.8) were purchased from Integrated DNA Technologies (IDT). Primers used in cloning experiments were the following: cPLA2α forward (F), 5′-ATGTCATTTATAGATCCTTAC-3′; cPLA2α hemagglutinin tag (HA-cPLA2α) F, ATGTACCCTTACGACGTTCCTGATTACGCTATGTCATTTATAGATCCTTAC-3′; cPLA2α His tag (His-cPLA2α) F, 5′-GCCACCATGCATCATCATCATCATCATATGTCATTTATAGATCCT-3′; cPLA2α reverse (R), 5′-CTATGCTTTGGGTTTACT-3′; cPLA2α1–215 R, 5′-TGATTCGTATAATGCCTTCA-3′; cPLA2α lacking the N-terminal 215 aa (cPLA2αΔN215) F, 5′-ATGGGAATTCTGGATTGTGCT-3′; SIRT2 S331E mutant (SIRT2S331E) F, 5′-CAACCCCAGCACTTCAGCTGAGCCCAAGAAGTCCCCG-3′, and R, 5′-CGGGGACTTCTTGGGCTCAGCTGAAGTGCTGGGGTTG-3′; SIRT2 S331A mutant (SIRT2S331A) F, 5′-cAACCCCAGCACTTCAGCTGCCCCCAAGAA-3′, and R, 5′-TTCTTGGGGGCAGCTGAAGTGCTGGGGTGG-3′; SIRT2136–352 F, 5′-GAGCGAATAGCCGGGCTGGA-3′; SIRT2136–224 R, 5′-ACCCATGACCAGGAGGAGGT-3′; SIRT2136–194 R, 5′-ATCAGGCTTCACCAGGCTCT-3′.
Antibodies.
Antibodies were mouse monoclonal anti-T7 tag, rabbit anti-HA, rabbit anti-SIRT2, anti-Flag M2 monoclonal antibody (MAb), rabbit anti-EGFP, rabbit anti-cyclin A, and mouse anti-α-tubulin (all from Santa Cruz, Dallas, TX), rabbit anti-SIRT1 (Upstate laboratories, Lake Placid, NY), mouse anti-phospho-MPM2 (anti-p-MPM2; Millipore, Bedford, MA), rat antibromodeoxyuridine (anti-BrdU) (Abcam, Cambridge, MA), rabbit anti-Ki-67 (Vector Laboratories, Burlingame, CA), Ser331-phosphorylated SIRT2 antibody (Active Motif, Carlsbad, CA), rabbit anti-cPLA2α antibody (Cell Signaling, Danvers, MA), and mouse anti-acetylated (Ac)-α-tubulin (Sigma-Aldrich, St. Louis, MO). Secondary antibodies for immunofluorescence were supplied by Jackson Laboratories (Bar Harbor, ME).
Induction of G2-to-M arrest in mice.
Generation of cPLA2α-deficient mice has been previously described (23). Male mice aged 8 to 12 weeks weighing 20 to 25 g were used. Ischemia was induced by the retroperitoneal approach on both kidneys for 26 min at 37.0°C (moderate ischemia-reperfusion injury [IRI]) as previously reported (24, 25). One milliliter of warm saline (37°C) was injected intraperitoneally after surgery for volume supplementation. Colchicine (20 μg) in phosphate-buffered saline (PBS) was injected intraperitoneally at 24 and 48 h after ischemia. The plasma creatinine concentration was determined by the picric acid method. Kidney histology was examined on formalin sections. All mouse work was performed in accordance with the animal use protocol approved by the Institutional Animal Care and User Committee of the Harvard Medical School.
Two-hybrid screen.
A human fibroblast G0 library cloned into pJG4-5 was obtained from C. Sardet at the Whitehead Institute and Massachusetts Institute of Technology. The Saccharomyces cerevisiae EGY48 strain (obtained from R. Brent at the Berkeley Molecular Sciences Institutes), which contains an integrated copy of the LEU2 gene with upstream activating sequences replaced by six LexA operators, was transformed with both the reporter plasmid pSH18-34 and the bait plasmid pEG202-cPLA2α1–215 and by using lithium acetate. Yeast colonies containing both bait and reporter plasmids were selected on glucose-containing medium lacking Ura and His (Ura− His−) and transformed with the library cDNA in a GAL1-inducible expression vector, pJG4-5. Transformants were selected on Ura− His− Trp− glucose-containing plates, and 106 CFU were plated onto Ura− His− Trp− Leu− galactose-raffinose medium. Positive colonies were grown in Trp− glucose-containing medium. Isolated prey plasmids were rescued and electroporated into KC8 strains of Escherichia coli. Interacting cDNA was cloned into pBluescript and pMT3 and amplified in XL-1 Blue strains of E. coli for sequencing and transfection experiments. DNA was sequenced completely on both strands using customized oligonucleotides and standard techniques.
Coimmunoprecipitation experiments.
Cells were plated at 50 to 60% confluence and transfected with Lipofectamine 2000 according to the manufacturer's recommendations. Forty-eight hours after transfection confluent monolayers of cells were harvested into 750 μl of buffer containing 20 mM HEPES (pH 7.4), 2 mM EGTA, 1% Triton, 1 mM sodium vanadate, 50 mM glycerophosphate, 400 mM phenylmethylsulfonyl fluoride, 2 mM leupeptin, 1 mM dithiothreitol, and 10% glycerol. Lysates were incubated with the antibodies indicated on the figures at concentrations recommended by manufacturers. Immunoprecipitation was performed overnight at 4°C, followed by protein A/G-agarose beads (Santa Cruz, Dallas, TX) for 1 h at 4°C. Precipitated proteins were run on a 10% SDS gel at 100 V and electrophoretically transferred onto Immobilon membranes (Millipore, Bedford, MA). Membranes were developed by chemiluminescence (PerkinElmer, Waltham, MA).
Subcellular fractionations.
Cytoplasmic, membrane, and nuclear extracts were obtained by using a Subcellular Protein Fractionation kit according to the manufacturer's instructions (Thermo Scientific, Hudson, NH).
Adenovirus construction.
For generating adenovirus expressing cPLA2α (Ad-cPLA2α), cPLA2α cDNA was subcloned into the NotI and XhoI sites of pADRSV4. Position and orientation of the insert were confirmed by sequencing of the 5′ ends of the constructs using a pADRSV4 primer. pADRSV4-cPLA2α was cotransfected into 293 cells with pJM17, which contains adenoviral cDNA. Homologous recombinants between pADRSV4-cPLA2α and pJM17 contain exogenous DNA substituted for E1, which allows adenovirus-driven expression of the exogenous protein or cPLA2α. Individual plaques were purified, and cPLA2α protein expression was confirmed by immunoblotting using anti-cPLA2α antibody. The recombinant adenovirus was prepared in high titer by propagation in 293 cells and by purification by a CsCl gradient. For all experiments, recombinant adenovirus carrying the Escherichia coli LacZ gene encoding β-galactosidase was used as a control (Ad-LacZ).
Immunofluorescence microscopy.
Cells grown on coverslips were fixed in 2% paraformaldehyde (PFA)-PBS for 10 min at room temperature. Fixed cells were permeabilized with 0.1% Triton X-100 in PBS for 3 min and blocked in 2% calf serum for 30 min at room temperature. Cells were then incubated with primary antibody for 2 h and then washed three times with 1× PBS–0.1% Tween 20 (PBST). Fluorophore-conjugated secondary antibody was added for 45 min at room temperature. After three washes using 1× PBST, coverslips were mounted with Vectashield (Vector Laboratories, Burlingame, CA) and examined with a confocal Nikon C1 microscope. For colocalization studies, scatter plots and Manders' coefficients were obtained using the ImageJ plug-in Intensity Correlation Analysis. Quantification of relative accumulation of SIRT2 at mitotic spindles and centrosomes was performed using ImageJ as previously described (26). Briefly, a mask was created for quantification of SIRT2 signal on the mitotic structures, centered on the maximum intensity of the signal (3 by 3 pixels). The background, including signal from soluble SIRT2, was estimated in a region surrounding the mask (1 pixel wide).
Western blotting.
For Western blotting, equal amounts of protein samples or protein samples derived from an equal number of cells were separated on 10%, 12.5%, or 15% polyacrylamide gels and transferred to a nitrocellulose membrane (Amersham Pharmacia, Piscataway, NJ). Blots were incubated with primary antibodies overnight. After being washed, blots were incubated with a 1:4,000 dilution of secondary antibody for 1 h. Blots were developed with an ECL detection system (PerkinElmer, Waltham, MA).
Quantitative real-time PCR.
Total RNA was extracted from 10 to 15 renal frozen tissue samples using TRIzol (Invitrogen, Carlsbad, CA). RNA samples were quantified by spectrophotometry (NanoDrop) and converted to DNA using oligo(dT). Quantitative real-time PCR was performed on an iCycler iQ (Bio-Rad), using a real-time PCR assay kit (Bio-Rad, Richmond, CA). Primers were SIRT2 forward, 5′-TTCAAGAAACATCCGGAACC-3′, and reverse, 5′-GGAGTAGCCCCTTGTCCTTC-3′.
Flow cytometry.
Cells synchronized by double-thymidine block and nocodazole-treated cells were collected at the indicated time points and washed with PBS, fixed in cold 70% ethanol, and stained with propidium iodide (Sigma-Aldrich, St. Louis, MO) and the indicated antibodies according to the manufacturer's instructions. Stained cells were sorted with a FACSCalibur flow cytometer (BD Bioscience, San Jose, CA) and analyzed with FlowJo, version 7.5.5, software.
Mitotic Index.
Cells were plated on 18-mm coverslips and fixed with 2% PFA–PBS for 10 min at room temperature, permeabilized with 0.1% Triton X-100–PBS, stained with phospho-H3 (p-H3) antibody and 4,6-diamidino-2-phenylindole (DAPI; Sigma-Aldrich, St. Louis, MO), and mounted on glass microscope slides. The mitotic index (MI) was determined by inspecting more than 400 cells per data point.
HDAC assay.
Immunoprecipitated materials were washed in deacetylase buffer (50 mM Tris-HCl [pH 9.0], 4 mM MgCl2, 0.2 mM dithiothreitol [DTT]) and resuspended in 100 μl of deacetylase buffer containing acetylated [3H]histone H4 peptide (amino acids 1 to 21) (SignalChem, Richmond, British Columbia, Canada) for 2 h at room temperature. Reactions were stopped by the addition of 25 μl of 0.1 M HCl and 0.16 M acetic acid. Released acetate was extracted in ethyl acetate and counted in scintillation fluid. NAD+ (1 mM) or nicotinamide (5 mM) was added to reaction mixtures specified in the figures.
In vitro kinase assay.
Glutathione S-transferase (GST)-purified or immunoprecipitated proteins were incubated with recombinant active human full-length cyclin A-Cdk2 complex (Millipore, Bedford, MA) in 50 μl of kinase buffer (50 mM Tris-HCl [pH 7.4], 10 mM MgCl2, 2 mM EGTA, phosSTOP [Roche], 0.5 mM ATP, and [γ-32P]ATP for 30 min at 30°C. Reactions were stopped by the addition of 2× SDS sample buffer and analyzed by SDS-PAGE, followed by autoradiography.
Cell synchronization.
For G1-S synchronization, unlabeled thymidine was added to each monolayer culture to a final concentration of 2 mM. After 11 h, the medium containing excess thymidine was removed, and the cells were washed twice with fresh medium and returned to the incubator in DMEM–F-12 medium supplemented with 10% fetal bovine serum (FBS) at 37°C. After 9 h, unlabeled thymidine at a final concentration of 2 mM was added to the cultures for a second 11-h interval. At the end of the second thymidine block, the cells were washed free of thymidine as described above, and the characteristics of the following DNA synthesis period were analyzed by flow cytometry as described in Results.
For mitotic shake-off, the same numbers of proliferating wild-type (WT) and cPLA2α−/− cells were seeded into T150 flasks (5 × 10⁶ cells/flask) approximately 12 to 16 h prior to the start of each experiment. Cells were treated with 0.4 μM nocodazole, and after 8 h loosely attached cells were dislodged by firm tapping of the flasks and then aspirated. Cells were returned to the incubator, and the shake-off was repeated every 2 h.
Live-cell analysis.
HEK293 cells expressing GFP-tagged histone H2B (H2B-GFP cells) were plated onto 35-mm dishes and then transfected with either a scrambled (control) siRNA or siRNA directed against SIRT2 or cPLA2α. Live-cell imaging was performed with a Nikon Eclipse Ti microscope using a Photometrics Nikon DS-Qi1Mc camera. The microscope was equipped with an environmental control chamber. The temperature was maintained at 37°C, and the CO2 was kept at 5%. For each condition, at least 50 divisions from three independent trials were examined. Cells in four dishes were imaged every 5 min for 24 h with a Prior Scientific motorized stage. All images were collected with a Plan Fluor 20× lens (numerical aperture, 0.6) with Chroma filter set 41001 configured for EGFP tags. Exposure times were 450 ms with a camera binning of 2. The data were analyzed with the Nikon NIS Elements software and converted into movie files (AVI format). Owing to the large size of the movie files required to keep optimal resolution, a sampling of the most representative movies is included in the supplemental material with other movies available on request.
Statistics.
Multiple group analyses were performed by analysis of variance (ANOVA). Student's t test was used to determine a significant difference between two groups. P values of less than 0.05 were considered statistically significant. The error bars represent mean values ± standard deviations (SD).
RESULTS
Identification and characterization of cPLA2α-SIRT2 interaction.
A two-hybrid screen employing cPLA2α1–215 as bait and a G0 human fibroblast library identified three cPLA2α-interacting proteins: Tip60, PLIP (21), and a novel interacting peptide (see Fig. S1A in the supplemental material). The identified interacting peptide, 1,266 bp in length, aligned with the peptide at bp 660 to 1926 of SIRT2, encoding amino acids 136 to 352 and the 3′ untranslated region (UTR) (Fig. 1A). The identified peptide, tagged with T7 antigen, interacted with cPLA2α in HEK293 cells (Fig. 1B). T7-tagged PLIP and T7-tagged Kid1 (27) were used as positive and negative controls, respectively. Reciprocal co-IP confirmed interaction between HA-cPLA2α and full-length EGFP-SIRT2 in HEK293 cells (Fig. 1C and D). To investigate the specificity of this interaction, we tested whether cPLA2α interacted with SIRT1, another mammalian homolog of yeast Sir2 with a significant amount of homology to SIRT2 (39% identity and 59% similarity) (28). In contrast to SIRT2, SIRT1 did not coimmunoprecipitate with cPLA2α (see Fig. S1B in the supplemental material). Reciprocal co-IP confirmed interaction between endogenous SIRT2 and cPLA2α in wild-type mouse embryonic fibroblasts (MEFs) but not MEFs derived from cPLA2α−/− mice (Fig. 1E, left panel). The efficiency of co-IP in each experiment was quantified by comparing the intensity of the IP bands to those of the control reactions (Fig. 1E, right panel). His-tagged cPLA2α coimmunoprecipitated with GST-SIRT2 in a cell-free system, indicating a direct interaction between these two molecules (Fig. 1F).
FIG 1.

cPLA2α specifically interacts with SIRT2. (A) Identified peptide (interacting fragment) aligned with SIRT2 bp 660 to 1926. (B) Interaction of full-length cPLA2α and the identified peptide in HEK293 cells. cPLA2α interacts with PLIP but not with Kid1 as positive and negative controls, respectively. Relative molecular weights in thousands are given to the left. (C and D) Reciprocal interaction of HA-cPLA2α with EGFP-SIRT2 in HEK293 cell lysates. Specificity was confirmed by using species-matched control IgG (Ctrl IgG). Input shows levels of cPLA2α and SIRT2 in total lysate. (E) Reciprocal interaction of endogenous cPLA2α and SIRT2 in wild-type MEFs by immunoprecipitation using anti-cPLA2α and anti-SIRT2 antibodies in two different reactions. Specificity was confirmed by using species-matched control IgG (Ctrl IgG) and cPLA2α−/− MEFs as negative controls. (F) Purified GST or GST-SIRT2 was incubated with purified His-cPLA2α. GST was immunoprecipitated, and His-cPLA2α bound to GST-SIRT2 was examined by Western blotting. Coomassie staining shows the expression of different proteins in each reaction product. (G) Generation of deletion mutant constructs of SIRT2 tagged with T7 antigen (upper panel) and interaction of cPLA2α with T7-tagged deletion mutants of SIRT2 in HEK293 cells (lower panel). cPLA2α interacts with SIRT2136–352 and SIRT2136–224 but not with SIRT2136–194 or the KRAB-A domain of Kid1 (Kid1A) (negative control). (H) Generation of deletion mutant constructs of cPLA2α tagged with EGFP (upper panel) and co-IP between SIRT2 and EGFP-tagged deletion mutants of cPLA2α (lower panel). IB, immunoblotting; LC, light chain; CDS, coding sequence; FL, full-length; Ab, antibody.
Next, we sought to determine which region of SIRT2 was necessary for interaction with cPLA2α. Our two-hybrid study had indicated the binding of cPLA2α1–215 to SIRT2136–352. T7-tagged deletion mutants of SIRT2 were generated (Fig. 1G, upper panel). In HEK293 cells, cPLA2α coimmunoprecipitated with SIRT2136–352 and SIRT2136–224, but not with SIRT2136–194 (Fig. 1G, lower panel). Thus, the fragment consisting of aa 136 to 224 of SIRT2 is sufficient and the fragment consisting of aa 194 to 224 is necessary for interaction with cPLA2α. The fragment consisting of aa 194 to 224 contains a RING finger-like motif including four cysteine residues that form a tetrahedral complex to a zinc atom that may play a role in a protein-protein interaction (29, 30). The yeast-two hybrid analysis also indicated that the region of aa 1 to 215 of cPLA2α mediates the association of cPLA2α with full-length SIRT2. To further confirm this finding, EGFP-tagged deletion mutants of cPLA2α were generated (Fig. 1H, upper panel). Indeed, co-IP experiments performed in HEK293 cells confirmed that full-length cPLA2α and cPLA2α1–215 interacted with SIRT2 while cPLA2α lacking the N-terminal 215 aa (cPLA2αΔN215) failed to coimmunoprecipitate with SIRT2 (Fig. 1H, lower panel). The ΔN215 mutant was utilized as a nonbinding mutant in subsequent experiments.
SIRT2 colocalizes with cPLA2α.
To assess the cellular localizations of SIRT2 and cPLA2α, we generated LLC-PK1 cell lines that stably expressed mCherry-tagged SIRT2 (LLC-SIRT2-mCherry) and cells that stably expressed EGFP-tagged cPLA2α (LLC-cPLA2α-EGFP). Control cells were generated expressing mCherry (LLC-mCherry) or EGFP (LLC-EGFP) (Fig. 2A). As expected, SIRT2 and cPLA2α remained mainly cytoplasmic in unsynchronized cells (Fig. 2A). During mitosis, however, SIRT2 and cPLA2α localized more abundantly to mitotic spindles and centrosomes (for SIRT2, 88%; for cPLA2α, 67%; n = 200) (Fig. 2B). A transversal line was drawn through the nucleus in the merged images using ImageJ software, and the signal intensities for SIRT2, cPLA2α, and DAPI were plotted in corresponding line graphs (Fig. 2B). Next, we sought to investigate the intracellular biochemical distribution of cPLA2α and SIRT2 at the G2/M phase of the cell cycle. HEK293 cells were synchronized at the G2/M boundary using RO-3306 (31) (Fig. 2C, upper panel) and then fractionated into cytoplasmic extracts (CE) and nuclear extracts (NE). In asynchronous cells, SIRT2 and cPLA2α were mainly found in the cytosolic fraction, while they accumulated more abundantly in the nuclear fraction in G2/M synchronized cells, indicating that nuclear accumulation of SIRT2 and cPLA2α is present at the end of the G2 phase (Fig. 2C, lower panel). No significant cross-contaminations were found between the different cell fractions when they were analyzed for the presence of the cytosolic glyceraldehyde-3-phosphate dehydrogenase (GAPDH) protein and the nuclear lamin A/C protein (Fig. 2C, lower panel). Colocalization of endogenous SIRT2 and cPLA2α during mitosis was further examined in HEK293 cells. Immunofluorescence experiments confirmed that cPLA2α and SIRT2 colocalized on the centrosomes and mitotic spindles from prophase until metaphase (Fig. 2D). These stages were identified by centrosome separation and the beginning of chromosome condensation (prophase), spindle formation at opposite sides (prometaphase), and alignment of chromosomes in the midline (metaphase). Quantitative colocalization analysis was performed using ImageJ software, and scatter blots and Manders' colocalization coefficients were determined. Quantitative results revealed a significant degree of colocalization between SIRT2 and cPLA2α in prophase (0.76 ± 0.12), prometaphase (0.72 ± 0.18), and metaphase (0.62 ± 0.22) (P < 0.01).
FIG 2.

cPLA2α and SIRT2 colocalize to the mitotic spindles during mitosis. (A) Cellular localization of SIRT2-mCherry and cPLA2α-EGFP in stably transfected LLC-PK1 cells (left panels). LLC-mCherry and LLC-EGFP cells were generated as controls. DNA was stained with DAPI (blue). Scale bar, 50 μm. At right, Western blotting confirmed expression of SIRT2-mCherry and cPLA2α-EGFP fusion proteins (arrowheads) in LLC-cPLA2α-EGFP and LLC-SIRT2-mCherry cells, respectively. (B) Confocal images show the locations of SIRT2 and cPLA2α during mitosis in LLC-SIRT2-mCherry and LLC-cPLA2α-EGFP cells, respectively. Costaining with Ac-α-tubulin antibody shows the colocalization of the two proteins with mitotic spindles. The graphs represent signal intensity scans along the lines drawn. Scale bar, 10 μm. (C) HEK293 cells were arrested at the G2/M boundary by RO-3306 (upper panel). Cells were fractionated into cytoplasmic extracts (CE) and nuclear extracts (NE) (lower panel). Western blotting was performed using the indicated antibodies. (D) HEK293 cells were immunostained with antibodies against cPLA2α and SIRT2, followed by DAPI staining. Colocalization of SIRT2 and cPLA2α in prophase, prometaphase, and metaphase appears as yellow in the merge. Scale bar, 5 μm. Intensity correlation analyses are represented by the color scatter plots of the paired intensities of the red and green channels using ImageJ. Asynch, asynchronous.
cPLA2α suppresses catalytic activity of SIRT2.
Thus far, we have identified a physical interaction and colocalization of cPLA2α and SIRT2. To understand the physiological consequences of this interaction, we monitored possible alteration of the deacetylase function of SIRT2 on its known substrates, histone H4 acetylated at K16 (Ac-H4K16) (10) and Ac-α-tubulin (32) in the presence of cPLA2α. LLC-mCherry and LLC-mCherry-SIRT2 cells were infected for 48 h with adenoviruses coding for LacZ (Ad-LacZ) or cPLA2α (Ad-cPLA2α). SIRT2-expressing cells infected with Ad-cPLA2α had larger amounts of Ac-H4K16, indicating that deacetylation of H4K16 was impaired in the presence of cPLA2α (Fig. 3A lane 4). Next, WT and cPLA2α−/− MEFs were infected with Ad-cPLA2α or Ad-LacZ. Expression of exogenous cPLA2α resulted in an increase in Ac-H4K16 levels in cell lysates of both WT and cPLA2α−/− MEFs (Fig. 3B, lanes 1, and 3). In another experiment HEK293 cells were transfected with empty vector (mock), cPLA2α, or the phospholipase-deficient mutant cPLA2αS228A. Both cPLA2α and cPLA2αS228A inhibited SIRT2 deacetylase activity, indicating that the inhibitory effect of cPLA2α on SIRT2 deacetylation is independent of cPLA2α phospholipase activity (Fig. 3C). cPLA2αΔN215 failed to inhibit catalytic activity of SIRT2 on Ac-H4K16 (Fig. 3D), indicating that physical interaction between cPLA2α and SIRT2 is necessary to inhibit SIRT2 catalytic activity.
FIG 3.

cPLA2α inhibits SIRT2 deacetylase activity. (A) LLC-mCherry cells (lanes 1 and 3) and LLC-SIRT2-mCherry cells (lanes 2 and 4) were infected with Ad-LacZ or Ad-cPLA2α. Levels of Ac-H4K16 were examined by Western blotting in total lysates. Levels of SIRT2, cPLA2α, ERK, and H4K16 were compared in total lysates. Intensities of Ac-H4K16 bands were quantified by ImageJ from three independent experiments. (B) WT and cPLA2α−/− MEFs were infected with Ad-LacZ or Ad-cPLA2α. Levels of Ac-H4K16 were detected by Western blotting in total lysates. Intensities of Ac-H4K16 bands were quantified by ImageJ (n = 3). (C) LLC-PK1 cells were mock transfected (lane 1), transfected with SIRT2 (lane 2), or cotransfected with SIRT2 and WT cPLA2α (lane 3) or with SIRT2 and cPLA2αS228A (lane 4). Cell lysates were subjected to Western blotting for detection of Ac-H4K16. Intensities of Ac-H4K16 bands were quantified by ImageJ (n = 3). (D) LLC-PK1 cells were transfected with SIRT2, SIRT2 and cPLA2α, or SIRT2 and cPLA2αΔN215. Ac-H4K16 levels were quantified by Western blotting. Intensities of Ac-H4K16 bands were quantified by ImageJ (n = 3). (E) SIRT2 was immunoprecipitated from mock-transfected LLC-PK1 cells (no SIRT2), SIRT2-transfected cells (SIRT2), or LLC-PK1 cells cotransfected with SIRT2 and cPLA2α (SIRT2/cPLA2α). Pulled-down beads were subjected to the HDAC assay in vitro by measuring the release of 3H-labeled acetyl groups from a histone H4 peptide (aa 1 to 21) under the conditions indicated. cpm, counts per minute. (F) Levels of Ac-α-tubulin were detected by Western blotting in total lysates of control HEK293 cells treated with control scrambled or cPLA2α siRNA. Intensities of Ac-α-tubulin bands were quantified by ImageJ (n = 3). (G) cPLA2α−/− MEFs were infected with Ad-LacZ or Ad-cPLA2α and treated with cycloheximide. Cell lysates were analyzed at the indicated time points by Western blotting for SIRT2 levels. ERK was used as a loading control. (H) SIRT2 mRNA levels were quantified in WT and cPLA2α−/− MEFs by quantitative reverse transcription-PCR. (I) cPLA2α-mediated AA release in the presence and absence of SIRT2 (upper panel). Cells were left untreated or were treated with ionophore A23187. Western blotting confirmed expression of proteins in transfected cells (lower panel). *, P < 0.05; **, P < 0.01. AU, arbitrary units.
The ability of cPLA2α to modulate deacetylation of a histone H4 peptide by SIRT2 was also tested in cell extracts. Purified SIRT2 from mock-transfected cells (no SIRT2), SIRT2-transfected cells (SIRT2), or cells coexpressed with SIRT2 and cPLA2α (SIRT2/cPLA2α) were incubated with an acetylated-[3H]histone H4 substrate (amino acids 1 to 21) in a deacetylase assay in the presence or absence of NAD+ and nicotinamide (NIC). NAD+ is necessary for sirtuins' catalytic activity (32). Coexpression of cPLA2α significantly repressed deacetylation of the histone H4 peptide by SIRT2 in the presence of NAD+ (for SIRT2/cPLA2α, 2,326 ± 89 cpm versus 5,462 ± 243 cpm for SIRT2; P < 0.01) (Fig. 3E). Addition of nicotinamide, an inhibitor of sirtuin activity (32), completely inhibited SIRT2 deacetylase activity. Next, cPLA2α was knocked down by siRNAs in HEK293 cells, and levels of Ac-α-tubulin were quantified. In cPLA2α-deficient cells, levels of Ac-α-tubulin were significantly reduced (30% decrease compared to control levels) (Fig. 3F). These data altogether indicate an inhibitory effect of cPLA2α on SIRT2 catalytic activity.
To examine whether cPLA2α alters the stability of SIRT2, the half-life of SIRT2 was assessed by rates of protein loss after cycloheximide treatment. cPLA2α−/− MEFs were infected with Ad-LacZ or Ad-cPLA2α. Cells were then treated with cycloheximide for an additional 8 h, and extracts were subjected to Western blotting for SIRT2. cPLA2α expression had no effect on the stability of SIRT2 (Fig. 3G). Additionally, absence of cPLA2α did not affect SIRT2 mRNA levels in MEFs (Fig. 3H), further suggesting that cPLA2α regulates SIRT2 activity by a posttranslational mechanism.
Next, we investigated whether SIRT2 overexpression can alter cPLA2α phospholipase activity. LLC-pCDNA and LLC-cPLA2α cells were transfected with an empty plasmid (mock) or a SIRT2-expressing plasmid. [3H]AA release was measured in the presence or absence of ionophore (Fig. 3I, upper panel). SIRT2 had no effect on passive release or calcium ionophore A23187-stimulated release of AA in cPLA2α-expressing epithelial cells. Western blotting confirmed expression of each protein in transfected cells (Fig. 3I, lower panel).
Overexpression of cPLA2α antagonizes checkpoint activity of SIRT2.
Since G2/M checkpoint activity of SIRT2 has been attributed to its catalytic activity, we examined whether cPLA2α overexpression can suppress the SIRT2-mediated G2/M checkpoint. First, we confirmed the G2/M checkpoint activity of SIRT2 in LLC-PK1 epithelial cells during mitotic stress. We chose microtubule inhibitors, nocodazole and colcemid, as mitotic stressors since these drugs cause mitotic stress without affecting G1 and G2 DNA damage checkpoints (8, 11). The chromatin pattern of untreated LLC-PK1 cells in different stages of the cell cycle was noted (Fig. 4A) and then used to quantify the mitotic index (MI) in response to mitotic stress induced by microtubule inhibitors. LLC-mCherry and LLC-SIRT2-mCherry cells were treated with 0.4 μM nocodazole or 1 μM colcemid, and the MI was determined at 9, 14, and 18 h. Overexpression of SIRT2 in LLC-PK1 cells significantly decreased the MI in response to nocodazole (NOC) (Fig. 4B left panel) or colcemid (Fig. 4C). There were no effects of SIRT2 on MI in the absence of stress, indicating that mitotic stress is a prerequisite for SIRT2 checkpoint activity. Flow cytometry at 14 h showed similar increases in the G2/M fraction after nocodazole treatment in all groups, indicating that the differences in MI values are not a reflection of differences in total nocodazole-induced G2/M-arrested cells (Fig. 4B right panel).
FIG 4.

Overexpression of cPLA2α inhibits SIRT2-mediated G2/M arrest during mitotic stress. (A) Chromatin patterns of LLC-PK1 cells in different phases of the cell cycle shown with p-H3 and with DAPI immunostaining. (B) Mitotic index in nocodazole-treated (NOC) LLC-mCherry and LLC-SIRT2-mCherry cells (left panel). The graph in the right panel shows the cell cycle distribution of each group at 14 h posttreatment. DMSO, dimethyl sulfoxide. (C) Mitotic index in colcemid (COL)-treated LLC-mCherry and LLC-SIRT2-mCherry cells. (D) Flowchart illustrating how experiments shown in panels E to G were performed. (E) LLC-mCherry and LLC-SIRT2-mCherry cells were infected with Ad-cPLA2α or Ad-LacZ (left panel). Cells were treated with nocodazole. Mitotic index values were compared at different time points. The graph in the right panel shows the cell cycle distribution of each group at 14 h. (F) LLC-mCherry and LLC-SIRT2-mCherry cells were infected with Ad-cPLA2α or Ad-LacZ for 48 h. Cells were treated with colcemid. Mitotic index values were compared at different time points. (G) LLC-SIRT2-mCherry cells were infected with Ad-cPLA2α or Ad-LacZ. Cells were treated with nocodazole. In specified experiments cells were pretreated with pyrrophenone, a specific inhibitor of cPLA2α phospholipase activity. Mitotic index values were compared at different time points. (H) SIRT2-overexpressing cells were transfected with cPLA2α or cPLA2αΔN215. The MI was quantified in response to nocodazole. *, P < 0.05; **, P < 0.01.
Next, we designed experiments to test the effect of cPLA2α expression on SIRT2-mediated G2/M checkpoint activity (Fig. 4D). LLC-mCherry and LLC-SIRT2-mCherry cells were infected with Ad-cPLA2α or Ad-LacZ. Cells were then treated with nocodazole or colcemid 48 h later. Coexpression with cPLA2α but not LacZ antagonized the G2/M checkpoint function of SIRT2 in mitotically stressed LLC-SIRT2-mCherry cells, as indicated by higher mitotic index values in the cPLA2α-infected cells in response to nocodazole (Fig. 4E, left panel) and colcemid (Fig. 4F). Flow cytometry at 14 h showed a similar distribution of DNA content in all nocodazole-treated groups (Fig. 4E, right panel). Pretreatment with 5 μM pyrrophenone, a specific inhibitor of cPLA2α phospholipase activity at this concentration (33), had no significant effect on the MI in SIRT2-mCherry-overexpressing cells infected with Ad-cPLA2α (Fig. 4G). Thus, cPLA2α can potentiate mitotic entry by inhibiting SIRT2 by mechanisms independent of its phospholipase activity. SIRT2-mCherry-overexpressing cells were treated with cPLA2α or cPLA2αΔN215. MI was quantified in the presence or absence of nocodazole. The ΔN215 mutant failed to antagonize SIRT2 checkpoint activity (Fig. 4H). Collectively, these data indicate that cPLA2α overexpression suppresses the prophase checkpoint and augments the G2-to-M transition by inhibiting SIRT2.
Reduction of cPLA2α delays G2-to-M transition but does not affect exit from mitosis.
Fewer mitotic cells (lower MI values) could be the result of either decreased entry into, or faster exit from, mitosis; therefore, we determined how cPLA2α-SIRT2 interaction affects mitotic entry and mitotic exit. First, we investigated the progression of the cell cycle in wild-type HEK293 cells and in HEK293 cells with siRNA-reduced cPLA2α or SIRT2 expression (Fig. 5A). Progression through S and G2 phases of the cell cycle was monitored over time after thymidine block release (Fig. 5B). There were no significant differences in the populations of S- and G2-phase cells compared with the levels in control cells over time in nonstressed cells (Fig. 5C). Next, cPLA2α-deficient and control cells were synchronized by a double-thymidine block at the G1-S boundary and then allowed to proceed through the cell cycle with or without mitotic stress. We monitored progression through the cell cycle by measuring the mitotic index. In the absence of mitotic stress, cPLA2α had no significant effect on cell cycle progression (Fig. 5D). In the presence of mitotic stress, which was induced by adding nocodazole 6 h after release from the G1-S block, control cells entered metaphase with the same kinetics as in the absence of mitotic stress; however, there was blocked entry to metaphase in the cPLA2α-deficient cells. The timing of induction of mitotic stress was critical for cPLA2α to affect entry into metaphase; when mitotic stress was induced 8 h after release from the G1-S block, both cPLA2α-deficient and control cells entered metaphase with the same kinetics as in the absence of mitotic stress (Fig. 5D). The observation that lack of cPLA2α blocks entry of cells into metaphase when mitotic stress was induced 6 h but not 8 h after release from the G1-S block implies that the function of cPLA2α is related to a process(es) that occurs between these time points. We used the position of the centrosomes relative to each other and chromosome condensation as markers to define the specific phases of the cell cycle corresponding to the 6-h and 8-h time points. Centrosomes are closely positioned throughout G2, but during prophase they separate and move along the periphery of the nucleus toward opposite sides of the cell (34). Six hours after release from the G1-S block, centrosomes had not separated, indicating that the cells were in G2 (Fig. 5E). At 8 h the cells were in prophase, as centrosome separation was complete. Thus, the function of cPLA2α must relate to a process(es) that occurs during prophase, such as separation of the centrosomes. In both control and cPLA2α-deficient cells which were treated with nocodazole at the 6-h time point, centrosome separation was inhibited at the 8-h time point (Fig. 5E); whereas a significant number of control cells had condensed chromosomes at 8 h, fewer cPLA2α-deficient cells had chromosome condensation, a property of early M phase (Fig. 5E). Thus, cPLA2α enhances movement through the cell cycle from centrosome separation to chromosome condensation under conditions of stress. Treatment with sirtinol, a SIRT2 inhibitor, significantly increased the number of cells with condensed chromosomes at the 8-h time point in cPLA2α-deficient cells, indicating that the effect of cPLA2α on inhibition of chromosome condensation in the presence of mitotic stress is dependent on SIRT2 activity (Fig. 5E). Further, live-cell imaging showed identical mitotic kinetics in wild-type HEK293 cells and cells in which cPLA2α or SIRT2 was knocked down (Fig. 5F; see also Movies S1 to S3 in the supplemental material).
FIG 5.

Lack of cPLA2α blocks mitotic entry under mitotic stress. (A) Efficiency of SIRT2 and cPLA2α knockdown by siRNA in HEK293 cells was verified by Western blotting. (B) Graph shows the cell cycle progression of control (Ctrl) and cPLA2α-deficient HEK293 cells until 8 h after double-thymidine block release. (C) Populations of cells in each phase of the cell cycle from the experiment shown in panel B were quantified (n = 3). (D) Mitotic index of synchronized HEK293 cells transfected with control or cPLA2α siRNA as a function of time after release from the G1-S block. The cells were either not exposed to mitotic stress or treated with nocodazole (Noc) (at 6 or 8 h), or with nocodazole plus sirtinol (at 6 h) after release from the cell cycle block. (E) Centrosome separation and chromatin condensation in synchronized control and cPLA2α-deficient HEK293 cells at 6 and 8 h after release from the G1-S block. The cells were either left untreated or were treated with nocodazole or nocodazole plus sirtinol after release. (F) Mitotic progression of HEK293 H2B-GFP cells treated with the indicated siRNAs was monitored by live-cell microscopy. (G) Duration of mitotic intervals (prophase to metaphase; metaphase) in HEK293 cells targeted with the indicated siRNAs were quantified. **, P < 0.01.
To determine that the ability of cPLA2α to delay mitotic entry in response to mitotic stress was not specific to HEK293 cells, we examined MEFs derived from cPLA2α−/− mice. MI was determined in WT and cPLA2α−/− MEFs over time after treatment with nocodazole. cPLA2α−/− MEFs had a significantly lower MI than WT cells (Fig. 6A). Adenoviral expression of cPLA2α but not LacZ restored the MI in cPLA2α−/− cells. To investigate whether the observed effect of cPLA2α on the G2-to-M transition is SIRT2 dependent, WT and cPLA2α−/− MEFs were infected with retroviruses expressing SIRT2 short hairpin RNA (shRNA) or GFP shRNA (negative control). Knockdown of SIRT2 completely reversed the G2-to-M transition deficit in cPLA2α−/− MEFs (Fig. 6B). Efficiency of knockdown was verified with Western blotting (Fig. 6C).
FIG 6.

Deletion of cPLA2α reduces G2-to-M transition (A) WT and cPLA2α−/− MEFs were infected with Ad-cPLA2α or Ad-LacZ. Cells were treated with nocodazole. Mitotic index values were compared at different time points. (B) Subconfluent WT and cPLA2α−/− MEFs were treated with an SIRT2 shRNA or control (EGFP) shRNA. The mitotic index was quantified after nocodazole treatment. (C) Western blotting shows the efficiency of SIRT2 knockdown in WT and cPLA2α−/− MEFs. ERK was used as a loading control. (D) Flowchart illustrating how the experiment shown in panel E was performed. Subconfluent WT and cPLA2α−/− MEFs were treated with BrdU and nocodazole for 14 h. Medium was exchanged, and cells were allowed to continue through the cell cycle. Cells were harvested at indicated time points (0 to 90 min). Percentages of BrdU+ p-MPM2+ (M cells) and BrdU+ p-MPM2− (non-M cells) were quantified in the G2/M-gated population. (E) The graph in the left panel shows an overlay of the p-MPM2 signal in the BrdU+ population in WT and cPLA2α−/− MEFs after release from the block. Nonstained cells were used as controls. The graph in the right panel shows the percentage of M-phase and non-M-phase cells in WT and cPLA2α−/− MEFs after release from the block. (F) The numbers of mitotic cells in WT (+/+) and cPLA2α−/− (−/−) MEFs were counted by mitotic shake-off every 2 h after nocodazole (Noc) treatment. *, P < 0.05; **, P < 0.01.
Wild-type and cPLA2α−/− MEFs were plated at subconfluence and treated with nocodazole and BrdU for 14 h. The medium was then replaced with fresh medium without nocodazole, and cells were allowed to exit cell cycle arrest. Cells were harvested every 10 min and were analyzed by flow cytometry for BrdU and p-MPM2 content (Fig. 6D). Flow cytometry was performed to quantitate the BrdU+ MPM2+ (M-phase cells) and BrdU+ p-MPM2− (non-M-phase cells) in the G2/M population (Fig. 6E, left panel). At time zero, significantly more WT cells were in mitosis than cPLA2α−/− cells (62% ± 6% versus 34% ± 4%) (Fig. 6E, right panel). These data are consistent with data shown in Fig. 6A. During the first 20 min after removal of nocodazole, the number of M-phase cells in cPLA2α−/− MEFs increased progressively, indicating that this population of cells had been arrested at the G2/M boundary and entered mitosis after removal of nocodazole (Fig. 6E, right panel). At 90 min, there was no significant difference between the BrdU+ p-MPM2+ populations in WT and cPLA2α−/− cells, indicating that, in the absence of cPLA2α, exit from mitosis was unaffected.
Suematsu et al. reported that SIRT2 deacetylates the prometaphase/anaphase checkpoint protein, BubR1. BubR1 deacetylation by SIRT2 did not modify BubR1 stability or duration of prometaphase arrest (35). To exclude the possibility that cPLA2α−/− cells have reduced BubR1 checkpoint activity and enhanced mitotic slippage, WT and cPLA2α−/− MEFs were treated with nocodazole for 8 h, and mitotic cells were counted every 2 h by mitotic shake-off (Fig. 6F). There were fewer mitotic cells in cPLA2α−/− MEFs than in WT MEFs at all time points, indicating that cPLA2α−/− MEFs have a defect in mitotic entry rather than enhanced mitotic slippage.
cPLA2α is essential for SIRT2 phosphorylation during mitosis.
Next, we investigated how cPLA2α suppresses SIRT2 catalytic activity and, hence, its checkpoint functions. SIRT2 contains a Cdk consensus phosphorylation site (X-S*-P-X-K/R-) (X, any amino acid) surrounding S331 (marked with an asterisk) that is conserved among known SIRT2 homologs (36) (Fig. 7A). This site has been shown to be phosphorylated by cyclin A-Cdk2, which inhibits SIRT2 catalytic activity (36). Two SIRT2 phosphomutants were generated: EGFP-SIRT2S331A, a phosphodeficient mutant, and EGFP-SIRT2S331E, a constitutively active phosphomimetic mutant. SIRT2, but not its phosphomutants, was phosphorylated by cyclin A-Cdk2 complex in a kinase assay in vitro, indicating that S331 is the principal site of phosphorylation of SIRT2 by cyclin A-Cdk2 complex (Fig. 7B). Next, we used a phosphospecific antibody to identify the kinetics of SIRT2 phosphorylation on S331 in WT and cPLA2α−/− MEFs that were synchronized at the G1/S boundary by a double-thymidine block and release (Fig. 7C). There was no observable difference in the cell cycle progression of the two groups after release from the block. Phosphorylation of SIRT2 on S331 was examined on the cell lysates at 2-h intervals (Fig. 7D). p-SIRT2 S331 in wild-type MEFs peaked at late G2 phase (8 to 10 h) after release and decreased dramatically at the end of mitosis (12 h). In contrast, SIRT2 phosphorylation at S331 was reduced in mitotic cPLA2α−/− MEFs compared to levels in WT MEFs (Fig. 7D). These data demonstrate that cPLA2α is necessary for SIRT2 phosphorylation in intact cells.
FIG 7.

cPLA2α promotes phosphorylation of SIRT2 at S331 by cyclin A-Cdk2. (A) A conserved Cdk consensus surrounds S331 of SIRT2. Conserved residues are highlighted. P, phosphorylation site. (B) In vitro kinase assay using Flag-tagged SIRT2 constructs purified from HEK293 cells and active cyclin A-Cdk2 (left panel). Coomassie staining shows the expression of different proteins in each reaction. p-SIRT2 band intensities were quantified using ImageJ (right panel). (C) Cell cycle profile over 12 h of WT and cPLA2α−/− MEFs synchronized at the G1/S boundary with a double-thymidine block and release. (D) Proteins from WT and cPLA2α−/− MEFs from each time point of the experiment shown in panel C were assayed by Western blotting for p-SIRT2 S331. ERK and SIRT2 were used as loading controls. (E) HEK293 cells were transfected with vector, EGFP-cPLA2α (full-length, FL), or EGFP-cPLA2αΔN215. EGFP was immunoprecipitated, and the presence of SIRT2, cyclin A, Cdk2, cyclin B1, and Cdk1 was examined in the precipitates. On panels D and E, relative molecular weights in thousands are given on the right and left, respectively. (F) SIRT2 was immunoprecipitated from cell lysates from WT and cPLA2α−/− MEFs, and the presence of cyclin A was examined in the immunoprecipitates. Control IgG was used as a negative control. (G) Coimmunoprecipitation of His-cPLA2α with EGFP-SIRT2S331A and EGFP-SIRT2S331E in HEK293 cells. (H) GST, GST-SIRT2, and GST-SIRT2S331A were incubated with cyclin A-Cdk2 complex in the presence or absence of cPLA2α in an in vitro kinase assay (left panel). p-SIRT2 band intensities were quantified using ImageJ (right panel). (I) Histone H1 was incubated with cyclin A-Cdk2 in the presence or absence of cPLA2α (left panel). Coomassie staining shows the expression of different proteins in each reaction. (Intensities of p-histone H1 bands were quantified by ImageJ (right panel). (J) Colocalization of cyclin A (red) with SIRT2 and cPLA2α (green) in HEK293 cells. Scale bar, 10 μm. Intensity correlation analyses are represented by the color scatter plots of the paired intensities of the red and green channels. **, P < 0.01.
To gain more insight to the mechanism of SIRT2 regulation by cPLA2α, we evaluated whether cPLA2α was associated with the previously described mitotic complex between SIRT2 and cyclin A-Cdk2 (37). HEK293 cells were transfected with an empty vector or EGFP-cPLA2αΔN215 or EGFP-cPLA2α construct, and EGFP was immunoprecipitated. SIRT2, cyclin A, and Cdk2 were detected in precipitates, but we could not detect the presence of cyclin B1 or Cdk1 (Fig. 7E). In another experiment cPLA2α was immunoprecipitated from WT and cPLA2α−/− cells. Similar to results in HEK293 cells, only SIRT2, cyclin A, and Cdk2 were present in the immunoprecipitates (see Fig. S2 in the supplemental material). These data indicate the formation of a molecular complex with the three components present. Deletion of cPLA2α in MEFs impaired the interaction between endogenous SIRT2 and cyclin A (Fig. 7F). This observation suggested that cPLA2α bridges the interaction between SIRT2 and cyclin A-Cdk2. Both SIRT2 phosphomutant proteins interacted with cPLA2α, indicating that S331 does not play an essential role in the physical interaction with cPLA2α (Fig. 7G). Next, we evaluated SIRT2 phosphorylation by cyclin A-Cdk2 complex in vitro in the presence or absence of cPLA2α. Incorporation of 32P into purified GST-SIRT2 by cyclin A-Cdk2 complex was increased in the presence of cPLA2α, while there was no increase in phosphorylation of GST-SIRT2S331A, indicating that cPLA2α promotes the phosphorylation of SIRT2 at S331 by cyclin A-Cdk2 complex (Fig. 7H). In the absence of cPLA2α, phosphorylation of SIRT2 was not increased. GST was used as a negative control. We further investigated whether cPLA2α can modulate the kinase activity of Cdk2 in a kinase assay using histone H1 as the substrate. cPLA2α had no effect on the histone H1 kinase activity of cyclin A-Cdk2 complex in vitro (Fig. 7I). Taken together, these results strongly suggest that cPLA2α stimulates Cdk2-induced SIRT2 phosphorylation. Finally, colocalization of cPLA2α and SIRT2 with cyclin A was examined in HEK293 cells. Both SIRT2 and cPLA2α colocalized with cyclin A on the centrosomes during mitosis (Fig. 7J). Manders' colocalization coefficients indicated a significant degree of colocalization between SIRT2 and cyclin A (0.74 ± 0.16) and between cPLA2α and cyclin (0.70 ± 0.9) (P < 0.01).
SIRT2 phosphorylation at S331 reduces SIRT2 checkpoint activity and its affinity to mitotic spindles.
We hypothesized that S331 phosphorylation is the mechanism by which cPLA2α inhibits SIRT2 checkpoint activity. To test this hypothesis, we monitored the G2-to-M transition in cells expressing SIRT2 or its phosphomutants in the presence or absence of cPLA2α. LLC-pCDNA and LLC-cPLA2α cells were transfected with constructs expressing EGFP, SIRT2-EGFP, or one of the two phosphomutants, SIRT2S331A-EGFP or SIRT2S331E-EGFP. At 48 h posttransfection, cells were treated with nocodazole for 14 additional hours. Using flow cytometry, we analyzed DNA content (propidium iodide) and levels of p-MPM2 and p-H3 in the EGFP-positive (EGFP+) population in each group (Fig. 8A). LLC-pCDNA cells transfected with the S331E mutant had a significantly higher p-MPM2+ population than cells transfected with SIRT2 WT or the S331A mutant, indicating that the phosphomimetic mutant results in less checkpoint activity in these cells (Fig. 8B). LLC-cPLA2α cells transfected with the S331A mutant showed significantly fewer p-MPM2+ cells. This indicates an inhibitory effect of cPLA2α on SIRT2 but not on the SIRT2 S331A mutant, consistent with the conclusion that phosphorylation at S331 is necessary for cPLA2α-mediated inhibition of SIRT2 activity (Fig. 8B). The change in the percentage of p-MPM2+ cells from baseline (EGFP-transfected cells) was quantified in SIRT2-transfected cells (Fig. 8C). We also quantified the p-H3+ population in all treated cells. There was no difference in the sizes of the p-H3+ populations in any of these groups, indicating that the total G2/M populations (4N cells) were equivalent in all groups (Fig. 8D and E).
FIG 8.

cPLA2α-mediated SIRT2 phosphorylation impairs G2-to-M transition checkpoint. (A) Flow chart illustrating how experiments shown in panels B to E were performed. (B and D) LLC-pCDNA and LLC-cPLA2α cells were transfected with EGFP, SIRT2-EGFP, or its two phosphomutants and treated with nocodazole for 14 h. p-MPM2+ and p-H3+ cells were quantified in EGFP+-gated populations. (C and E) Graphs show the changes in percentages of G2/M cells (p-H3+) (C) and M cells (p-MPM2+) (E) in LLC-pCDNA and LLC-cPLA2α cells that were transfected with SIRT2-EGFP or its phosphomutants relative to values for cells transfected with EGFP (n = 3). (F) Western blotting confirmed the expression of SIRT2-EGFP (WT), SIRT2S331A-EGFP, and SIRT2S331E-EGFP transgenes in siSIRT2-treated cells that do not express endogenous SIRT2. (G) Images in the left panel show deconvoluted maximum intensity projections of SIRT2 (green) and Ac-α-tubulin (red) on SIRT2-deficient HEK293 cells transfected with EGFP-SIRT2, EGFP-SIRT2S331A, or EGFP-SIRT2S331E. Relative accumulation of SIRT2 on mitotic spindles and centrosomes was quantified using Image J software (right panel). (H) Images in the left panel show deconvoluted maximum intensity projections of SIRT2 and Ac-α-tubulin on LLC-PK1 cells either mock transfected (control) or transfected with cPLA2α or cPLA2αΔN215. Quantification of the relative accumulation of SIRT2 on mitotic spindles and centrosomes using ImageJ software was performed (right panel). *, P < 0.05; **, P < 0.01.
Phosphorylation of many proteins has been shown to affect their binding capacity (38). We therefore examined whether phosphoacceptor site mutations of SIRT2 display altered binding properties to mitotic structures. HEK293 siSIRT2 cells were transfected with an EGFP-SIRT2, EGFP-SIRT2S331A, or EGFP-SIRT2S331E construct (Fig. 8F). We acquired z stacks through single fixed cells and quantified the relative accumulation of SIRT2 compared to that of Ac-α-tubulin on mitotic structures during early mitosis (prophase and prometaphase) (Fig. 8G, left panel). The intensity of Ac-α-tubulin in cells expressing phosphomutants was normalized to the Ac-α-tubulin signal in SIRT2 WT-transfected cells. Compared to WT SIRT2, the S331E phosphomimetic mutation diminished binding to mitotic spindles and centrosomes, whereas the S331A phosphodeficient mutation significantly enhanced binding. Relative intensities of SIRT2 on mitotic spindles and centrosomes at prophase and prometaphase were quantified by ImageJ software on over 200 cells in each group, as described previously (26, 39) (Fig. 8G, right panel). These results suggest that upon phosphorylation, SIRT2 dissociates from mitotic spindles and centrosomes. Next, we investigated whether interaction of cPLA2α with SIRT2 can affect SIRT2 binding capacity. LLC-PK1 cells overexpressing SIRT2 were transfected with an empty vector (mock), cPLA2α, or cPLA2αΔN215 (nonbinding mutant). SIRT2 recruitment to the mitotic spindles was evaluated by immunostaining (Fig. 8H, left panel). Relative intensities of SIRT2 on mitotic spindles and centrosomes at prophase and prometaphase were quantified by ImageJ software (Fig. 8H, right panel). There was significantly more SIRT2 recruitment to the mitotic spindles in mock-transfected and cPLA2αΔN215-transfected cells than in cPLA2α-transfected cells, indicating that coexpression of cPLA2α reduces SIRT2 recruitment to the mitotic spindles and centrosomes.
Deletion of cPLA2α diminishes SIRT2 phosphorylation and decreases G2-to-M transition in vivo.
The impact of cPLA2α deletion on G2-to-M transition was examined in vivo in a moderate bilateral ischemia-reperfusion injury (IRI) model in mouse kidney. We previously showed that in this injury model, kidney tubular cells undergo extensive proliferation (25). Five WT and four cPLA2α−/− mice underwent 26 min of ischemia. Colchicine (20 μg) was injected intraperitoneally to each mouse at 24 and 48 h after release of the renal pedicle clamps to induce mitotic stress. Kidneys were harvested at 72 h after IRI (Fig. 9A). There was no significant difference in serum creatinine changes at 24 and 72 h after ischemia between the two groups (Fig. 9B). Western blotting confirmed cPLA2α expression in WT kidneys (Fig. 9C). cPLA2α and SIRT2 were coimmunoprecipitated in the IRI kidney lysates (Fig. 9D, lane 4). Of note, the noninjured kidney does not express detectable SIRT2 protein; however, SIRT2 expression is induced in the kidneys after IRI (Fig. 9D, lane 3). Next, to evaluate the number of mitotic cells in the two groups, kidney sections were stained for Ki-67 and the mitosis-specific marker p-MPM2 (Fig. 9E). Immunostaining of kidney sections confirmed expression of KIM-1 in injured tubules in both groups. The percentage of proliferating cells that were mitotic (p-MPM2+ Ki-67+) was calculated in kidney sections from the experiment shown in Fig. 9E). There were significantly more mitotic cells in WT than in cPLA2α−/− kidneys (Fig. 9F). We further quantitated the G2-to-M transition of cells in the two groups by staining the kidneys with Ki-67 antibody to identify all proliferating cells (Fig. 9G) and with p-H3 antibody to identify the G2/M population (Fig. 9H). The p-H3 staining pattern is a marker to identify G2 and M cells, as demonstrated previously (25) and as shown in Fig. 4A. Although there were no significant differences in the ratio of p-H3+/Ki-67+ cells in the two groups (Fig. 9I), there was a significantly higher number of M cells and a lower number of G2 cells in WT than in cPLA2α−/− kidneys (Fig. 9J). We confirmed the immunostaining results by Western blotting of tissue lysates with p-MPM2 and p-H3 antibodies (Fig. 9K). We quantified the ratio of p-MPM2 and p-H3 band densities normalized to extracellular signal-regulated kinase (ERK) loading controls using ImageJ software. There was a significantly higher p-MPM2+/p-H3+ ratio in WT than in cPLA2α−/− kidneys, indicating that more proliferating cells reside in mitosis in WT kidneys than in cPLA2α−/− kidneys (Fig. 9L). Finally, we examined the levels of p-SIRT2 S331 in tissue lysates of WT and cPLA2α−/− kidneys (Fig. 9M).There were significantly lower levels of p-SIRT2 S331 in cPLA2α−/− kidney lysates than in WT kidneys (Fig. 9N). Collectively, these data confirm in kidney tissue that cPLA2α is a regulator of SIRT2 phosphorylation and of the G2-to-M transition of the cell cycle.
FIG 9.

cPLA2α promotes SIRT2 phosphorylation and G2-to-M transition in vivo. (A) Design of the G2-to-M arrest induction in mouse kidney. (B) Changes of serum creatinine (Sr Cr) over time in a moderate IRI model (WT, n = 5; cPLA2α−/−, n = 4). (C) Western blotting of cPLA2α on kidney lysates of WT and cPLA2α−/− mice. ERK was used as a loading control. (D) Co-IP of SIRT2 and cPLA2α in IRI kidneys from WT mice using anti-cPLA2α antibody. Kidney lysates from cPLA2α−/− mice and control IgG were used as negative controls. (E) Immunohistochemistry with antibodies to p-MPM2, Ki-67, and KIM-1 on kidney sections from WT and cPLA2α−/− mice treated with colchicine for 48 h. Scale bar, 20 μm. (F) The percentages of p-MPM2+/Ki-67+ cells were calculated in 10 fields, at a magnification of ×400, of each kidney from the experiment shown in panel E (WT, n = 5; cPLA2α−/−, n = 4). **, P < 0.01, compared to the value of the WT control. (G) Immunostaining with Ki-67 antibody as well as nuclear staining with DAPI on kidney section from WT and cPLA2α−/− mice treated with colchicine. Scale bar, 20 μm. (H) Immunostaining with antibodies to p-H3 and Na+/K+/ATPase as well as nuclear staining with DAPI on kidney section from WT and cPLA2α−/− mice treated with colchicine. Arrowheads and arrows show the G2-phase- and M-phase-arrested cells, respectively. Scale bar, 5 μm. (I) Percentage of the proliferating tubular cells (Ki-67+) in the G2/M phase (p-H3+) of the cell cycle in 10 fields, at a magnification of ×400, of each kidney from the experiment shown in panel H (WT, n = 5; cPLA2α−/−, n = 4). (J) Percentage of cells residing in G2 versus M phases of the cell cycle based on the p-H3 staining pattern observed in tissue sections in the experiment shown in panel H) (WT, n = 5; cPLA2α−/−, n = 4). (K) Western blot analysis of p-MPM2 and p-H3 on kidney lysates from WT and cPLA2α−/− mice treated with colchicine. (L) Ratio of the band intensities of p-MPM2 to p-H3, normalized to ERK and quantified by ImageJ software. **, P < 0.01 compared to the WT control values. (M) Western blot analysis of p-SIRT2 S331 in WT and cPLA2α−/− kidney lysates. SIRT2 and ERK were used as loading controls. (N) Ratio of the p-SIRT2 S331 band intensities in WT and cPLA2α−/−kidneys. **, P < 0.01, compared to WT control values.
DISCUSSION
Although historically the focus of cPLA2α research has been on its role in inflammation, some studies have suggested a role for cPLA2α in cell proliferation and tumorigenesis (17, 40, 41). Here, we identified cPLA2α as a regulator of the G2-to-M transition of the cell cycle through promotion of SIRT2 phosphorylation at S331. Phosphorylation of SIRT2 at this site was previously shown to suppress its catalytic activity (36); however, the role of this phosphorylation in the G2-to-M transition was unknown. By utilizing SIRT2 phosphomutants, we found that S331 phosphorylation is the determining factor for inhibition of SIRT2 G2/M checkpoint activity. In addition, we show that SIRT2 phosphorylation at S331 also abolishes its localization to both mitotic spindles and centrosomes (9, 37). Interestingly, these data also suggest that SIRT2 localization to the mitotic structures can be used as a marker for SIRT2 activity.
cPLA2α promotes SIRT2 phosphorylation through cyclin A-Cdk2 binding (Fig. 10). cPLA2α does not seem to act as a general activator of Cdk2 since in vitro kinase assays revealed that Cdk2 could phosphorylate histone H1 independently of cPLA2α expression. In the absence of cPLA2α, however, SIRT2 failed to associate with cyclin A-Cdk2, indicating that cPLA2α may act as a bridge in this ternary complex. Interaction with cPLA2α may bring SIRT2 and cyclin A-Cdk2 in close proximity or modify the structure of SIRT2 and expose the phosphorylation site so that Cdk2 has preferential access to S331. It is also possible that other proteins are involved in the complex.
FIG 10.
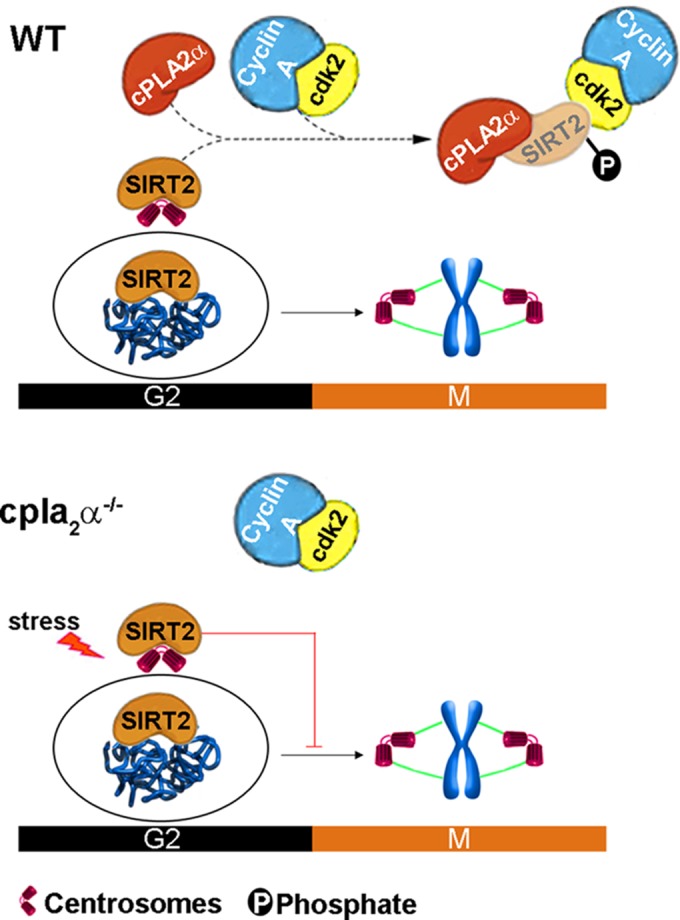
Model of the regulation of the G2-to-M transition by cPLA2α. In wild-type (WT) cells, cPLA2α directly binds to SIRT2 and promotes phosphorylation of SIRT2 at S331 by cyclin A-Cdk2 complex. This phosphorylation inhibits SIRT2 catalytic activity and decreases enrichment of SIRT2 at the mitotic spindles and centrosomes. In the absence of cPLA2α, nonphosphorylated SIRT2 is localized to the mitotic structures and arrests cell cycle progression at the G2-to-M transition under mitotic stress.
Our study also reveals a crucial role for cyclin A-Cdk2 in mitotic entry. Cyclin A-Cdk2 complex can associate with centrosomes, and its activity increases during G2 (42). Cyclin A has previously been shown to play a more pronounced role than cyclin B during mitotic entry (42, 43). Our study identifies SIRT2 as one of the substrates of cyclin A-Cdk2 during the G2-to-M transition. Thus, SIRT2 directly regulates mitotic entry. Moreover, inhibition of SIRT2 enzymatic activity by cPLA2α resulted in higher levels of cellular Ac-H4K16. Ac-H4K16 levels have been linked to changes in the length of the G1 and S phases of the cell cycle but not to the G2-to-M transition (10, 44). SIRT2-mediated G2/M arrest might be due to deacetylation of another, yet to be identified, substrate.
SIRT2 is a tumor suppressor, and its absence leads to multiple tumor formations, possibly due to lack of acetylation of APC/C components (14). We speculate that effects of cPLA2α on tumorigenesis previously described by us and other investigatory may be explained mechanistically via its effects as a negative regulator of SIRT2 deacetylase activity (45). It is plausible that cPLA2α overexpression predisposes tissues to tumor formation. In support of this hypothesis, elevated cPLA2α levels have been reported in human carcinomas (17, 18, 46, 47). In the same context, depletion of cPLA2α, leading to enhanced SIRT2 activity, might inhibit tumor formation or growth. Indeed, we previously showed that deletion of cPLA2α resulted in fewer and smaller tumors in APCMin mice (19, 20). Aneuploidy is a significant feature of sporadic colorectal cancer, and the majority of such cancers carry APC mutations resulting in truncated APC proteins lacking the C terminus (48). It was shown that the C terminus of APC binds microtubules and stimulates polymerization of tubulin in vitro and in vivo (49, 50). The C terminus of APC also contains a binding site for the end-binding protein EB1, which closely associates with the centromere, mitotic spindle, and distal (plus) tips of microtubules at all stages of the cell cycle (51). The reduction of tumors in APCMin/+ cPLA2α−/− mice could be explained by a loss of cPLA2α-SIRT2 interaction and subsequent SIRT2 hyperactivation which blocks mitotic entry and reduces the number of aneuploid cells (11). Strategies to modulate cPLA2α might afford therapeutic benefit; thus, future work that tests the importance of this interaction in genome stability and tumorigenesis is warranted. Since cPLA2α knockout mice are largely normal, reduction or inhibition of cPLA2α may not have major side effects in the unstressed situation.
The effect of cPLA2α on SIRT2 may exert a protective effect on kidney fibrosis by inducing the G2-to-M transition. We along with others have reported that the percentage of the G2-arrested cells, marked with a characteristic punctuate p-H3 staining, positively correlates with the extent of kidney fibrosis, and agents which reduce this arrest are antifibrotic (25, 52). cPLA2α, by inducing profibrogenic G2-arrested cells to enter mitosis, may decrease the number of G2-arrested cells and may therefore reduce kidney fibrosis. This assumes, however, that entry into G2 is not altered by the effect of cPLA2α on the other components of the cell cycle. Our results provide a crucial proof of principle that peptides designed to interact with SIRT2194–224 or small-molecule inhibitors of SIRT2 might have a potential application in targeted antifibrotic therapy.
In summary, we have discovered an unexpected pathway that operates at the G2-to-M transition involving the checkpoint function of SIRT2. Sirtuins have received considerable attention because of their role in aging (53), neuroprotection (54), and tumorigenesis (14). This effect of cPLA2α to antagonize SIRT2 activity and to enhance mitotic entry and chromosomal instability in cells undergoing stress may be further exploited to better understand the important link between cPLA2α and tumorigenesis and between inflammation and the age-related disorders and fibrosis in which SIRT2 and G2/M arrest have been implicated.
Supplementary Material
ACKNOWLEDGMENTS
We thank Roger Brent, formerly at the Massachusetts General Hospital, for pEG202, pSH18-34, pJK101, and pRFHM1 plasmids and James Clark for pMT2-cPLA2α plasmid.
S.M.N., J.V.S, A.M.S, and J.V.B designed the experiments. S.M.N. performed experiments and collected and analyzed data. T.F performed the yeast two-hybrid screen and analyzed the data. S.M.N. and J.V.B wrote the manuscript. All the authors discussed the results and commented on the manuscript. We have read and approved the manuscript.
We have no conflicts of interest to report.
This work was supported by U.S. National Institutes of Health grants DK05474, DKD072381, and DK39773 to J.V.B.
Footnotes
Supplemental material for this article may be found at http://dx.doi.org/10.1128/MCB.00184-15.
REFERENCES
- 1.Chin CF, Yeong FM. 2010. Safeguarding entry into mitosis: the antephase checkpoint. Mol Cell Biol 30:22–32. doi: 10.1128/MCB.00687-09. [DOI] [PMC free article] [PubMed] [Google Scholar]
- 2.Elledge SJ. 1998. Mitotic arrest: Mad2 prevents sleepy from waking up the APC. Science 279:999–1000. doi: 10.1126/science.279.5353.999. [DOI] [PubMed] [Google Scholar]
- 3.Lindqvist A, Rodriguez-Bravo V, Medema RH. 2009. The decision to enter mitosis: feedback and redundancy in the mitotic entry network. J Cell Biol 185:193–202. doi: 10.1083/jcb.200812045. [DOI] [PMC free article] [PubMed] [Google Scholar]
- 4.Sarkar A, Eroglu S, Poirier MG, Gupta P, Nemani A, Marko JF. 2002. Dynamics of chromosome compaction during mitosis. Exp Cell Res 277:48–56. doi: 10.1006/excr.2002.5507. [DOI] [PubMed] [Google Scholar]
- 5.Rieder CL, Cole R. 2000. Microscopy-induced radiation damage, microtubules, and progression through the terminal stage of G2 (prophase) in vertebrate somatic cells. Cold Spring Harbor Symp Quant Biol 65:369–376. doi: 10.1101/sqb.2000.65.369. [DOI] [PubMed] [Google Scholar]
- 6.McIntosh JR, Koonce MP. 1989. Mitosis. Science 246:622–628. doi: 10.1126/science.2683078. [DOI] [PubMed] [Google Scholar]
- 7.Jordan MA, Wilson L. 1998. Microtubules and actin filaments: dynamic targets for cancer chemotherapy. Curr Opin Cell Biol 10:123–130. doi: 10.1016/S0955-0674(98)80095-1. [DOI] [PubMed] [Google Scholar]
- 8.Scolnick DM, Halazonetis TD. 2000. Chfr defines a mitotic stress checkpoint that delays entry into metaphase. Nature 406:430–435. doi: 10.1038/35019108. [DOI] [PubMed] [Google Scholar]
- 9.North BJ, Verdin E. 2007. Interphase nucleo-cytoplasmic shuttling and localization of SIRT2 during mitosis. PLoS One 2:e784. doi: 10.1371/journal.pone.0000784. [DOI] [PMC free article] [PubMed] [Google Scholar]
- 10.Vaquero A, Sternglanz R, Reinberg D. 2007. NAD+-dependent deacetylation of H4 lysine 16 by class III HDACs. Oncogene 26:5505–5520. doi: 10.1038/sj.onc.1210617. [DOI] [PubMed] [Google Scholar]
- 11.Inoue T, Hiratsuka M, Osaki M, Yamada H, Kishimoto I, Yamaguchi S, Nakano S, Katoh M, Ito H, Oshimura M. 2007. SIRT2, a tubulin deacetylase, acts to block the entry to chromosome condensation in response to mitotic stress. Oncogene 26:945–957. doi: 10.1038/sj.onc.1209857. [DOI] [PubMed] [Google Scholar]
- 12.Inoue T, Nakayama Y, Yamada H, Li YC, Yamaguchi S, Osaki M, Kurimasa A, Hiratsuka M, Katoh M, Oshimura M. 2009. SIRT2 downregulation confers resistance to microtubule inhibitors by prolonging chronic mitotic arrest. Cell Cycle 8:1279–1291. doi: 10.4161/cc.8.8.8245. [DOI] [PubMed] [Google Scholar]
- 13.Inoue T, Hiratsuka M, Osaki M, Oshimura M. 2007. The molecular biology of mammalian SIRT proteins: SIRT2 in cell cycle regulation. Cell Cycle 6:1011–1018. doi: 10.4161/cc.6.9.4219. [DOI] [PubMed] [Google Scholar]
- 14.Kim HS, Vassilopoulos A, Wang RH, Lahusen T, Xiao Z, Xu X, Li C, Veenstra TD, Li B, Yu H, Ji J, Wang XW, Park SH, Cha YI, Gius D, Deng CX. 2011. SIRT2 maintains genome integrity and suppresses tumorigenesis through regulating APC/C activity. Cancer Cell 20:487–499. doi: 10.1016/j.ccr.2011.09.004. [DOI] [PMC free article] [PubMed] [Google Scholar]
- 15.Burke JE, Dennis EA. 2009. Phospholipase A2 structure/function, mechanism, and signaling. J Lipid Res 50(Suppl):S237–S242. doi: 10.1194/jlr.R800033-JLR200. [DOI] [PMC free article] [PubMed] [Google Scholar]
- 16.Anderson KM, Roshak A, Winkler JD, McCord M, Marshall LA. 1997. Cytosolic 85-kDa phospholipase A2-mediated release of arachidonic acid is critical for proliferation of vascular smooth muscle cells. J Biol Chem 272:30504–30511. doi: 10.1074/jbc.272.48.30504. [DOI] [PubMed] [Google Scholar]
- 17.Lim SC, Cho H, Lee TB, Choi CH, Min YD, Kim SS, Kim KJ. 2010. Impacts of cytosolic phospholipase A2, 15-prostaglandin dehydrogenase, and cyclooxygenase-2 expressions on tumor progression in colorectal cancer. Yonsei Med J 51:692–699. doi: 10.3349/ymj.2010.51.5.692. [DOI] [PMC free article] [PubMed] [Google Scholar]
- 18.Patel MI, Singh J, Niknami M, Kurek C, Yao M, Lu S, Maclean F, King NJ, Gelb MH, Scott KF, Russell PJ, Boulas J, Dong Q. 2008. Cytosolic phospholipase A2-alpha: a potential therapeutic target for prostate cancer. Clin Cancer Res 14:8070–8079. doi: 10.1158/1078-0432.CCR-08-0566. [DOI] [PMC free article] [PubMed] [Google Scholar]
- 19.Umeno J, Matsumoto T, Esaki M, Kukita Y, Tahira T, Yanaru-Fujisawa R, Nakamura S, Arima H, Hirahashi M, Hayashi K, Iida M. 2010. Impact of group IVA cytosolic phospholipase A2 gene polymorphisms on phenotypic features of patients with familial adenomatous polyposis. Int J Colorectal Dis 25:293–301. doi: 10.1007/s00384-009-0808-x. [DOI] [PubMed] [Google Scholar]
- 20.Hong KH, Bonventre JC, O'Leary E, Bonventre JV, Lander E. 2001. Deletion of cytosolic phospholipase A2 suppresses ApcMin-induced tumorigenesis. Proc Natl Acad Sci U S A 98:3935–3939. doi: 10.1073/pnas.051635898. [DOI] [PMC free article] [PubMed] [Google Scholar]
- 21.Sheridan AM, Force T, Yoon HJ, O'Leary E, Choukroun G, Taheri MR, Bonventre JV. 2001. PLIP, a novel splice variant of Tip60, interacts with group IV cytosolic phospholipase A2, induces apoptosis, and potentiates prostaglandin production. Mol Cell Biol 21:4470–4481. doi: 10.1128/MCB.21.14.4470-4481.2001. [DOI] [PMC free article] [PubMed] [Google Scholar]
- 22.Sapirstein A, Spech RA, Witzgall R, Bonventre JV. 1996. Cytosolic phospholipase A2 (PLA2), but not secretory PLA2, potentiates hydrogen peroxide cytotoxicity in kidney epithelial cells. J Biol Chem 271:21505–21513. doi: 10.1074/jbc.271.35.21505. [DOI] [PubMed] [Google Scholar]
- 23.Bonventre JV, Huang Z, Taheri MR, O'Leary E, Li E, Moskowitz MA, Sapirstein A. 1997. Reduced fertility and postischaemic brain injury in mice deficient in cytosolic phospholipase A2. Nature 390:622–625. doi: 10.1038/37635. [DOI] [PubMed] [Google Scholar]
- 24.Park KM, Byun JY, Kramers C, Kim JI, Huang PL, Bonventre JV. 2003. Inducible nitric-oxide synthase is an important contributor to prolonged protective effects of ischemic preconditioning in the mouse kidney. J Biol Chem 278:27256–27266. doi: 10.1074/jbc.M301778200. [DOI] [PubMed] [Google Scholar]
- 25.Yang L, Besschetnova TY, Brooks CR, Shah JV, Bonventre JV. 2010. Epithelial cell cycle arrest in G2/M mediates kidney fibrosis after injury. Nat Med 16:535–543. doi: 10.1038/nm.2144. [DOI] [PMC free article] [PubMed] [Google Scholar]
- 26.Akopyan K, Silva Cascales H, Hukasova E, Saurin AT, Mullers E, Jaiswal H, Hollman DA, Kops GJ, Medema RH, Lindqvist A. 2014. Assessing kinetics from fixed cells reveals activation of the mitotic entry network at the S/G2 transition. Mol Cell 53:843–853. doi: 10.1016/j.molcel.2014.01.031. [DOI] [PubMed] [Google Scholar]
- 27.Witzgall R, O'Leary E, Gessner R, Ouellette AJ, Bonventre JV. 1993. Kid-1, a putative renal transcription factor: regulation during ontogeny, and in response to ischemia and toxic injury. Mol Cell Biol 13:1933–1942. [DOI] [PMC free article] [PubMed] [Google Scholar]
- 28.Matsushita N, Takami Y, Kimura M, Tachiiri S, Ishiai M, Nakayama T, Takata M. 2005. Role of NAD-dependent deacetylases SIRT1 and SIRT2 in radiation and cisplatin-induced cell death in vertebrate cells. Genes Cells 10:321–332. doi: 10.1111/j.1365-2443.2005.00836.x. [DOI] [PubMed] [Google Scholar]
- 29.Finnin MS, Donigian JR, Pavletich NP. 2001. Structure of the histone deacetylase SIRT2. Nat Struct Biol 8:621–625. doi: 10.1038/89668. [DOI] [PubMed] [Google Scholar]
- 30.Logan IR, Sapountzi V, Gaughan L, Neal DE, Robson CN. 2004. Control of human PIRH2 protein stability: involvement of TIP60 and the proteosome. J Biol Chem 279:11696–11704. doi: 10.1074/jbc.M312712200. [DOI] [PubMed] [Google Scholar]
- 31.Vassilev LT. 2006. Cell cycle synchronization at the G2/M phase border by reversible inhibition of CDK1. Cell Cycle 5:2555–2556. doi: 10.4161/cc.5.22.3463. [DOI] [PubMed] [Google Scholar]
- 32.North BJ, Marshall BL, Borra MT, Denu JM, Verdin E. 2003. The human Sir2 ortholog, SIRT2, is an NAD+-dependent tubulin deacetylase. Mol Cell 11:437–444. doi: 10.1016/S1097-2765(03)00038-8. [DOI] [PubMed] [Google Scholar]
- 33.Seno K, Okuno T, Nishi K, Murakami Y, Yamada K, Nakamoto S, Ono T. 2001. Pyrrolidine inhibitors of human cytosolic phospholipase A2. Part 2: synthesis of potent and crystallized 4-triphenylmethylthio derivative “pyrrophenone”. Bioorg Med Chem Lett 11:587–590. [DOI] [PubMed] [Google Scholar]
- 34.Zimmerman W, Sparks CA, Doxsey SJ. 1999. Amorphous no longer: the centrosome comes into focus. Curr Opin Cell Biol 11:122–128. doi: 10.1016/S0955-0674(99)80015-5. [DOI] [PubMed] [Google Scholar]
- 35.Suematsu T, Li Y, Kojima H, Nakajima K, Oshimura M, Inoue T. 2014. Deacetylation of the mitotic checkpoint protein BubR1 at lysine 250 by SIRT2 and subsequent effects on BubR1 degradation during the prometaphase/anaphase transition. Biochem Biophys Res Commun 453:588–594. doi: 10.1016/j.bbrc.2014.09.128. [DOI] [PubMed] [Google Scholar]
- 36.North BJ, Verdin E. 2007. Mitotic regulation of SIRT2 by cyclin-dependent kinase 1-dependent phosphorylation. J Biol Chem 282:19546–19555. doi: 10.1074/jbc.M702990200. [DOI] [PubMed] [Google Scholar]
- 37.Pandithage R, Lilischkis R, Harting K, Wolf A, Jedamzik B, Luscher-Firzlaff J, Vervoorts J, Lasonder E, Kremmer E, Knoll B, Luscher B. 2008. The regulation of SIRT2 function by cyclin-dependent kinases affects cell motility. J Cell Biol 180:915–929. doi: 10.1083/jcb.200707126. [DOI] [PMC free article] [PubMed] [Google Scholar]
- 38.Nishi H, Hashimoto K, Panchenko AR. 2011. Phosphorylation in protein-protein binding: effect on stability and function. Structure 19:1807–1815. doi: 10.1016/j.str.2011.09.021. [DOI] [PMC free article] [PubMed] [Google Scholar]
- 39.Kang YH, Park JE, Yu LR, Soung NK, Yun SM, Bang JK, Seong YS, Yu H, Garfield S, Veenstra TD, Lee KS. 2006. Self-regulated Plk1 recruitment to kinetochores by the Plk1-PBIP1 interaction is critical for proper chromosome segregation. Mol Cell 24:409–422. doi: 10.1016/j.molcel.2006.10.016. [DOI] [PubMed] [Google Scholar]
- 40.van Rossum GS, Bijvelt JJ, van den Bosch H, Verkleij AJ, Boonstra J. 2002. Cytosolic phospholipase A2 and lipoxygenase are involved in cell cycle progression in neuroblastoma cells. Cell Mol Life Sci 59:181–188. doi: 10.1007/s00018-002-8414-x. [DOI] [PMC free article] [PubMed] [Google Scholar]
- 41.Boonstra J, van Rossum GS. 2003. The role of cytosolic phospholipase A2 in cell cycle progression. Prog Cell Cycle Res 5:181–190. [PubMed] [Google Scholar]
- 42.De Boer L, Oakes V, Beamish H, Giles N, Stevens F, Somodevilla-Torres M, Desouza C, Gabrielli B. 2008. Cyclin A/cdk2 coordinates centrosomal and nuclear mitotic events. Oncogene 27:4261–4268. doi: 10.1038/onc.2008.74. [DOI] [PubMed] [Google Scholar]
- 43.Gong D, Pomerening JR, Myers JW, Gustavsson C, Jones JT, Hahn AT, Meyer T, Ferrell JE Jr. 2007. Cyclin A2 regulates nuclear-envelope breakdown and the nuclear accumulation of cyclin B1. Curr Biol 17:85–91. doi: 10.1016/j.cub.2006.11.066. [DOI] [PMC free article] [PubMed] [Google Scholar]
- 44.Vaquero A, Scher MB, Lee DH, Sutton A, Cheng HL, Alt FW, Serrano L, Sternglanz R, Reinberg D. 2006. SirT2 is a histone deacetylase with preference for histone H4 Lys 16 during mitosis. Genes Dev 20:1256–1261. doi: 10.1101/gad.1412706. [DOI] [PMC free article] [PubMed] [Google Scholar]
- 45.Nigg EA. 2002. Centrosome aberrations: cause or consequence of cancer progression? Nat Rev Cancer 2:815–825. doi: 10.1038/nrc924. [DOI] [PubMed] [Google Scholar]
- 46.Sundarraj S, Kannan S, Thangam R, Gunasekaran P. 2012. Effects of the inhibition of cytosolic phospholipase A2α in non-small cell lung cancer cells. J Cancer Res Clin Oncol 138:827–835. doi: 10.1007/s00432-012-1157-7. [DOI] [PMC free article] [PubMed] [Google Scholar]
- 47.Meyer AM, Dwyer-Nield LD, Hurteau GJ, Keith RL, O'Leary E, You M, Bonventre JV, Nemenoff RA, Malkinson AM. 2004. Decreased lung tumorigenesis in mice genetically deficient in cytosolic phospholipase A2. Carcinogenesis 25:1517–1524. doi: 10.1093/carcin/bgh150. [DOI] [PubMed] [Google Scholar]
- 48.Miyoshi Y, Nagase H, Ando H, Horii A, Ichii S, Nakatsuru S, Aoki T, Miki Y, Mori T, Nakamura Y. 1992. Somatic mutations of the APC gene in colorectal tumors: mutation cluster region in the APC gene. Hum Mol Genet 1:229–233. doi: 10.1093/hmg/1.4.229. [DOI] [PubMed] [Google Scholar]
- 49.Munemitsu S, Souza B, Muller O, Albert I, Rubinfeld B, Polakis P. 1994. The APC gene product associates with microtubules in vivo and promotes their assembly in vitro. Cancer Res 54:3676–3681. [PubMed] [Google Scholar]
- 50.Mimori-Kiyosue Y, Shiina N, Tsukita S. 2000. Adenomatous polyposis coli (APC) protein moves along microtubules and concentrates at their growing ends in epithelial cells. J Cell Biol 148:505–518. doi: 10.1083/jcb.148.3.505. [DOI] [PMC free article] [PubMed] [Google Scholar]
- 51.Su LK, Burrell M, Hill DE, Gyuris J, Brent R, Wiltshire R, Trent J, Vogelstein B, Kinzler KW. 1995. APC binds to the novel protein EB1. Cancer Res 55:2972–2977. [PubMed] [Google Scholar]
- 52.Lovisa S, LeBleu VS, Tampe B, Sugimoto H, Vadnagara K, Carstens JL, Wu CC, Hagos Y, Burckhardt BC, Pentcheva-Hoang T, Nischal H, Allison JP, Zeisberg M, Kalluri R. 3 August 2015. Epithelial-to-mesenchymal transition induces cell cycle arrest and parenchymal damage in renal fibrosis. Nat Med doi: 10.1038/nm.3902. [DOI] [PMC free article] [PubMed] [Google Scholar]
- 53.North BJ, Rosenberg MA, Jeganathan KB, Hafner AV, Michan S, Dai J, Baker DJ, Cen Y, Wu LE, Sauve AA, van Deursen JM, Rosenzweig A, Sinclair DA. 2014. SIRT2 induces the checkpoint kinase BubR1 to increase lifespan. EMBO J 33:1438–1453. doi: 10.15252/embj.201386907. [DOI] [PMC free article] [PubMed] [Google Scholar]
- 54.Luthi-Carter R, Taylor DM, Pallos J, Lambert E, Amore A, Parker A, Moffitt H, Smith DL, Runne H, Gokce O, Kuhn A, Xiang Z, Maxwell MM, Reeves SA, Bates GP, Neri C, Thompson LM, Marsh JL, Kazantsev AG. 2010. SIRT2 inhibition achieves neuroprotection by decreasing sterol biosynthesis. Proc Natl Acad Sci U S A 107:7927–7932. doi: 10.1073/pnas.1002924107. [DOI] [PMC free article] [PubMed] [Google Scholar]
Associated Data
This section collects any data citations, data availability statements, or supplementary materials included in this article.