. 2015 Aug 19;4:e07597. doi: 10.7554/eLife.07597

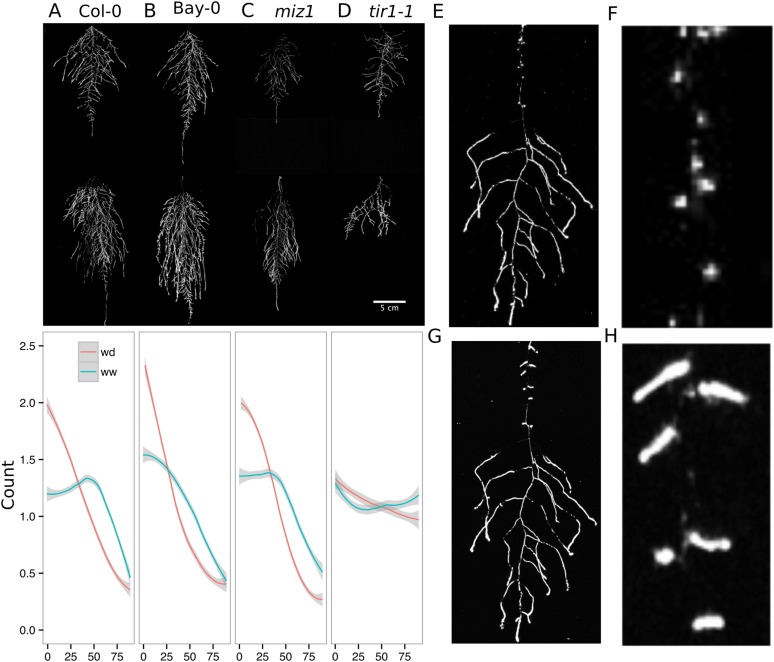
Figure 6. Study of effect of water deficit on root system architecture.

(AD) Root systems 22 DAS and exposed to water deficit 13 DAS onwards (n = 8-9 plants). Sample images of WW (upper panels) and WD (lower panels) root systems treated from 13 DAS and directionality (line graphs to left of images) for (A) Col-0 (B) Bay-0 (C) miz1 and (D) tir1-1. (E) Root system of a 22 DAS plant exposed to water deficit from 9 DAS onwards with magnified view of lateral root primordia (F). (G) The same root as in (E) 24 hr after re-watering and magnified view of lateral roots (H). Kolmogorov–Smirnov test at p < 0.001 showed significant differences in directionality distributions between the WW and WD conditions for all genotypes except miz1. A local polynomial regression fitting with 95% confidence interval (gray) was used to represent the directionality distribution curve. 0° is the direction of the gravity vector.

DOI: http://dx.doi.org/10.7554/eLife.07597.037

Figure 6—source data 1. Directionality values of Bay-0, Col-0, miz1, tir1-1 grown under WW, WD and high and control temperature conditions.
elife07597s015.csv (807.2KB, csv)
DOI: 10.7554/eLife.07597.038
Figure 6—source data 2. Directionality, root system architecture traits and shoot area values of Col-0 plants grown under different phosphorus concentrations.
elife07597s016.xlsx (152.8KB, xlsx)
DOI: 10.7554/eLife.07597.039
Figure 6—source data 3. Directionality values of Col-0 and phot1/2 plants grown with the root system in the dark or exposed to light in the top third of the rhizotron.
elife07597s017.csv (287.3KB, csv)
DOI: 10.7554/eLife.07597.040
Figure 6—source data 4. Directionality values at different depths of the rhizotron for Col-0 plants exposed to light in the top third of the rhizotron.
elife07597s018.csv (286.7KB, csv)
DOI: 10.7554/eLife.07597.041
Figure 6—source data 5. Relative water content of leaves from plants grown under WW and WD conditions and high or control temperatures.
elife07597s019.csv (922B, csv)
DOI: 10.7554/eLife.07597.042

Figure 6.

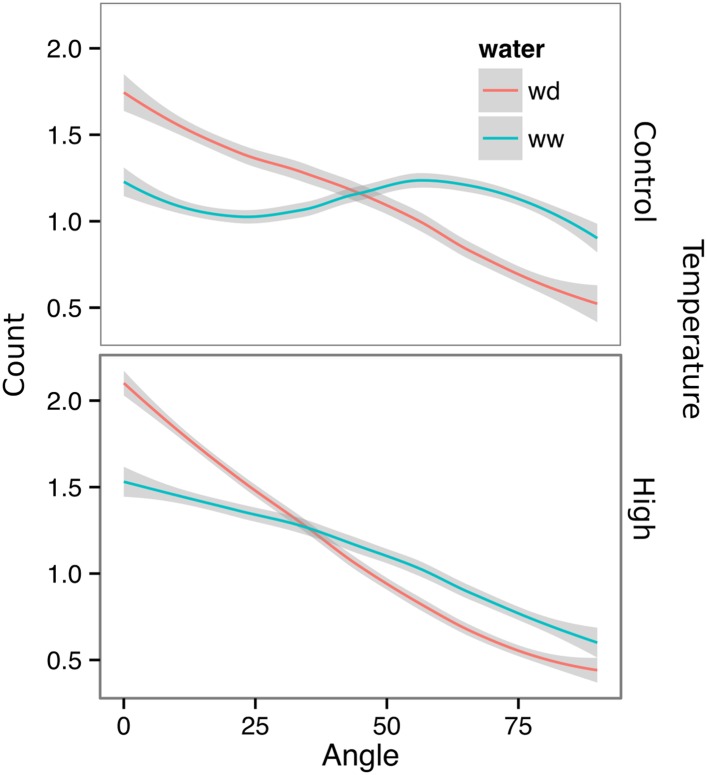
Figure 6—figure supplement 1. Directionality analysis of roots of plants transferred to WD conditions after 9 DAS and kept 22°C (control temperature) or 29°C (high temperature) until 22 DAS.

Figure 6—figure supplement 1.

0° is the direction of the gravity vector. Kolmogorov-Smirnov test showed significant differences (p < 0.001) in the directionality distributions between WW and WD for both control and high temperature treatments. A Local Polynomial Regression Fitting with 95% confidence interval (grey) was used to represent the directionality distribution curve.
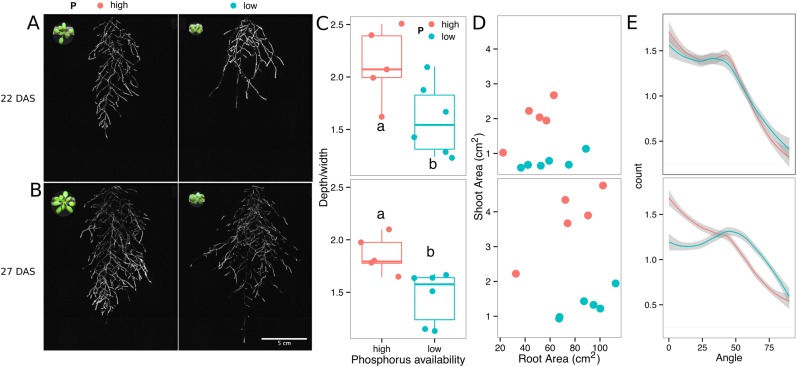
Figure 6—figure supplement 2. Phosphorus deficiency response of root systems.

Figure 6—figure supplement 2.

Shoot and root systems of ProUBQ10:LUC2o Col-0 plants growing in soil supplemented with 1 ml of 100 μM P-Alumina (left) and 0-P-Alumina (right) 22 (A) or 27 (B) DAS (n = 5-6 plants). (C) Root depth/width ratio of 22 (top) and 27 (bottom) DAS plants. (D) Scatter-plot showing relationship between root and shoot system area at 22 (top) and 27 (bottom) DAS. (E) Root directionality distribution in plants 22 (top) and 27 (bottom) DAS. ANOVA analysis at p < 0.01 was used to compare depth/width ratios in P treatments. Kolmogorov–Smirnov test at p < 0.001 was used to compare directionality distributions between the different treatments. Distributions were significantly different at 27 DAS but not at 22 DAS. A local polynomial regression fitting with 95% confidence interval (gray) was used to represent the directionality distribution curve. 0° is the direction of the gravity vector.
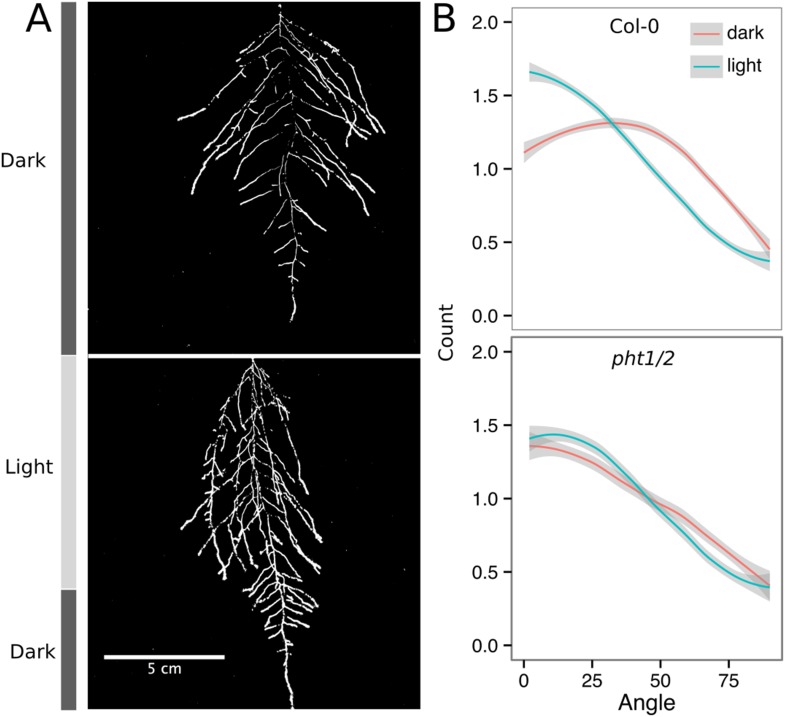
Figure 6—figure supplement 3. Effect of light on root directionality.

Figure 6—figure supplement 3.

(A) Col-0 root systems shielded (top) or light exposed (bottom). After 9 DAS, the top third of the rhizotron was exposed to light (indicated on the side with a light gray bar) and plants were imaged at 20 DAS. (B) Directionality analysis of root systems shielded (red) or exposed (green) to light for Col-0 (top panel) or phot1/2 double mutant (bottom panel) (n = 4-6 plants). Between four and six plants were analyzed per treatment. ANOVA analysis at p < 0.01 was used to compare depth/width ratios in P treatments. Kolmogorov–Smirnov test at p < 0.001 showed significant differences in the directionality distributions between dark and light exposed Col-0 plants but not photo/2. A local polynomial regression fitting with 95% confidence interval (gray) was used to represent the directionality distribution curve. (0° is the direction of the gravity vector.)
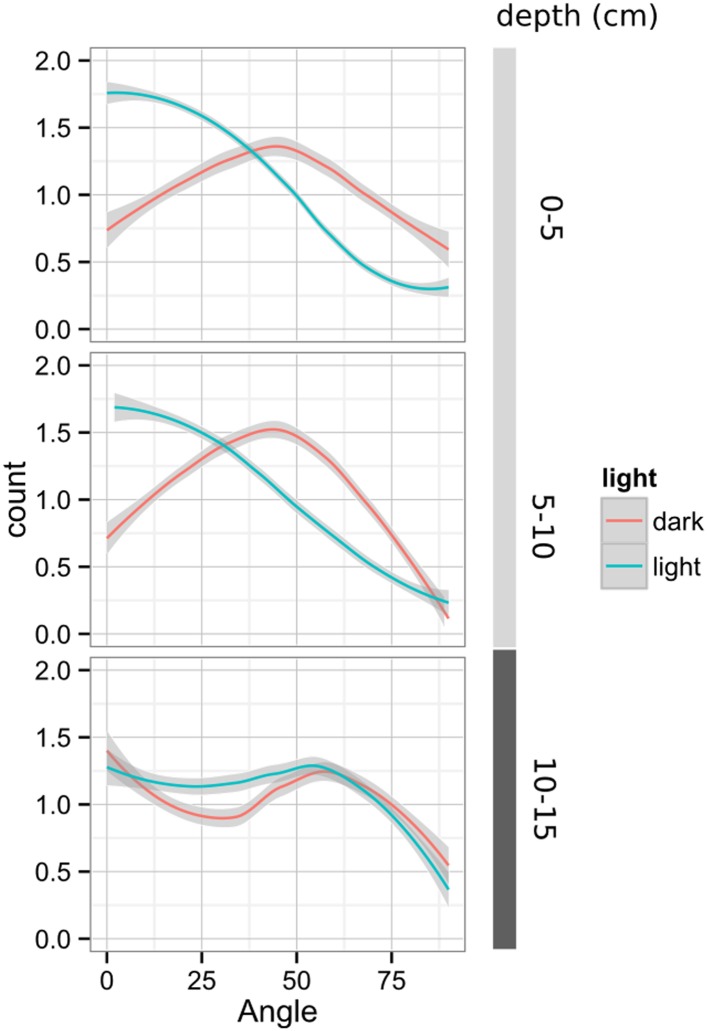
Figure 6—figure supplement 4. Plots showing output of directionality analysis performed at different depths (0–5, 5–10, 10–15 cm) in rhizotrons exposed to light or kept in the dark (n = 4-6 plants).

Figure 6—figure supplement 4.

Kolmogorov-Smirnov test at p < 0.001 showed significant differences in the directionality distributions between dark and light exposed Col-0 plants at 0-5 and 5-10 cm of depth, but not at 10-15 cm. A Local Polynomial Regression Fitting with 95% confidence interval (grey) was used to represent the directionality distribution curve. 0° is the direction of the gravity vector.
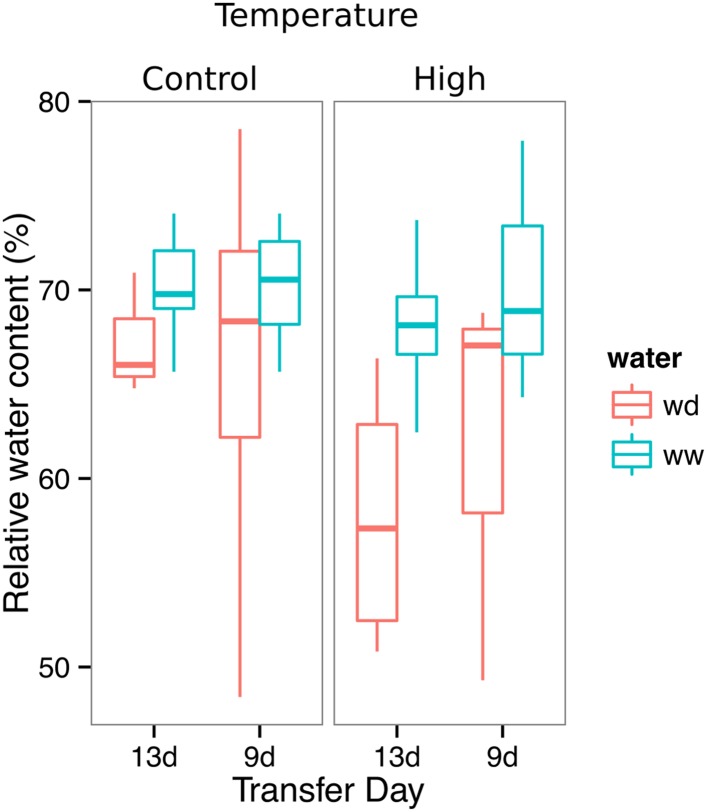
Figure 6—figure supplement 5. Leaf relative water content of 23 DAS plants that were subjected to WD after 9 or 13 DAS or kept under WW conditions.

Figure 6—figure supplement 5.

At 9 DAS, half of the plants were kept under control temperature conditions (22°C) and the other half transferred to a 29°C (high) chamber (n = 6–8 plants). ANOVA at p < 0.01 showed no significant differences between WW and WD in either of the temperature conditions.