

Abstract
Background:
Myocardial infarction (MI) is a leading cause of mortality and morbidity in Iran. No spatial analysis of MI has been conducted to date. The present study was conducted to determine the pattern of MI incidence and to identify the associated factors in Iran by province.
Materials and Methods:
This study has two parts. One part is prospective and hospital-based, and the other part is an ecological study. In this study, the data of 20,750 new MI cases registered in Iranian Myocardial Infarction Registry in 2012 were used. For spatial analysis in global and local, spatial autocorrelation, Moran's I, Getis-Ord, and logistic regression models were used. Data were analyzed by Stata software and ArcGIS 9.3.
Results:
Based on autocorrelation coefficient, a specific pattern was observed in the distribution of MI incidence in different provinces (Moran's I: 0.75, P < 0.001). Spatial pattern of incidence was approximately the same in men and women. MI incidence was clustering in six provinces (North Khorasan, Yazd, Kerman, Semnan, Golestan, and Mazandaran). Out of the associated factors with clustered MI in six provinces, temperature, humidity, hypertension, smoking, and body mass index (BMI) could be mentioned. Hypertension, smoking, and BMI contributed to clustering with, respectively, 2.36, 1.31, and 1.31 odds ratio.
Conclusion:
Addressing the place-based pattern of incidence and clarifying their epidemiologic dimension, including spatial analysis, has not yet been implemented in Iran. Report on MI incidence rate by place and formal borders is useful and is used in the planning and prioritization in different levels of health system.
Keywords: Myocardial infarction, spatial epidemiology, spatial analysis
INTRODUCTION
High prevalence and incidence of myocardial infarction (MI) as the most important cardiovascular disease and the reason for death has no geographical, spatial, gender, and social limit.[1,2] Mortality rate, per 100,000 population, due to these diseases is 265 worldwide, 224 in Eastern Mediterranean, and 171 in Iran.[2,3] By 2020, cardiovascular disease-associated mortalities will increase by 15% in developed countries, 77% in China, and 106% in other Asian countries.[2,4] In epidemiologic studies, MI incidence rate in a population could be used as an index or alternative for estimation of coronary heart diseases and their burden.[5,6] Identifying and determining the pattern of geographical distribution and spatial analysis of MIs contributes significantly to implementing the plans and focusing on creative, novel initiatives in health system and mitigating disparity in cardiovascular diseases. Person, time, and place comprise three basic components in epidemiologic studies and health planning. Place is a subdiscipline of health geography.[7,8,9] This discipline addresses the spatial distribution of health outcome and geographical variations in diseases and their risk factors in the human population.[10,11] Epidemiologic studies have mainly placed greater emphasis on two elements of person and time rather than place. With developments in the geographic information system as a powerful, speedy tool, spatial patterns could be investigated in epidemiologic studies and health management.[10,11,12] Identifying the patterns of MI incidence, the patterns of random, dispersed and cluster are important for management of MI.[12,13] Spatial analysis is frequently used for infectious diseases and cancer incidence.[13,14,15] This approach has been rarely used for cardiovascular diseases.[15] In Iran, no spatial analysis of MIs has been conducted to date. The present study was conducted to analyze MI spatially and determine the pattern of MI geographical distribution in Iran by province.
MATERIALS AND METHODS
This study has two parts. One part is prospective and population-based, and the other part is an ecological study. In this study, the data of Iranian Myocardial Infarction Registry in all hospitals equipped with a Cardiac Care Unit in 31 provinces of Iran were used. Iran is one of the South-Western Asian (Middle East) countries. It is bordered by Afghanistan and Pakistan from east, Turkmenistan from north-east, Caspian Sea from the middle north, Azerbaijan and Armenia from north-west, Turkey and Iraq from west, and Persian Gulf and Oman sea from south.[16] Inclusion criteria were based on World Health Organization (WHO) and World Heart Federation definition of MI diagnosis by International Classification of Diseases (the codes I22, I21).[6] The patients with MI history or nondefinite diagnosis made by the specialist were excluded from the study. The data on age, gender, and the province of residence were collected. Crude incidence rates were calculated for each province and whole country per 100,000 individuals based on sex. For the calculation of actual incidence rate in denominator, the data of population census by Statistical Center of Iran in 2011 were used. To adjust for age and gender effects on geographical scales, direct standardization method and WHO standard population were used. For spatial analysis, global and local indicators of spatial autocorrelation, Moran's I, and Getis-Ord were used. Moran's I generally lies between +1 and −1. A Moran's I of zero indicates the null hypothesis of no clustering, a positive Moran's I indicates positive spatial autocorrelation (i.e., clustering of areas of similar attribute values), while a negative coefficient indicates negative spatial autocorrelation (i.e., neighboring areas tend to have dissimilar attribute values). The Getis-Ord is an indicator of local clustering that measures the concentration of a spatially distributed attribute variables. By comparing local estimates of spatial autocorrelation with global averages, the Getis-Ord identifies hot spot in spatial data. The local Moran's I detects local spatial autocorrelation in aggregated data by decomposing Moran's I statistic into contributions for each area within a study region. These indicators detect clusters of either similar or dissimilar MI frequency values around a given observation.[17,18,19] To identify the factors associated with the spatial distribution of MI in ecological study (a binary response indicating the presence or absence of MI clustering at a given location), multiple logistic regression was used to model and simultaneously examine the variables’ effect and to control confounding variables. The unit of analysis in the regression is a group of people, typically defined by geography. In ecological analysis of the study, MI risk factors (hypertension, diabetes, body mass index [BMI], smoking, diet, obesity, and blood lipid disorder) were used as group (prevalence rate) across the provinces. These factors were obtained from the national study of noncommunicable diseases (NCDs) risk factors in Iran and meteorological data (temperature, relative humidity, altitude, and precipitation) of the provinces from Iran Meteorological Organization. The methodology of the survey was based on WHO's STEPwise approach to NCD surveillance. The methodology has been already described in other sources.[4,20,21] Data were analyzed by Stata Software (Stata Corp. 2011. Stata Statistical Software: Release 12. College Station, TX: Stata Corp LP) and ArcGIS (ESRI 2011. ArcGIS Desktop: Release 9.3).
RESULTS
Of 20,750 new cases of MI, 15,033 (72.4%) were male and the rest female. The mean age at MI development was by place significantly different among the provinces. Mean ± standard deviation of age was 59.6 ± 13.3 years in men, 65.4 ± 12.6 in women, and 61.2 ± 13.4 in the whole population. The mean age at MI incidence was significantly different among the provinces.
Based on the coefficient of global autocorrelation (spatial autocorrelation), a specific pattern was observed in the distribution of MI incidence in different provinces (Moran's Index: 0.751, variance: 0.017, Z-Score: 5.86 and P < 0.001).
Coefficient of global autocorrelation per sex is shown in Table 1. Figure 1 depicts spatial pattern of MI incidence by gender. MI incidence was clustering in six provinces (North Khorasan, Yazd, Kerman, Semnan, Golestan, and Mazandaran) Map A [Figure 1]. Spatial pattern of incidence was observed as clustering for men in six provinces (North Khorasan, Yazd, Kerman, Semnan, Quazvin, and Mazandaran) and for women in six provinces (North Khorasan, Yazd, Kerman, Semnan, Golestan, and Mazandaran) Maps B and C [Figure 1].
Table 1.
Coefficient of global autocorrelation for patterns of MI incidence in Iran in 2012
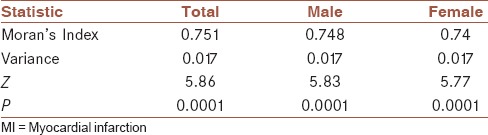
Figure 1.
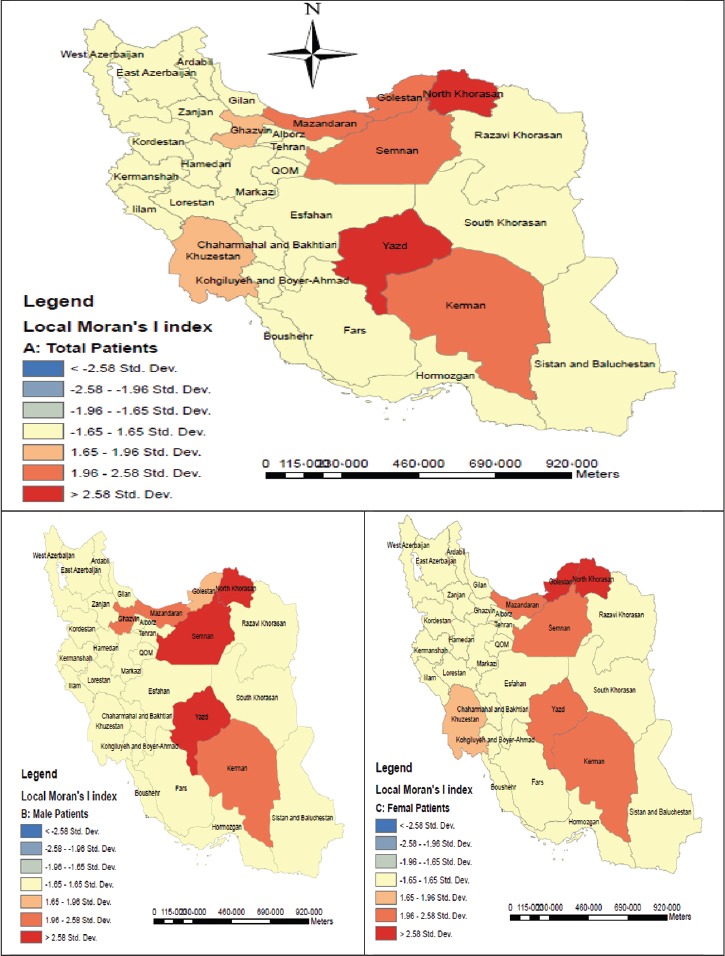
Cluster analysis: Z Score of Moran's I for male, female and total patients with myocardial infarction in Iran; 2012
Table 2 indicates the results of spatial analysis and clusters. Figure 2 shows MI incidence hot spot in Golestan, Mazandaran, Quazvin, Zanjan, Yazd, North Khorasan, South Khorasan, Razavi Khorasan, Isfahan, Hamadan, and Semnan provinces Maps D, E, and F [Figure 2] show hot spot analysis for all, male, and female patients, respectively.
Table 2.
Local autocorrelation for cluster detection and hot spot analysis (Getis-Ord) in six provinces in Iran
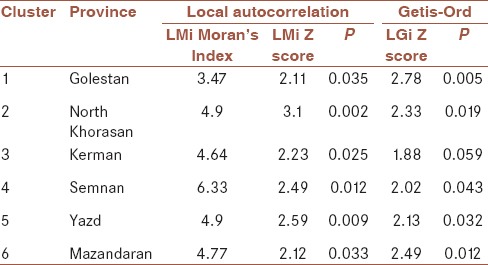
Figure 2.
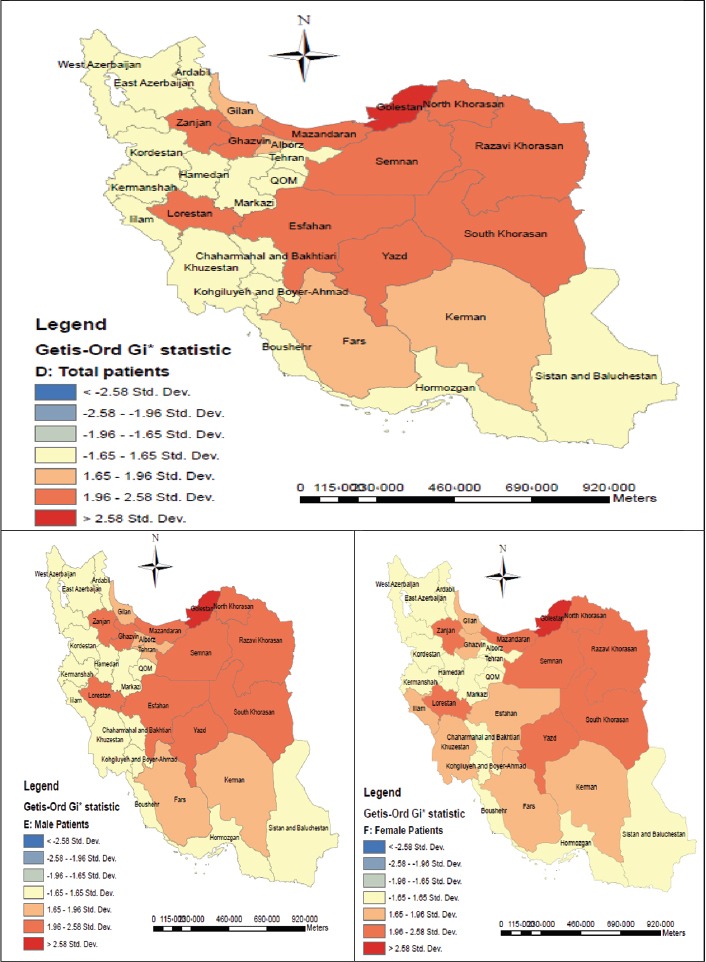
Hot spot analysis: Z Score of Getis-OrdGi* statistic (spatial statistics) for male, female and total patients with myocardial infarction in Iran; 2012
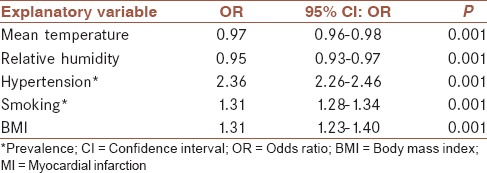
After entering different risk factors and meteorological factors in different logistic regression models, five variables were found as associated with clustered MI. Out of the associated factors with clustered MI in six provinces, temperature, humidity, hypertension, smoking, and BMI could be mentioned. Odds ratios (OR) of the associated factors with clustering are shown in Table 3. Hypertension, smoking, and BMI contributed to clustering with, respectively, 2.36, 1.31, and 1.31 OR. The highest OR was obtained for hypertension, followed by BMI and smoking. Calculated ORs for the temperature and humidity were inversely correlated with mortality, MI: (0.97: 0.0.96-0.98) and (0.95: 0.93-0.97), respectively, OR = 95% confidence interval.
Table 3.
OR in logistic regression model for influencing the presence clustering of MI in Iran; 2012
DISCUSSION
The present work is the first report on spatial analysis of MIs in Iran. Cardiovascular diseases are the first reason for death in Iran and impose a large burden on community. Addressing the place-based pattern of incidence and clarifying the epidemiologic dimension, including spatial analysis, has not yet been implemented in Iran. Therefore, the necessity of conducting this research is highly obvious to help decision makers and planners in the health system. Through these findings, the plans concerning prevention and control of cardiovascular diseases and MI, as the most important cause of death, could be desirably implemented.[22] Considering the limited resources and detecting the population at risk by place at provincial scale, prioritization in resource allocation and plans implementation in line with different levels of prevention (primary, secondary, tertiary) could be conducted more efficiently. In this study, the hypothesis of random incidence of MI at national scale was examined by spatial analysis and global Moran's I. This hypothesis was not confirmed. Therefore, at global scale, MI incidence in Iran was observed as clustering. Then, this analysis was done at provincial scale, and MI incidence was found as clustering in six provinces. Spatial pattern of incidence was approximately the same in men and women. The results of our study are consistent with those of a study in Australia, reporting clustering incidence of MI.[15] By comparison, it is fully obvious that incidence rate of MI in Iran is higher than that in Japan.[23] This rate is higher in Spain and Finland compared to Iran. In Finland, incidence rate is the same in men and women, but spatial pattern is various. Our study results are consistent with spatial difference in incidence observed in the study of Finland.[24,25] In a study in the USA, the standardized incidence rate of MI in 20 states was reported 22.2-39.7/100,000 population of 35 years old and over in 2008. That study reported large geographical variations among the states. The comparison between our work with the study of US states indicates that the incidence rate in Iran's provinces is variable similar to that in the US states, but incidence rate in Iran is higher compared to the USA.[26] Our findings are in agreement with a study in Brazil in which out of 35 studied regions, 31.4% of the regions had an MI incidence above national mean incidence and also MI incidence was unequal among different regions.[27]
Our findings are consistent with those of the studies conducted in Canada, Australia, and Finland, reporting temperature, relative humidity, and hypertension as MI risk factors.[15,24,27,28] The difference in MI incidence rate could be explained by various genetic, environmental factors or disparity of the disease risk factors in different provinces and socioeconomic classes. This issue requires further investigation in subsequent works. Although the quality of hospital registry of MI in Iran has been reported as acceptable,[29] failure to register MI cases who die outside hospital and no link between the MI and mortalities registry were of the limitations of this work and should be addressed in future research alongside periodical assessment of MIs registry to examine the precision of the registered cases until registry of data of MIs will become stable across Iran. Being population-based, including all provinces of the country, and estimating the incidence based on formal, provincial borders and the population reported by Statistical Center of Iran per WHO standards, and definite diagnosis by the cardiologist could be considered as strengths of our work. In addition, this was the first report on MI incidence in Iran. Ecological fallacy bias due to ecological analysis of the study and including grouped variables into analysis model are of limitations of this study, needing special interpretation. Ecological inferences will, therefore, continue to be made. Aggregate data are often easier to obtain than data on individuals, and may offer valuable clues to individual behavior.[30,31] The problems of confounding and aggregation bias, however, are unlikely to be resolved in near future. Deeper and more extensive studies should be conducted in six provinces of the country, where MI clustering was noted, to determine the reasons for clustering.
AUTHOR'S CONTRIBUTIONS
AA contributed in the conception of the work, conducting the study, revising the draft, approval of the final version of the manuscript, and agreed for all aspects of the work HS. KE and YM contributed in the conception of the work, drafting and revising the draft, approval of the final version of the manuscript, and agreed for all aspects of the work. All of the authors reviewed drafts of the article and contributed to the conceptual framework.
ACKNOWLEDGMENT
Data collection for this research was supported by the Cardiology Department, Hereby, we gratefully thank respectful personnel of Cardiology Department, respectful personnel in treatment deputies of universities of medical sciences and the nurses in cardiology wards of hospitals across Iran, cardiologists, officials, and advisors of Iran's Myocardial Infarction Registry Program, as well as Research and Technology Deputy of Shahrekord University of Medical Sciences, Shahrekord, Iran (grant: 2257). This work was approved by the Management Center of Non-Communicable Diseases and Office of Cardiovascular Diseases Prevention of Iran's Ministry of Health and Medical Education (approval no. 305/837).
Footnotes
Source of Support: Data collection for this research was supported by the Cardiology Department, respectful personnel in treatment deputies of Universities of Medical Sciences and the nurses in cardiology wards of hospitals across Iran, cardiologists, officials, and advisors of Iran's Myocardial Infarction Registry Program. The funding sources played no role in the study design, data analysis, and manuscript writing, or in the decision to submit this manuscript for publication
Conflicts of Interest: None declared.
REFERENCES
- 1.Harper K, Armelagos G. The changing disease-scape in the third epidemiological transition. Int J Environ Res Public Health. 2010;7:675–97. doi: 10.3390/ijerph7020675. [DOI] [PMC free article] [PubMed] [Google Scholar]
- 2.Ahmadi A, Soori H, Mehrabi Y, Etemad K, Samavat T, Khaledifar A. Incidence of acute myocardial infarction in Islamic Republic of Iran: A study using national registry data in 2012. East Mediterr Health J. 2015;21:5–12. doi: 10.26719/2015.21.1.5. [DOI] [PubMed] [Google Scholar]
- 3.Ahmadi A, Soori H, Sajjadi H. Modeling of in hospital mortality determinants in myocardial infarction patients, with and without type 2 diabetes, undergoing pharmaco-invasive strategy: The first national report using two approaches in Iran. Diabetes Res Clin Pract. 2015;108:216–22. doi: 10.1016/j.diabres.2015.02.018. [DOI] [PubMed] [Google Scholar]
- 4.Ahmadi A, Soori H, Mobasheri M, Etemad K, Khaledifar A. Heart failure, the outcomes, predictive and related factors in Iran. J Mazandaran Univ Med Sci. 2014;24:180–8. [Google Scholar]
- 5.Dégano IR, Elosua R, Marrugat J. Epidemiology of acute coronary syndromes in Spain: Estimation of the number of cases and trends from 2005 to 2049. Rev Esp Cardiol (Engl Ed) 2013;66:472–81. doi: 10.1016/j.rec.2013.01.018. [DOI] [PubMed] [Google Scholar]
- 6.Mendis S, Thygesen K, Kuulasmaa K, Giampaoli S, Mähönen M, Ngu Blackett K, et al. World Health Organization definition of myocardial infarction: 2008-09 revision. Int J Epidemiol. 2011;40:139–46. doi: 10.1093/ije/dyq165. [DOI] [PubMed] [Google Scholar]
- 7.Fares A. Winter cardiovascular diseases phenomenon. N Am J Med Sci. 2013;5:266–79. doi: 10.4103/1947-2714.110430. [DOI] [PMC free article] [PubMed] [Google Scholar]
- 8.Pedigo A, Aldrich T, Odoi A. Neighborhood disparities in stroke and myocardial infarction mortality: A GIS and spatial scan statistics approach. BMC Public Health. 2011:11–644. doi: 10.1186/1471-2458-11-644. [DOI] [PMC free article] [PubMed] [Google Scholar]
- 9.Nasri H, Ahmadi A, Baradaran A, Momeni A, Nasri P, Mardani S, et al. Clinicopathological correlations in lupus nephritis; a single center experience. J Nephropathol. 2014;3:115–20. doi: 10.12860/jnp.2014.22. [DOI] [PMC free article] [PubMed] [Google Scholar]
- 10.Rezaeian M, Dunn G, St Leger S, Appleby L. Geographical epidemiology, spatial analysis and geographical information systems: A multidisciplinary glossary. J Epidemiol Community Health. 2007;61:98–102. doi: 10.1136/jech.2005.043117. [DOI] [PMC free article] [PubMed] [Google Scholar]
- 11.Jacquez GM. Spatial analysis in epidemiology: Nascent science or a failure of GIS? J Geogr Syst. 2000;2:91. [Google Scholar]
- 12.Moore DA, Carpenter TE. Spatial analytical methods and geographic information systems: Use in health research and epidemiology. Epidemiol Rev. 1999;21:143–61. doi: 10.1093/oxfordjournals.epirev.a017993. [DOI] [PubMed] [Google Scholar]
- 13.Glass GE. Update: Spatial aspects of epidemiology: The interface with medical geography. Epidemiol Rev. 2000;22:136–9. doi: 10.1093/oxfordjournals.epirev.a018010. [DOI] [PubMed] [Google Scholar]
- 14.Stopka TJ, Krawczyk C, Gradziel P, Geraghty EM. Use of spatial epidemiology and hot spot analysis to target women eligible for prenatal women, infants, and children services. Am J Public Health. 2014;104(Suppl 1):S183–9. doi: 10.2105/AJPH.2013.301769. [DOI] [PMC free article] [PubMed] [Google Scholar]
- 15.Loughnan ME, Nicholls N, Tapper NJ. Demographic, seasonal, and spatial differences in acute myocardial infarction admissions to hospital in Melbourne Australia. Int J Health Geogr. 2008;30:7–42. doi: 10.1186/1476-072X-7-42. [DOI] [PMC free article] [PubMed] [Google Scholar]
- 16.Foundation w. Iran: [Last accessed on 2015 May 24]. Available from: http://www.en.wikipedia.org/wiki/Geography_of_Iran . [Google Scholar]
- 17.Auchincloss AH, Gebreab SY, Mair C, Diez-Roux AV. SpatialAnalytical Methods. Annu Rev Public Health. 2012;33:107–22. doi: 10.1146/annurev-publhealth-031811-124655. [DOI] [PMC free article] [PubMed] [Google Scholar]
- 18.Caprarelli G, Fletcher S. A brief review of spatial analysis concepts and tools used for mapping, containment and risk modelling of infectious diseases and other illnesses. Parasitology. 2014;141:581–601. doi: 10.1017/S0031182013001972. [DOI] [PubMed] [Google Scholar]
- 19.Fritz CE, Schuurman N, Robertson C, Lear S. A scoping review of spatial cluster analysis techniques for point-event data. Geospat Health. 2013;7:183–98. doi: 10.4081/gh.2013.79. [DOI] [PubMed] [Google Scholar]
- 20.Ahmadi A, Mobasheri M, Hashemi-Nazari SS, Baradaran A, Choobini ZM. Prevalence of hypertension and type 2 diabetes mellitus in patients with colorectal cancer and their median survival time: A cohort study. J Res Med Sci. 2014;19:850–4. [PMC free article] [PubMed] [Google Scholar]
- 21.Nasri H, Behradmanesh S, Ahmadi A, Rafieian-Kopaei M. Impact of oral vitamin D (cholecalciferol) replacement therapy on blood pressure in type 2 diabetes patients; a randomized, double-blind, placebo controlled clinical trial. J Nephropathol. 2014;3:29–33. doi: 10.12860/jnp.2014.07. [DOI] [PMC free article] [PubMed] [Google Scholar]
- 22.Hammar N, Larsen FF, de Faire U. Are geographical differences and time trends in myocardial infarction incidence in Sweden real. Validity of hospital discharge diagnoses? J Clin Epidemiol. 1994;47:685–93. doi: 10.1016/0895-4356(94)90216-x. [DOI] [PubMed] [Google Scholar]
- 23.Takii T, Yasuda S, Takahashi J, Ito K, Shiba N, Shirato K, et al. Trends in acute myocardial infarction incidence and mortality over 30 years in Japan: Report from the MIYAGI-AMI Registry Study. Circ J. 2010;74:93–100. doi: 10.1253/circj.cj-09-0619. [DOI] [PubMed] [Google Scholar]
- 24.Havulinna AS, Pääkkönen R, Karvonen M, Salomaa V. Geographic patterns of incidence of ischemic stroke and acute myocardial infarction in Finland during 1991-2003. Ann Epidemiol. 2008;18:206–13. doi: 10.1016/j.annepidem.2007.10.008. [DOI] [PubMed] [Google Scholar]
- 25.Larrañaga N, Moreno C, Basterretxea M, Marín P, Chirlaque MD, Amiano P, et al. Incidence of acute myocardial infarction in the Spanish epic cohort. An Sist Sanit Navar. 2009;32:51–9. doi: 10.4321/s1137-66272009000100006. [DOI] [PubMed] [Google Scholar]
- 26.Talbott EO, Rager JR, Brink LL, Benson SM, Bilonick RA, Wu WC, et al. Trends in acute myocardial infarction hospitalization rates for US States in the CDC tracking network. PLoS One. 2013:8–e64457. doi: 10.1371/journal.pone.0064457. [DOI] [PMC free article] [PubMed] [Google Scholar]
- 27.Soares PA, Nascimento LF. Spatial analysis of hospitalization for heart diseases in Vale do Paraíba. Arq Bras Cardiol. 2010;94:747–53. doi: 10.1590/s0066-782x2010005000038. [DOI] [PubMed] [Google Scholar]
- 28.Bayentin L, El Adlouni S, Ouarda TB, Gosselin P, Doyon B, Chebana F. Spatial variability of climate effects on ischemic heart disease hospitalization rates for the period 1989-2006 in Quebec, Canada. Int J Health Geogr. 2010:9–5. doi: 10.1186/1476-072X-9-5. [DOI] [PMC free article] [PubMed] [Google Scholar]
- 29.Shahraz S, Barzanjeh A, Bahari A, Nadery Y, Farzadfar F, Beyranvand MR, et al. The completeness of medical records to assess quality of hospital care: The case of acute myocardial infarction in a district-level general hospital in Iran. Arch Iran Med. 2012;15:592–5. [PubMed] [Google Scholar]
- 30.Ahmadi A, Hasanzadeh J, Rajaeifard A. Metabolic control and care assessment in patients with type 2 diabetes in Chaharmahal & Bakhtiyari Province 2008. Iran J Endocrinol Metab. 2009;11:33–9. [Google Scholar]
- 31.Wakefield J, Shaddick G. Health-exposure modeling and the ecological fallacy. Biostatistics. 2006;7:438–55. doi: 10.1093/biostatistics/kxj017. [DOI] [PubMed] [Google Scholar]