Glaucoma is one of the leading causes of blindness in the developed world. It is a progressive optic neuropathy where structural loss of retinal ganglion cell (RGC) axons corresponds with functional visual field defect. Glaucoma is distinguished from other optic neuropathies by its selective loss of RGC axons. Superior and inferior peripheral nerve sectors are found to be most vulnerable to pressure induced injury whereas the inner temporal sector is most resilient (Quigley et al., 1988). Pathogenesis behind the preferential axonal damage pattern is still poorly understood.
The architecture of the human RGC is elaborate and consists of a cell body within the retina that is connected to its target synapse by an axon more than 50 mm long with an average axonal diameter of only 0.72 μm. As RGC axons traverse a long distance through a number of different mechanical and extracellular environments along their projected path, it is expected that the cytoskeleton will play a critical role in maintaining axonal integrity. The distribution of cytoskeleton protein in the optic nerve head may therefore provide valuable information regarding the energetics and vulnerability of axonal injury in each compartment.
Axonal cytoskeleton proteins are inherently linked to RGC health and disease. Intermediate filaments, microtubules, actin filament and microtubule associated proteins (MAPs) constitute axonal cytoskeletons. Cytoskeleton protein behaviour is shaped by physiological variables such as absolute tissue pressure and pressure gradients. Additionally, structural determinants of regional cytoskeleton protein concentration include myelin proteins and the pattern of mitochondrial distribution. The variation in mitochondrial organelle, myelin protein content and neural tissue pressure along the length of the human RGC axon could potentially influence the regional concentration of cytoskeleton protein subunits. This may help explain why the optic nerve head is injured in an asymmetrical fashion in many diseases including glaucoma.
In experimental studies, alteration of RGC cytoskeleton proteins has been demonstrated in the acute phase of neuronal injury and has occurred before functional axonal changes were detected. The behaviour of RGC cytoskeleton proteins are also specific to the mode of neuronal injury with the pattern of cytoskeleton change following pressure-, axotomy- and ischemia-induced injuries being vastly different (Balaratnasingam et al., 2010, 2011). Although the response of RGC cytoskeleton proteins to axonal insults has been thoroughly explored in various animal models, there is relatively limited knowledge in topographic sectoral distribution of RGC axonal cytoskeleton proteins in human optic nerve. This knowledge would be a great relevance to understand the pathophysiology of glaucomatous optic neuropathy where preferential damage of certain RGC axons has been observed.
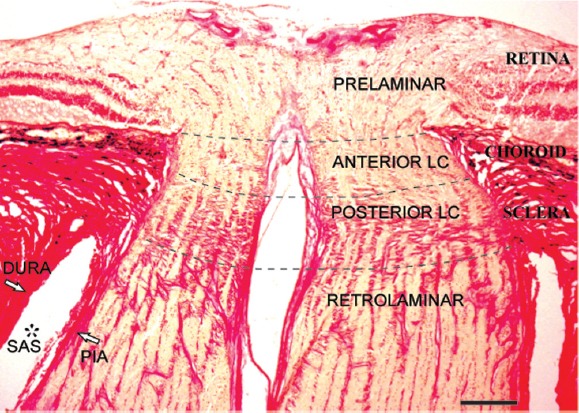
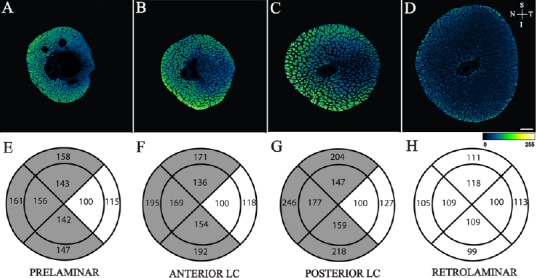
We examined the distribution of cytoskeleton proteins in different sectors of the cross sectional human optic nerve head (Kang et al., 2014). Nine eyes from 8 donors were used, all of which had no documented history of ocular disease or neurodegenerative conditions (mean age 46.9 ± 3.7 years). Following a careful dissection of the optic nerve with its marked orientation, the optic nerve was cut into 30 μm transverse cryosections, perpendicular to the long axis of the optic nerve. Using previously reported immunohistochemistry protocols, the following 6 cytoskeleton proteins were stained; 1) phosphorylated neurofilament heavy subunit (NFHp), 2) neurofilament heavy subunit (NFH), 3) neurofilament medium subunit (NFM), 4) neurofilament light subunit (NFL), 5) tubulin and 6) microtubule-associated protein (MAP). Each of the antibody labelled proteins were visualised using a confocal scanning laser microscope. Based on previously described histological criteria, we divided the optic nerve head into four specific laminar compartments; prelaminar, anterior lamina cribrosa, posterior lamina cribrosa and retrolaminar regions (Figure 1). Separate images were captured from these four laminar compartments. For quantitative analysis purposes, all optic nerve images were divided into 8 sectors (Figure 2). A quantitative histogram function was used to calculate average pixel intensity per 10 μm2 sample window in each of the 8 sectors. In each sector, total neural area of 7,200 μm2 collected from 72 sample windows was measured. To standardize measurements within each image, the pixel intensity of each sector was expressed as a percentage of the pixel intensity of the inner temporal sector within each image. Standardized stain intensity of cytoskeleton proteins from each sector across four laminar regions of optic nerve head is provided in a separate paper (Kang et al., 2014).
Figure 1.

Laminar regions of the human optic nerve in Van Gieson stain.
Longitudinal histological section of the human optic nerve demonstrates the prelaminar, anterior lamina cribrosa (anterior LC), posterior lamina cribrosa (posterior LC) and retrolaminar regions (separated by dotted lines). The prelaminar region is in continuation with retinal layers. Choroid layer is situated adjacent to the anterior LC region. Dense collagen beams that extend from the sclera distinguish the posterior LC region. The absence of dense collagen beams and the relative increase in optic nerve diameter characterises the retrolaminar region. Subarachnoid space (SAS*) between pia and dura mater in retrolaminar region is also labelled. Scale bar: 300 μm.
Figure 2.

Sectoral distribution of phosphorylated neurofilament heavy (NFHp) in the optic nerve head.
Top row: Confocal microscope images of the prelaminar (A), anterior lamina cribrosa (B), posterior lamina cribrosa (C) and retrolaminar (D) regions of human optic nerves stained with antibodies to NFHp. Images are pseudo coloured according to the pixel intensity scale presented at the bottom of the image. Arrows allow orientation of the superior (S), inferior (I), nasal (N) and temporal (T) margins of the images. Scale bar: 300 μm. Bottom row: Quantitative comparison of NFHp distribution between sectors. Mean standardized pixel intensity for each sector for prelaminar (E), anterior lamina cribrosa (LC) (F), posterior LC (G) and retrolaminar (H) regions of human optic nerves are presented. All sectors were standardized against the inner temporal sector in each image. Sectors that are significantly different from the inner temporal sector (P < 0.050) are shaded. Note: Reproduced from Kang et al., 2014, Sectoral variations in the distribution of axonal cytoskeleton proteins in the human optic nerve head. Exp Eye Res 128:141-150.
The major finding of this study is that significant differences exist in the sectoral pattern of NFM, NFH and NFHp distribution in the prelaminar, anterior lamina cribrosa and posterior lamina cribrosa regions of the optic nerve head (Figures 2 and 3). Specifically, the intensity of these cytoskeleton proteins is greatest in the superior-, inferior- and nasal-peripheral sectors of the optic nerve head. The inner nasal sector, on the other hand, exhibited lowest intensity of these cytoskeletons in the prelaminar, anterior lamina cribrosa and posterior lamina cribrosa regions of the optic nerve head. Earlier histopathology studies showed that, in pressure-induced axonal injury, the nasal sector of the neural tissue is rarely affected whereas superior and inferior peripheral regions of the optic nerve are most vulnerable (Quigley et al., 1982, 1988). These regions of preferential damage correspond to the sectors where the greatest concentration of NFHp, NFH and NFM was identified in this study.
Figure 3.

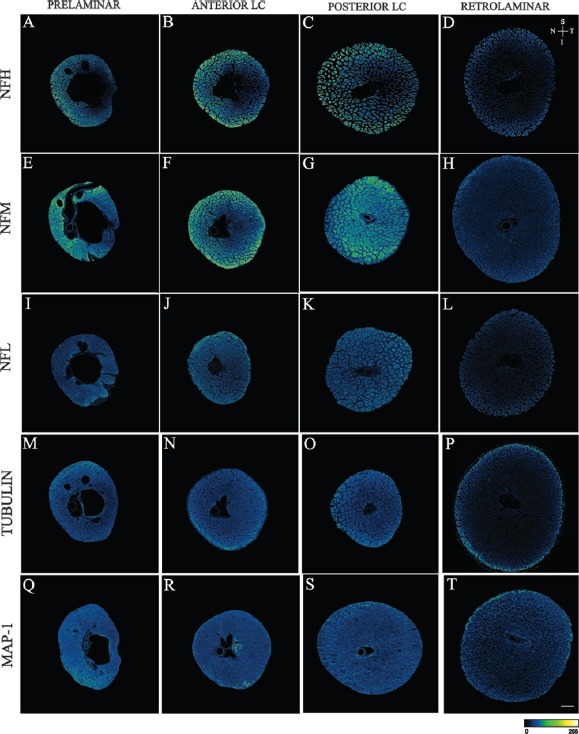
Confocal microscope images of the prelaminar, anterior lamina cribrosa (anterior LC), posterior lamina cribrosa (posterior LC) and retrolaminar regions of human optic nerves stained with antibodies to neurofilament heavy subunit (NFH) (A to D), neurofilament medium subunit (NFM) (E to H), neurofilament light subunit (NFL) (I to L), Tubulin (M to P) and microtubule associated protein (MAP)-1 (Q to T).
Images are pseudo coloured according to the pixel intensity scale presented at the bottom of the images. Arrows allow orientation of the superior (S), inferior (I), nasal (N) and temporal (T) margins of the images. Scale bar: 300 μm. Note: Reproduced from Kang et al., 2014, Sectoral variations in the distribution of axonal cytoskeleton proteins in the human optic nerve head. Exp Eye Res 128:141-150.
Neurofilaments are composed of a core filament and side arms with lateral projections (Gotow, 2000; Yuan et al., 2012; Janmey et al., 2014). The core filaments are comprised of all three neurofilament subunits proteins whereas the side arm projections are formed from the carboxy-terminal tail domains of NFM and NFH. Unlike NFL, NFH and NFM have hypervariable carboxy-terminus tail domains, enriched in Lysine-Serine-Proline repeat motifs (Gotow, 2000; Yuan et al., 2012; Janmey et al., 2014). They are responsible for forming the neurofilament sidearms. Phosphorylation of these sidearms is important in regulating the degree of interaction between neurofilaments and other axonal structures. At any one time, approximately 80% of NFH and NFM proteins are phosphorylated (Petzold, 2005). Previous reports have documented that axons of larger RGCs are found to be more vulnerable to glaucomatous axonal injury which are concentrated in the peripheral optic nerve head (Quigley et el., 1982). It also has been shown that the degree of NFH dephosphorylation corresponds to the degree of glaucoma-induced axonal damage (Kashiwagi et al., 2003). Collectively, our results suggest a possible role served by phosphorylated neurofilaments in meeting immediate metabolic demands of the axonal environment. Neurofilament heteropolymers with phosphorylated side arms are a high source of phosphate bonds that can be readily available for local adenosine triphosphate (ATP) generation and mitochondrial respiration (Yu et al., 2013). The ability of the neurofilament cytoskeleton to disassemble and adapt in response to local changes in the neuronal environment may be an important means by which the momentary changes in axonal energy demands are satisfied. In pathological states such as glaucoma, dephosphorylation of neurofilament will lead to depletion of local phosphate bonds. This will deprive metabolic pathways of essential substrate for axonal energetics which in turn will increase the vulnerability of axons to injury. Therefore, we may interpret our findings that neural sectors that are most vulnerable to injuries may have higher concentration of phosphorylated neurofilaments as a compensatory energy reservoir for axonal protection.
Another finding of this study is that all axonal cytoskeleton proteins are evenly distributed across different sectors in the retrolaminar region of the optic nerve head (Figure 3). The intensity of all axonal cytoskeleton proteins in the retrolaminar region was significantly lower when compared to prelaminar, anterior laminar cribrosa and posterior laminar cribrosa regions. These findings are consistent with our previous report (Balaratnasingam et al., 2009). We demonstrated that the distribution of mitochondrial cytochrome c oxidase along the optic nerve correlates closely to the distribution of neurofilaments and is inversely correlated to the pattern of optic nerve myelination. RGC axons are unmyelinated in the anterior portion of the optic nerve head (specifically, prelaminar, anterior laminar and posterior lamina cribrosa regions) and becomes myelinated from the retrolaminar region. Oligodendrocytes increase the velocity of action potential conduction through the provision of an axonal myelin sheath. They have been also shown to closely modulate neurofilament expression in axons (Saab et al., 2013). Together, our results suggest that higher concentration of cytoskeleton proteins and mitochondria are necessary to maintain non-saltatory nerve condition in absence of myelin in the anterior portion of the optic nerve head. It is possible that the high concentration of cytoskeleton protein in the anterior portion of optic nerve head may also reflect the need for an increased quantity of scaffolding to mechanically support the movement of motor proteins. The presence of myelin may also explain the relatively uniform distribution of cytoskeleton protein within the retrolaminar region.
Lastly, we did not find a significant difference in the concentration of tubulin and MAP protein between the different sectors of the optic nerve head (Figure 3). Tubulin and MAP form microtubules which provide the trackwork for organelle transport, and confer mechanical strength to the cytoskeleton framework. Considering their structural function in maintaining axonal transport and axonal stability, disruption of these proteins can significantly interfere with RGC homeostasis. The uniform distribution of these proteins suggests that, unlike neurofilaments, they are less likely to be influenced by, or modulate, regional metabolic activity in the optic nerve head.
In conclusion, this study demonstrates significant differences in the sectoral pattern of NFM, NFH and NFHp distribution in the anterior portion of the optic nerve head, which has not been described before to our knowledge. The most pertinent results of this study would be that the neural sector that showed the highest concentration of phosphorylated neurofilaments corresponded with the areas that are preferentially damaged in glaucomatous axonal injury. This finding suggests that the distribution of cytoskeleton proteins may be relevant for understanding the increased vulnerability of distinct human optic nerve head sectors to injury. Previously NFs loss and dephosphorylation of NFs have been demonstrated in animal models of optic nerve injury including a glaucoma model (Kashiwagi et al., 2003; Balaratnasingam et al., 2007; Chidlow et al., 2011). The extent of NF loss has been shown to be variable among the RGC subpopulation in an experimental animal model. To date, there is no study which documented spatio-temporal change of NFs in human glaucomatous optic nerve. It will be imperative to conduct a similar study using human eyes with glaucomatous optic neuropathies to clarify relationships between axonal cytoskeleton and selective axonal damage pattern in glaucoma.
With current technologies, there is a limitation in identifying axonal morphology in the optic nerve head. However, using birefringence and the optical properties of the retina, early change in reflectance of retinal nerve fiber layer preceding axonal loss has been documented (Hwang et al., 2011). Because the retinal nerve fiber layer reflectance arises from light scattering by the ultrastructures in axons, changes in the axonal cytoskeleton must cause changes in retinal nerve fiber layer reflectance. In the near future, with rapidly expanding optical technologies, it may well be possible to visualize individual axonal cytoskeleton components in vivo based on their reflectance wavelength characteristics. Application of these modalities, together with information gained from histological work such as this current study, may potentially increase our ability to identify ultrastructural changes to the optic nerve head that precede irreversible functional deficits.
Grant support was provided by the National Health and Medical Research Council of Australia.
References
- Balaratnasingam C, Morgan WH, Bass L, Matich G, Cringle SJ, Yu DY. Axonal transport and cytoskeletal changes in the laminar regions after elevated intraocular pressure. Invest Ophthalmol Vis Sci. 2007;48:3632–3644. doi: 10.1167/iovs.06-1002. [DOI] [PubMed] [Google Scholar]
- Balaratnasingam C, Morgan WH, Johnstone V, Cringle SJ, Yu DY. Heterogeneous distribution of axonal cytoskeleton proteins in the human optic nerve. Invest Ophthalmol Vis Sci. 2009;50:2824–2838. doi: 10.1167/iovs.08-3206. [DOI] [PubMed] [Google Scholar]
- Balaratnasingam C, Morgan WH, Bass L, Kang M, Cringle SJ, Yu DY. Time-dependent effects of focal retinal ischemia on axonal cytoskeleton proteins. Invest Ophthalmol Vis Sci. 2010;51:3019–3028. doi: 10.1167/iovs.09-4692. [DOI] [PubMed] [Google Scholar]
- Balaratnasingam C, Morgan WH, Bass L, Kang M, Cringle SJ, Yu DY. Axotomy-induced cytoskeleton changes in unmyelinated mammalian central nervous system axons. Neuroscience. 2011;177:269–282. doi: 10.1016/j.neuroscience.2010.12.053. [DOI] [PubMed] [Google Scholar]
- Chidlow G, Ebneter A, Wood JPM, Casson RJ. The optic nerve head is the site of aconal transport disruption, axonal cytoskeleton damage and putative axonal regeneration fiailure in a rat model of glaucoma. Acta Neuropathol. 2011;121:737–751. doi: 10.1007/s00401-011-0807-1. [DOI] [PMC free article] [PubMed] [Google Scholar]
- Gotow T. Neurofilamets in health and disease. Med Electron Microsc. 2000;33:173–199. doi: 10.1007/s007950000019. [DOI] [PubMed] [Google Scholar]
- Huang XR, Zhou Y, Kong W, Knighton RW. Reflectance decreases before thickness changes in the retinal nerve fiber layer in glaucomatous retinas. Invest Ophthalmol Vis Sci. 2011;52:6737–6742. doi: 10.1167/iovs.11-7665. [DOI] [PMC free article] [PubMed] [Google Scholar]
- Janmey PA, Leterrier JH, Herrmann H. Assembly and structure of neurofilaments. Curr Opin Colloid Interface Sci. 2014;8:40–47. [Google Scholar]
- Kang MH, Law-Davis S, Balaratnasingam C, Yu DY. Sectoral variations in the distribution of axonal cytoskeleton proteins in the human optic nerve head. Exp Eye Res. 2014;128:141–150. doi: 10.1016/j.exer.2014.10.006. [DOI] [PubMed] [Google Scholar]
- Kashiwagi K, Ou B, Nakamura S, Tanaka Y, Suzuki M, Tsukahara S. Increase in dephosphorylation of the heavy neurofilament subunit in the monkey chronic glaucoma model. Invest Ophthalmol Vis Sci. 2003;44:154–159. doi: 10.1167/iovs.02-0398. [DOI] [PubMed] [Google Scholar]
- Petzold A. Neurofilament phophoforms: surrogate markers for axonal injury, degeneration and loss. J Neurol Sci. 2005;233:183–198. doi: 10.1016/j.jns.2005.03.015. [DOI] [PubMed] [Google Scholar]
- Quigley HA, Addicks EM, Green R. Optic Nerve Damage in Human Glaucoma III. Quantitative correlation of nerve fiber loss and visual field defect in glaucoma, ischemic neuropathy, papilledema, and toxic neuropathy. Arch Ophthalmol. 1982;100:135–146. doi: 10.1001/archopht.1982.01030030137016. [DOI] [PubMed] [Google Scholar]
- Quigley HA, Dunkelberger GR, Green WR. Chronic human glaucoma causing selectively greater loss of large optic nerve fibers. Ophthalmology. 1988;95:357–363. doi: 10.1016/s0161-6420(88)33176-3. [DOI] [PubMed] [Google Scholar]
- Saab AS, Tzvetanova ID, Nave KA. The role of myelin and oligodendrocytes in axonal energy metabolism. Curr Opin Neurobiol. 2013;23:1065–1072. doi: 10.1016/j.conb.2013.09.008. [DOI] [PubMed] [Google Scholar]
- Yu DY, Cringle SJ, Balaratnasingam C, Morgan WH, Yu PK, Su EN. Retinal ganglion cells: Energetics, compartmentation axonal transport, cytoskeletons and vulnerability. Prog Retin Eye Res. 2013;36:217–246. doi: 10.1016/j.preteyeres.2013.07.001. [DOI] [PubMed] [Google Scholar]
- Yuan A, Rao MV, Veeranna, Nixon RA. Neurofilaments at a glance. J Cell Sci. 2012;125:3257–3263. doi: 10.1242/jcs.104729. [DOI] [PMC free article] [PubMed] [Google Scholar]


