

Abstract
Recognition and binding of specific sites on DNA by proteins is central for many cellular functions such as transcription, replication, and recombination. In the search for its target site, the DNA-associated protein is facing both thermodynamic and kinetic difficulties. The thermodynamic challenge lies in recognizing and tightly binding a cognate (specific) site among the billions of other (non-specific) sequences on the DNA. The kinetic difficulty lies in finding a cognate site in mere seconds amidst the crowded cellular environment that is filled with other DNA sequences and proteins. In this minireview, we will discuss the history of the DNA search problem, the theoretical background and the various experimental methods used to study the kinetics of proteins searching for target sites on DNA.
The question of how a protein finds its target site on DNA has a long and rich history. In 1968, Adam and Delbrück[1] suggested that the efficiency of bimolecular interactions could significantly increase by reducing the dimensionality of diffusion-based reactions in biological systems. Following that hypothesis, in 1970, Riggs et al. measured the association rate of the lac repressor protein to its binding site to be 1010 M−1 s−1.[2] This astonishingly high rate was shown to be much higher than the maximal rate of protein–DNA association achievable by diffusion in solution. The binding of a protein P to a target site S on DNA can be described as a bimolecular association reaction
| (1) |
In the limit that the association of a protein with its site is irreversible, the rate of formation of the product complex PS can be described by
| (2) |
with [P], [S], and [PS] indicating the concentrations of P, S, and PS, respectively. The coefficient ka describes the bimolecular association rate constant. The expression for the diffusion-limited rate constant of bimolecular reactions in the case of protein–DNA association has the form of
| (3) |
where D3D is the three-dimensional (3D) diffusion coefficient of the protein assuming the site on DNA diffuses much more slowly than the protein (this simplification seems an acceptable one, though a rigorous analysis would include the segmental motion of the individual DNA chain.[3] The parameter b indicates the spacing between the base pairs of DNA and is equal to b = 0.34 nm, since displacement by a single base pair (bp) leads to an entirely different DNA sequence that is not recognizable by the protein (Figure 1). The parameter a describes the fraction of the protein’s surface that contains the reactive binding interface. Using this equation, we can estimate the value of the diffusion-limited rate constant ka. Measured diffusion coefficients of proteins in aqueous environments have a range of D3D ≈ (1–5) × 10−6cm2s−1. We can assume a relatively large a ≈ 0.2–0.5 since a protein has a relatively large reactive interface and is likely to become oriented correctly as it approaches the DNA by the electrostatic interactions of basic amino acids with negatively charged DNA. Using these values we obtain
Figure 1.
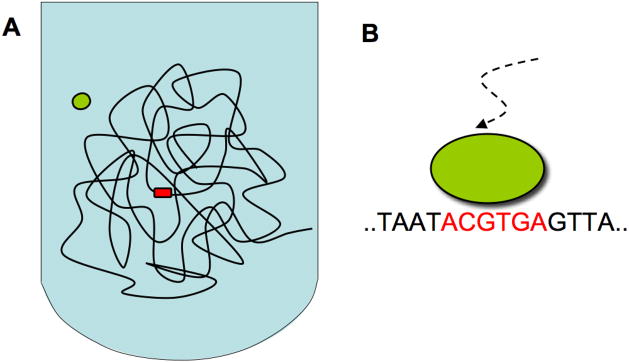
(A) Schematic representation of the protein–DNA search problem. The protein (green) must find its target site (red) on a long DNA molecule. (B) The target site must be recognized with 1 base-pair (0.34 nm) precision, as displacement by 1 bp results in a different sequence and thus a different site.
| (4) |
Comparing this theoretical limit with the experimental observation by Riggs et al. demonstrates that the protein–DNA search is about 100 times faster than the diffusion limit, suggesting that an alternative mechanism, referred to as facilitated diffusion, provides this increase in speed.
To resolve this discrepancy, a mechanism was suggested that includes both 3D diffusion in solution and one-dimensional (1D) diffusion of protein along DNA (the 1D/3D mechanism). This mechanism was first proposed and subsequently dismissed by Riggs et al.[2] but was soon revived and rigorously studied by Richter and Eigen,[4] then expanded and corrected by Berg and Blomberg,[5] and further developed by Berg et al.[6] The basic idea of the 1D/3D mechanism is that while searching for its target site, the protein repeatedly binds and unbinds DNA and, while bound non-specifically, slides along the DNA, undergoing a 1D random walk. Upon dissociation from the DNA, the protein diffuses through solution in three dimensions and binds to the DNA in a different place for the next round of one-dimensional searching (figure 2). During 1D sliding the protein is kept on the DNA by its binding energy to non-specific DNA. This energy has been measured for several DNA-binding proteins and has a range of 10–15 kBT (at physiological salt concentration), was shown to be driven primarily by screened electrostatic interactions between charged DNA and protein molecules,[7] and is thus highly sensitive to the concentration of salt ions. Following the hypothesis of the 1D/3D mechanism, different models can be envisioned for translocation of protein on DNA including (i) 1D sliding via a random walk along the DNA without dissociation; (ii) 1D hopping, with the protein moving along the DNA via a series of microscopic dissociation and re-association events to nearby location; (iii) jumping or diffusion in 3D, with a protein moving over longer distances or even between different DNA molecules via dissociation and then rebinding at a distant location; and (iv) intersegmental transfer, involving movement to a different DNA location by a looped DNA strand (Figure 3).
Figure 2.
Potential modes of target search. The protein can locate its target sequence through several proposed mechanisms: (i) one-dimensional sliding via a random walk along the DNA without dissociation (green) (ii) one-dimensional hopping, where the protein moves along the DNA via a series of microscopic dissociation and re-association events (blue); (iii) jumping or diffusion in 3D (orange); and (iv) intersegmental transfer, involving movement to a different DNA location by a looped DNA strand (purple).
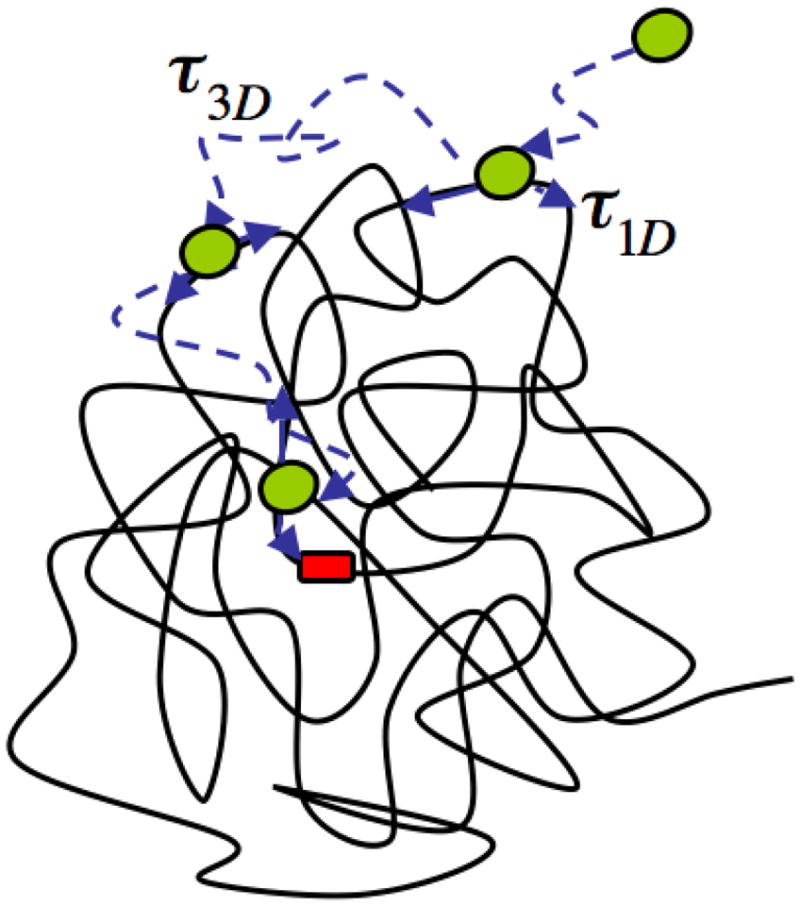
Figure 3.

Mechanism of facilitated diffusion. The protein (green) combines translocating on DNA and diffusion in solution to find its target site (red) on DNA. In this model, the search process consists of alternating rounds of 3D and 1D diffusion, each with average duration τ1D and τ3D respectively.
A theoretical model for protein-DNA search process
Search on DNA: a single-molecule approach
A large number of groups have performed theoretical work on protein-DNA search using the 1D/3D mechanism of facilitated diffusion as a basic framework.[8–17] We will briefly discuss here a model put forward by Slutsky and Mirny describing transcription-factor search consisting of rounds of diffusion in 1D and 3D.[8] Consider a single protein searching for a single target site on a long DNA molecule of M basepairs (bps) by the 1D/3D mechanism. The search consists of multiple rounds, each comprising one round of 1D diffusion followed by one round of 3D diffusion. Then the total search time, in the limit of high diffusivity, is given by (Figure 2)
| (5) |
where τ1D,i and τ3D,I are the durations of 1D and 3D diffusion, respectively, in the ith round of searching, and k is the number of rounds until the target site is found. If the total length of the genome is denoted by M and in each round of 1D diffusion the protein on average scans n̄ base-pairs, then the total time of the search can be written as
| (6) |
If 1D sliding proceeds by normal diffusion, then
| (7) |
where D1D is the diffusion coefficient of sliding.
Combining equations (1.6) and (1.7) and setting dt̄s/dτ1D = 0 to find the minimum time for the search, the authors conclude that the fastest search is achieved if τ1D = τ3D yielding a optimal search time
| (8) |
The authors then calculated the magnitude of the speed-up due to 1D/3D facilitated diffusion, as compared to a 3D-only or 1D-only mechanism. To obtain the mean search time for 3D diffusion alone, τ1D = 0 and n̄ = 1, yielding t̄3D = Mτ3D, n̄/2 times slower than that if the facilitated diffusion. The search time by 1D diffusion alone is t̄1D ≈ M2/D 1D, which is M/n̄ times slower than the optimal search time by facilitated diffusion. These results demonstrate that a combination of 1D and 3D search results in target localization faster than either 1D or 3D search alone. Using an alternative analytical approach, a combination of 1D and 3D diffusion was used by Klenin et al. to derive a direct relationship between predicted and measured 1D sliding lengths.[18]
Optimizing the extend of 1D diffusion by means of dissociation rates
Halford and colleagues tackled the problem of 1D/3D search from a different point of view.[9, 19] They modeled the 1D diffusion of protein on DNA by a random walk in one dimension. The mean position of the protein on the DNA is always at the origin where it initially bound and started to slide, but the distribution of the visited sites around the mean will broaden with increasing the number of steps that the protein visits during each 1D cycle on DNA. The number of base pairs visited per N steps changes with . After each step during the random walk the protein can dissociate from DNA into solution. The probability of the protein remaining on DNA for N steps (PN) is given by:
| (9) |
where ks is the rate constant for a 1-bp step along the DNA and koff is the rate constant for dissociation from DNA. They conclude that even with a ratio of 10000:1 for ks/koff, 99.8% of the proteins will dissociate from DNA before translocating a distance of 250bp on DNA. In addition the authors suggest that the ratio of ks/koff cannot be extremely large since the transition state for the protein from one base pair to another adjacent base pair is likely to be similar to that of dissociation of the proteins to the solution with similar number of bonds breaking between protein and DNA.
The authors concluded that the rate of target-site location is increased with increasing the sliding length during each 1D diffusion event, but only up to a certain limit of approximately 10 times the size of the target site. However, further increase of the sliding length decreased the target association rate. A 10-fold increase in the sliding length above the optimum length caused a decrease of 10 fold in the target association rate.[9]
Instead, the authors suggested that the optimal pathway for target search would involve frequent dissociation of the protein from DNA into the solution following by re-association to another site on DNA. After each dissociation the protein will stay close to DNA to increase the chance of rebinding to DNA at shorter times rather than escaping into solution. Each binding of the protein to DNA will be followed by a scanning of 50–100 base pairs. This repetitive binding and scanning process ensures visiting almost every sequence within a segment without visiting them redundantly. Such cycles of brief sliding and 3D diffusion with short times spent in solution will result in the optimal time for target recognition and result in a search mechanism much faster than 1D diffusion alone as it allows the protein to visit many more sites in any given time interval.
Role of DNA sequence and protein conformation
Several groups[8, 11, 20] have considered the role of DNA sequence in the process of facilitated diffusion. Since the energy of protein binding to DNA depends on the DNA sequence of the bound fragment, different sequences have different energies for binding to a certain protein. Thus, while sliding along DNA, the protein experiences different energies at different positions along the DNA (Figure 4).
Figure 4.
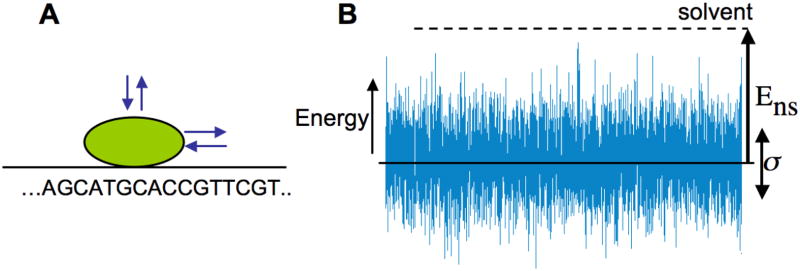
(A) Model of 1D sliding: at each step the protein can slide along DNA to the right or left, or dissociate into solution. (B) The sequence-dependent energy landscape of sliding. The protein–DNA binding energy depends on sequence, thus forming a rugged landscape. The parameters determining protein dynamics are the roughness of the energy landscape, σ and the (free) energy of non-specific binding to DNA, Ens.
To model the energy of binding of protein-DNA interactions for different sequences, one can use the position-weight matrix approximation.[21] This approximation assumes that the base-pairs in any fragment of DNA bound to protein contribute independently and additively to the total binding energy. According to the central limit theorem, the distribution of energies for random sequences can be estimated as a normal distribution. Slutsky and Mirny[8] assumed a sequence-dependent energy landscape as a random field with energies independently and normally distributed. By averaging the mean-first-passage time for a 1D random walk over the normally distributed energies, they obtained
| (10) |
where γ = 1, and σ2 is the variance of the protein–DNA binding-energy distribution. Other physical factors such as local DNA flexibility can create a correlated energy landscape, providing a different mode of diffusion.[20] Based on the rapid decay of the diffusion coefficient as a function of the ruggedness of the energy landscape, the authors suggested that sliding fast enough to explain experimental results is possible only for σ ≤ 1 − 2kB T. Consistent with this result, several proteins have been shown by single-molecule studies to slide sufficiently fast with σ ≤1 − 2 kB T (see also below).[22–27]
The search-stability paradox
Slutsky and Mirny[8] showed that a protein is required to have a relatively small variance of the sequence-dependent energy landscape (σ ≤1 − 2kB T ) for fast sliding and overall fast searching, assuming a 1D/3D search model with τ1D = τ3D. Once it finds its target site, the protein must bind it with great thermodynamic and kinetic stability to support its biological role (transcription initiation, DNA repair, etc.). The authors demonstrated that the requirements of both fast search and stability of the protein–DNA complex impose different and mutually exclusive constraints on σ. Whereas rapid search requires fairly smooth landscapes (σ ≤ 1 − 2kB T ), stability of the protein-DNA complex, in turn, requires a low energy of the target site. Indeed, the variance of the sequence-dependent binding energy σ determines not only the rate of sliding, but also the energy of the target site E0, and hence the equilibrium occupancy of the target site Peq:
| (11) |
where energies Ei of individual sites are drawn from a normal distribution with the variance σ2 and the target site has the lowest energy in the genome
| (12) |
(M ≈ 106 bp for bacterial genomes). It is easy to see numerically that Peq ≥ 0.25 requires σ ≥ 5kB T. These two conditions for fast search on sequence dependent landscape and stability of the protein on the target site are mutually exclusive and lead to the speed-stability paradox. The authors proposed that the presence of (at least) two distinct conformational states in the protein (or protein–DNA complex) could resolve the paradox, allowing the protein both to slide rapidly and to form a stable complex with the target site.
The two-state model: effective energy gap
Slutsky and Mirny[8] considered a search by a protein (generally, a protein–DNA complex) that has two conformations: the recognition (R) state with σ > 5 kB T and the search (S) state with σ ≈1 kB T (see Figure 5). In the S state, the protein can slide fast along DNA, while in the R state it cannot, but instead is able to bind the target site tightly. The parameters needed to define the system are the difference between the mean energy in the two states ΔGRS and the rate of transitions between the two states (or the barrier that separates them). For the latter, the authors assumed constant rates of the conformational transitions between the states R→S and S→R denoted by kRS and kSR, respectively. The equilibrium constant is therefore:
| (13) |
Figure 5.
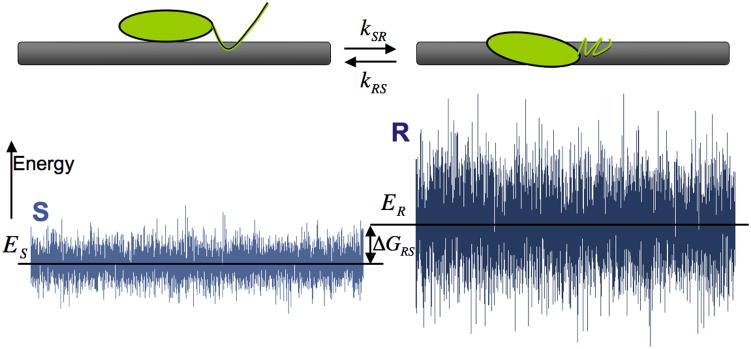
The two-state model for one-dimensional translocation of protein along DNA. The search state has a small ruggedness with σ < 2 kB T allowing the protein to slide rapidly. The recognition state has σ > 5 kB Trequired for tight binding, which allows recognition of the sequence. Lower mean energy of the recognition state Er < ES is required for the protein to spend most of the time sliding and occasionally sample rare sites that have ER(i) < ES(i).
A similar result was independently obtained by Hu et al.[11] Both groups showed that the presence of the fast search state S has two opposite effects on search: it helps to accelerate search by fast 1D sliding in the S state, but it can make search prohibitively slow if the target site is visited only in the S state and not recognized in the R state. The more time the protein spends in the S state, the more significant the acceleration is, but the more likely the protein misses the target site while sliding pass it in the S state.
The authors further showed that the two-state model allows for the reconciliation of stability with fast search, but has a few requirements:
The protein needs to undergo a sufficiently fast conformational transition (faster than ≈ n̄/τ1D ≈ 3.(103–104 )s−1). Several DNA-binding proteins have been shown to undergo conformational transitions upon binding to the target site[28–31] with rapid transition rates comparable to the estimate given above.[32]
The two-state mechanism requires that the specific binding conformation of the protein–DNA complex (state R), which is favorable when the protein is on the target site, be generally unfavorable elsewhere, that is, the mean energy in the R state must be much higher than that of the S state (figure 5). This requirement entails that the protein spends most of the time in the S state, which has little sequence-dependent variance σ≈1kB T, and is thus sliding fast. This scenario effectively creates a landscape with small ruggedness and a few low-energy sites with low energies.
A contradictory view on the diffusion limit
In a recent review paper by Halford,[19] the author questioned the assumption of the value of the diffusion limit in Riggs experiment on Lac repressor. They suggested that the rapidity of these reactions is due primarily to the electrostatic interactions between oppositely charged molecules of protein and DNA. In fact, the Smoluchowski equation (1.3) that describes the bimolecular association rate constant for the reaction of P + S ↔ PS is re-written as
| (14) |
where ε is the electrostatic factor and has a value of 1 for two neutralized molecules. In the case of two molecules P and S with same charge sign, ε < 1, and in the case of two molecules of opposite charge, ε > 1.
Electrostatic effects on macromolecular association kinetics have been examined on protein-protein interactions.[33] Increasing salt concentration from a few mM to several hundreds of mM caused a decrease in the association rate (from 1010 to 108M−1s−1) between two proteins.[33, 34] The bimolecular association rate constants for protein-protein interactions that appear to exceed the diffusion limit are therefore probably increased mainly due to the electrostatic interactions for proteins with opposite charges and in low salt concentrations. In the case of protein-DNA interactions in the Riggs experiment on lac repressor,[2] the electrostatic interaction between positively charged proteins and negatively charged backbone of the DNA is probably an important factor in increasing the apparent association rate of the protein to the target site and should be considered when measuring the diffusion limit.
Nevertheless, DNA-binding proteins have been shown in a variety of experiments (see sections discussing experimental studies below) to be able to one-dimensionally diffuse on DNA. Whether or not the protein uses this one-dimensional diffusion for faster search of the target site (facilitated diffusion) remains a question. The advent of new techniques, such as single-molecule imaging methods, places the field in an ideal position to understand these questions.
Experimental studies of protein diffusion along DNA
Ensemble-averaging experiments
Several lines of experimental evidence support a search mechanism with both 1D and 3D components.[17, 35–39] These include solution-phase experiments where the rate of specific binding to the target site has been significantly increased by lengthening non-specific DNA surrounding the site, and numerous other elegant biochemical experiments supporting the role of one-dimensional sliding in the search process.[19, 23, 40]
For example, kinetic assays revealed that EcoRI binds its target site faster on substrates with longer nonspecific DNA sequences around the target binding sequence.[41] In another study, Halford and collegues studied the one-dimensional translocation of BbvCI restriction enzyme which recognizes and cleaves an assymetrical target site.[37] They used DNA substrates containing two sites with different orientations from each other and varying distances between the two sites. They showed that when the distance between the two sites was less than 50 bp, the two sites were more efficiently cleaved when they were in the same orientation while in the case of the distance between the two sites being more than 50 base pairs, there was effectively no difference between the cleavage of sites with similar or inverted relative orientations. This finding shows that the enzyme not only uses the 3D/1D mechanism of search, but also slides along the DNA during its one-dimensional translocation while maintaining its orientation relative to the DNA backbone. The length of sliding of about 50bp found in this study is in agreement with the theoretical work by Halford and colleagues. This typical sliding distance has also been demonstrated by other groups using proteins such as the restriction enzyme EcoRV.[17, 36, 39]
In another study it was shown that EcoRV finds its target site by using both 1D diffusion on non-specific sequences and 3D diffusion through solution.[42] In this study, three different DNA substrates were used: a 3.4-kb plasmid that carried one EcoRV site; a DNA catenane derived from the same plasmid, comprising a 0.3 kb mini-circle containing a single specific sequence linked to a larger circle of 3.1 kb without a specific site; and the mini-circle freed from the catenane by cutting the 3.1 circle. The concentration of the DNA molecules is much higher than the EcoRV enzyme to ensure that there is not more than one enzyme on any DNA substrate at any time. The EcoRV enzyme found its recognition site in the mini-circle of the catenane just as fast as the plasmid, but acted much slower on the free mini-circle. This experiment suggests that the proteins utilized the non-specific DNA sequences in both the plasmid and the catenane and therefore slide on the non-specific DNA. However, the fact that the protein finds its target as fast in the catenane as in the plasmid with different geometry shows that the protein jumped between the non-specific sequence on the longer plasmid to the short mini-circle containing the site. Thus, the protein combines jumping and sliding in its target search.
Different approaches were used for proteins lacking nuclease activities. For example, the human transcription factor p53 was shown to slide by monitoring how fast it fell of the free end of a DNA substrate.[43] In this study, Prives and colleagues used DNA that is end labeled with biotin in the presence or absence of streptavidin. The p53 is bound to DNA and the rate of dissociation is measured by the rate of the proteins reduced binding to the labeled DNA after addition of excess unlabeled DNA. The rate of dissociation measured for the DNA with free end were higher than the blocked ones suggesting that the p53 slides off the free ends and therefore uses one-dimensional translocation to move along DNA.[43]
In all of the above examples, ensemble-averaging studies have tremendously helped in our understanding of kinetics of protein target search on the DNA and played a crucial role in the development of the original models of search. However, where these studies are powerful in addressing whether a protein is capable of translocating on DNA, they are limited in their ability to describe many important details of the process. For example, most assays are not able to distinguish between sliding, hopping or intersegmental transfer. Also, some assays cannot address the length of translocation along DNA or the diffusion coefficient of protein along DNA and almost none of the solution-phase assays can measure the heterogeneity in sliding properties of proteins. Recently developed single-molecule techniques for direct observation of individual proteins moving along DNA in real time have become increasingly important in answering these questions.
Single-molecule experiments to visualize protein-DNA interactions
The recent development of single-molecule techniques have made it possible to directly observe the movement of individual, fluorescently labeled proteins along stretched DNA molecules. Most of these experiments involve the stretching of individual DNA molecules in the field of view of a fluorescence microscope (Figure 6) and the imaging of the movement of the fluorescent protein along the DNA. The protein motion along the DNA is tracked as function of the time and the resultant trajectories fit to the 1D diffusion equation <y2> = 2D1Dt, where <y2> denotes the mean-square displacement of the protein relative to the DNA, D1D is the 1D diffusion coefficient and t represents time. Such an analysis allows for a molecule-by-molecule analysis of protein diffusion and a precise determination of the 1D diffusion coefficient (Figure 7).
Figure 6.
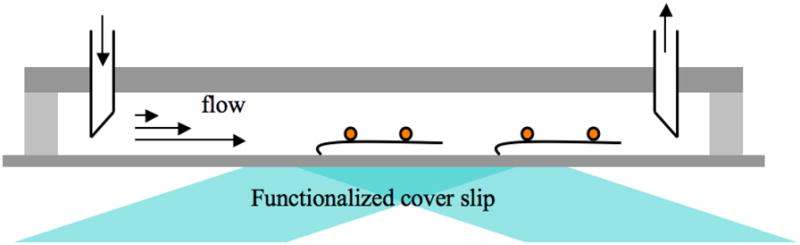
Total internal reflection fluorescent microscopy (TIRFM) is used to visualize single proteins moving along individual DNA molecules. A laser is reflected off the interface between an aqueous sample and a microscope slide, which generates an evanescent field decaying exponentially into the aqueous sample and selectively illuminates the fluorophores present within a few hundred nanometers of the surface. Combining TIRFM with methods for confining long DNA molecules by mechanically stretching them within the evanescent field has allowed visualization of single proteins moving along individual DNA molecules.
Figure 7.
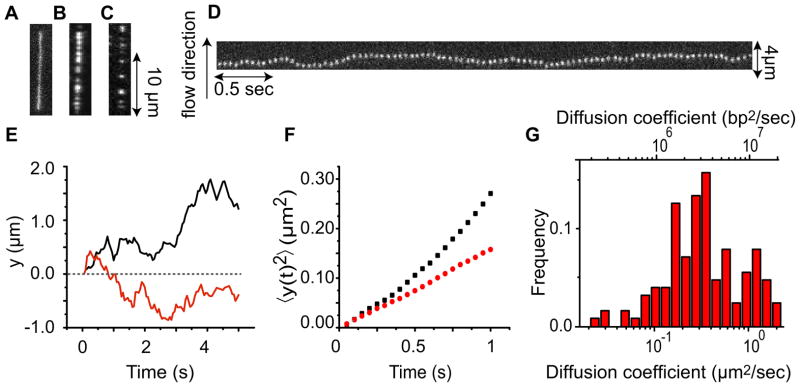
(A) Kymograph of an individual fluorescently labeled p53 transcription factor moving along flow-stretched DNA. The x axis represents time and the flow is directed upward along the y axis. (B) Trajectories of two p53 proteins diffusing on λ DNA. (C) Mean square displacement (MSD) versus time of the same two trajectories. (D) Histogram of diffusion coefficient D of 162 individual p53 proteins. Figure reproduced with permission from Ref. [26].
Using such methods, different proteins such as RNA polymerases, DNA repair proteins and transcription factors have been shown to one-dimensionally diffuse on DNA. The earliest examples of single-molecule studies that studied facilitated diffusion of a protein along DNA visualized the movement of a single E. coli RNA polymerase along a stretched DNA molecule.[44, 45] For example, Harada et al. used a combination of Total Internal Reflection Fluorescence (TIRF) microscopy and dual optical traps to stretch DNA tethered between two beads and observe the one-dimensional sliding of a single RNA polymerase.[44] In a more recent study, Kim et al. characterized the mechanism by which the RNA polymerase from the T7 bacteriophage is capable of diffusing along DNA.[46] They measured the diffusion coefficient of T7 RNAP on DNA by stretching the DNA molecule by laminar flow and imaging DNA-bound proteins with TIRF microscopy. To distinguish between sliding and hopping, the authors measured the diffusion coefficient in different salt concentration. Since protein affinity to nonspecific DNA is primarily determined by electrostatic interactions, varying the salt concentration in the experiments can modulate these interactions and allow one to discriminate between the hopping and sliding models. If hopping is the underlying mechanism of translocation of the protein on DNA, then at higher salt concentration, the protein spends more time in solution, resulting in an increase in the measured diffusion coefficient. However, in the sliding mechanism, due to the continuous contact of protein with DNA, the diffusion coefficient is independent of salt concentration.[27, 47, 48] Kim et al. demonstrated that the diffusion coefficient is independent of salt concentration, suggesting that the T7 RNAP moves along DNA via sliding and maintains a continuous contact with DNA.[46]
DNA repair proteins have also been shown in several cases to diffuse on DNA.[27, 49, 50] For example, Graneli et al. visualized sliding of Rad51, a protein involved in the repair of double-stranded DNA breaks, on λ phage DNA.[49] They stretched the DNA by attaching one end of the DNA to a lipid bilayer and applying a laminar flow. The authors imaged the movement of fluorescently labeled Rad51 along DNA molecules. In another study, Blainey et al. studied the one-dimensional diffusion of human oxoguanine glycosylase protein (hOgg1).[27] The diffusion coefficient of the protein on DNA was shown to be independent of salt concentration and hence suggested a sliding mechanism. By comparing the measured diffusion coefficient with the theoretically maximal diffusion coefficient corresponding to a protein moving along the helical pitch of DNA (see below), the authors determined an energy barrier of ~1 kBT for moving one base pair.
Another class of proteins that was suggested to diffuse along DNA when locating their target site is transcription factors. For example, Wang et al. demonstrated that the lac repressor uses one-dimensional diffusion along DNA to locate its site on DNA.[24] They demonstrated that by combining 1D diffusion along DNA and 3D diffusion in solution lac repressor find its target 90 times faster than the 3D diffusion limit.
Is one-dimensional diffusion coupled to rotation along DNA?
Theoretical studies indicate that the diffusion of protein along DNA will be substantially slower if the protein moves along the helical pitch of the DNA as opposed to lateral motion that is not coupled to rotation along DNA.[51, 52] In fact, it was shown by Schurr that considering only the geometry of the problem, for a typically sized protein there can be up to 100–1000 times difference between the observed diffusion coefficient of a protein that only moves translationally and that of a protein that rotates along the helical pitch.[51] Studies that have measured the diffusion coefficient for different proteins moving along DNA have all reported diffusion coefficients that are consistent with the Schurr model for sliding along DNA. The rotation along the helical pitch will result in continuous contact with DNA during sliding and can be advantageous by preventing the DNA from hopping and potentially missing the target site.[53] Due to the limit on the spatial resolution, the rotational motion of protein along DNA has not been directly observed, but there are experimental strategies that indirectly show a coupling between rotational diffusion and lateral movement along DNA.
As an example of such a study, Kochaniak et al. measured the diffusional properties of Proliferating Cell Nuclear Antigen (PCNA) in different viscosities and for different protein sizes (by attaching a quantum dot to the protein).[54] The change in the diffusion coefficient for different sizes of protein was in agreement with expected change due to rotational torque, suggesting that PCNA moves along DNA while most of the time, the clamp moves while rotationally tracking the helical pitch of the DNA duplex.
Tumor suppressor factor p53: A solution to the search-stability paradox
Recent single-molecule studies on the human tumor suppressor p53 have resulted in a deeper mechanistic insight into the question how more stable DNA binding can be combined with fast search. P53 is an important transcription factor in multicellular organisms, where it regulates cell-cycle arrest and is involved in preventing fast dividing of cells in cancer. As such, the tumor suppressor p53 has been described as “the guardian of the genome” referring to its role in conserving stability by preventing genome mutation. p53 is the most frequent target for genetic alteration in cancer and mutations of p53 have been found in more than 50% of all human cancers.[55]
P53 consists of a transactivation domain at its N-terminal tail, a folded core domain, a tetramerization domain and an unstructured C-terminal domain. While the majority of DNA-binding transcription factors have only a single DNA-binding domain, p53 contains two binding domains that each bind strongly to DNA. The central core domain of p53, which is the target for 97% of the cancer-related mutations, binds DNA in a sequence-specific fashion and mediates the protein’s nanomolar affinity to its consensus target sequence.[55, 56] The C-terminal domain of p53, however, interacts with DNA in a manner independent of sequence.[57–59] The relationship between the two DNA binding domains has long been a subject of research in p53 field. The C-terminal domain of p53 has been suggested to both negatively and positively regulate the binding of core domain to its target site on DNA.[43, 57, 60–63]
The mechanism by which p53 translocates on DNA prior to association with its target site and the interplay between its core and C-terminal domains while bound to DNA is poorly understood. In a recent single-molecule study, the authors report the visualization of the diffusive motion of individual, fluorescently labeled p53 proteins along mechanically stretched DNA molecules.[25] They demonstrate that the C-terminal domain is nonspecifically bound to DNA and is capable of sliding very rapidly along DNA, while the full-length protein moves on DNA at a much slower rate. They further observe that the C-terminal domain is capable of sliding on DNA while maintaining close contact with DNA backbone. The core domain of p53 however, is only capable of moving along DNA by rapid, repeated cycles of microscopic association and dissociation events.
The authors discuss their observations in the context of the previously proposed two-state model of sliding/recognition for transcription-factor search processes on DNA.[8, 11] While in the sliding state, the p53 protein is only bound to DNA via its C-terminal domain, and is capable of rapid translocation on DNA. In the recognition state, however, the protein is bound to DNA with both C-terminal and core domains and is therefore capable of undergoing sequence-specific binding to DNA. The authors proposed that the p53 protein interconverts rapidly between these states when searching for the target site on DNA. This rapid switching between the sliding and recognition states allows the protein to sample sequences for specific, core-domain mediated binding, while enabling rapid search through the interaction between the C-terminal domain and DNA. From a thermodynamic point of view, the C-terminal domain functions as negative regulator for p53 by its sequestering onto nonspecific DNA. From a kinetic perspective, however, the C-terminal region functions as positive regulator for p53 by helping the protein arrive at the cognate site faster.
Summary
The search to find specific targets on genomic DNA is an essential aspect of many important biological processes. Not only transcription factors need to be able to rapidly find their promotor sequences, also many other genomic processes such as repair and recombination rely on the rapid targeting, identification, and processing of particular targets on DNA.
For many decades, researchers have used a wide variety of creative biochemical, ensemble-averaging approaches to study these processes. The recent development of single-molecule detection methods has enabled the direct observation of such DNA-searching processes. Single-molecule studies have confirmed the existence of different modes of one-dimensional, diffusional movement of proteins along DNA and demonstrated a wide variety of behaviors in such searching processes.
Outlook
With the availability of single-molecule imaging techniques, researchers are now in a position to address a number of open questions related to protein search on DNA. The seemingly contradictory requirements for a protein to stably bind specific DNA sequences on the one hand, but to diffuse rapidly along the duplex on the other has been recently addressed for a transcription factor that contains two separate domains for these two activities. It remains to be seen how proteins that only contain one DNA-binding domain achieves such disparate goals.
Structural studies will continue to play an important role in elucidating the molecular nature of nonspecific interactions with DNA and the translocation mechanisms related to these interactions.[29, 64–66] In particular, structural comparisons between sequence-specific and nonspecific DNA-binding modes will reveal many of the important details of the transition between these states and, combined with kinetic data, will give insight into how conformational dynamics are coupled to rapid search and recognition.
No rationalization is obtained yet on why some proteins slide along DNA while searching, whereas others make microscopic hops. The ability of proteins that diffuse along DNA by hopping to bypass obstacles, such as transcribing RNA polymerases and nucleosomes, may be an important factor in rapid search on crowded DNA.[67–70]
The majority of experimental work has focused on systems in dilute conditions, a situation not representative for the crowded environment of the cell’s nucleus. The complex, colloidal environment of the cell[71] will affect the dynamics of intracellular biomolecular movement[72–74] and will, combined with the presence of many other protein factors bound to the DNA, significantly impact the role of 1D diffusion on search kinetics. Single-molecule experiments on protein diffusion along DNA in crowded environments will enable the characterization of the effects of these crowding phenomena on both the dynamics of the DNA and the protein moving along the duplex.
Thus far, the field has mainly focused on the role of 1D diffusion along DNA as a method to speed up the search for particular DNA targets. An open question is whether such mechanisms are also used to speed up the bimolecular association rates between pairs of proteins that are known to form complexes on DNA. An intriguing idea is the use of one-dimensional diffusion along DNA to speed up biochemical reactions between DNA-bound proteins. Such 1D biochemistry could prove useful in the optimization of biochemical reactions that normally take place in solution.
Acknowledgments
The authors would like to apologize for not citing many important studies due to space constraints. AvO would like to acknowledge financial support from the National Science Foundation and the National Institutes of Health. LAM acknowledges support by the NCI-funded Center for Physical Sciences in Oncology.
References
- 1.Adam G, Delbrück M. In: Reduction of dimensionality in biological difusion processes. Rich A, Davidson N, editors. W.H. Freeman & Company; San Fransisco: 1968. pp. 198–215. [Google Scholar]
- 2.Riggs AD, Bourgeois S, Cohn M. J Mol Biol. 1970;53:401–417. doi: 10.1016/0022-2836(70)90074-4. [DOI] [PubMed] [Google Scholar]
- 3.Berg OG, von Hippel PH. Annu Rev Biophys Biophys Chem. 1985;14:131–160. doi: 10.1146/annurev.bb.14.060185.001023. [DOI] [PubMed] [Google Scholar]
- 4.Richter PH, Eigen M. Biophys Chem. 1974;2:255–263. doi: 10.1016/0301-4622(74)80050-5. [DOI] [PubMed] [Google Scholar]
- 5.Berg OG, Blomberg C. Biophys Chem. 1976;4:367–381. doi: 10.1016/0301-4622(76)80017-8. [DOI] [PubMed] [Google Scholar]
- 6.Berg OG, Winter RB, von Hippel PH. Biochemistry. 1981;20:6929–6948. doi: 10.1021/bi00527a028. [DOI] [PubMed] [Google Scholar]
- 7.Revzin A. The Biology of Nonspecific DNA Protein Interactions. CRC-Press; 1990. [Google Scholar]
- 8.Slutsky M, Mirny LA. Biophys J. 2004;87:4021–4035. doi: 10.1529/biophysj.104.050765. [DOI] [PMC free article] [PubMed] [Google Scholar]
- 9.Halford SE, Marko JF. Nucleic Acids Res. 2004;32:3040–3052. doi: 10.1093/nar/gkh624. [DOI] [PMC free article] [PubMed] [Google Scholar]
- 10.Coppey M, Benichou O, Voituriez R, Moreau M. Biophys J. 2004;87:1640–1649. doi: 10.1529/biophysj.104.045773. [DOI] [PMC free article] [PubMed] [Google Scholar]
- 11.Hu T, Shklovskii BI. Phys Rev E Stat Nonlin Soft Matter Phys. 2006;74:021903. doi: 10.1103/PhysRevE.74.021903. [DOI] [PubMed] [Google Scholar]
- 12.Hu T, Grosberg AY, Shklovskii BI. Biophys J. 2006;90:2731–2744. doi: 10.1529/biophysj.105.078162. [DOI] [PMC free article] [PubMed] [Google Scholar]
- 13.Lomholt MA, Ambjornsson T, Metzler R. Phys Rev Lett. 2005;95:260603. doi: 10.1103/PhysRevLett.95.260603. [DOI] [PubMed] [Google Scholar]
- 14.Lomholt MA, van den Broek B, Kalisch SM, Wuite GJ, Metzler R. Proc Natl Acad Sci U S A. 2009;106:8204–8208. doi: 10.1073/pnas.0903293106. [DOI] [PMC free article] [PubMed] [Google Scholar]
- 15.Zhou HX, Szabo A. Phys Rev Lett. 2004;93:178101. doi: 10.1103/PhysRevLett.93.178101. [DOI] [PubMed] [Google Scholar]
- 16.Loverdo C, Benichou O, Voituriez R, Biebricher A, Bonnet I, Desbiolles P. Phys Rev Lett. 2009;102:188101. doi: 10.1103/PhysRevLett.102.188101. [DOI] [PubMed] [Google Scholar]
- 17.Bonnet I, Biebricher A, Porte PL, Loverdo C, Benichou O, Voituriez R, Escude C, Wende W, Pingoud A, Desbiolles P. Nucleic Acids Res. 2008;36:4118–4127. doi: 10.1093/nar/gkn376. [DOI] [PMC free article] [PubMed] [Google Scholar]
- 18.Klenin KV, Merlitz H, Langowski J, Wu CX. Phys Rev Lett. 2006;96:018104. doi: 10.1103/PhysRevLett.96.018104. [DOI] [PubMed] [Google Scholar]
- 19.Halford SE. Biochem Soc Trans. 2009;37:343–348. doi: 10.1042/BST0370343. [DOI] [PubMed] [Google Scholar]
- 20.Slutsky M, Kardar M, Mirny LA. Phys Rev E Stat Nonlin Soft Matter Phys. 2004;69:061903. doi: 10.1103/PhysRevE.69.061903. [DOI] [PubMed] [Google Scholar]
- 21.Berg OG, von Hippel PH. J Mol Biol. 1987;193:723–750. doi: 10.1016/0022-2836(87)90354-8. [DOI] [PubMed] [Google Scholar]
- 22.Elf J, Li GW, Xie XS. Science. 2007;316:1191–1194. doi: 10.1126/science.1141967. [DOI] [PMC free article] [PubMed] [Google Scholar]
- 23.Gorman J, Greene EC. Nat Struct Mol Biol. 2008;15:768–774. doi: 10.1038/nsmb.1441. [DOI] [PubMed] [Google Scholar]
- 24.Wang YM, Austin RH, Cox EC. Phys Rev Lett. 2006;97:048302. doi: 10.1103/PhysRevLett.97.048302. [DOI] [PubMed] [Google Scholar]
- 25.Tafvizi A, Huang F, Fersht AR, Mirny LA, van Oijen AM. Proc Natl Acad Sci U S A. 108:563–568. doi: 10.1073/pnas.1016020107. [DOI] [PMC free article] [PubMed] [Google Scholar]
- 26.Tafvizi A, Huang F, Leith JS, Fersht AR, Mirny LA, van Oijen AM. Biophys J. 2008;95:L01–03. doi: 10.1529/biophysj.108.134122. [DOI] [PMC free article] [PubMed] [Google Scholar]
- 27.Blainey PC, van Oijen AM, Banerjee A, Verdine GL, Xie XS. Proc Natl Acad Sci U S A. 2006;103:5752–5757. doi: 10.1073/pnas.0509723103. [DOI] [PMC free article] [PubMed] [Google Scholar]
- 28.Spolar RS, Record MT., Jr Science. 1994;263:777–784. doi: 10.1126/science.8303294. [DOI] [PubMed] [Google Scholar]
- 29.Kalodimos CG, Biris N, Bonvin AM, Levandoski MM, Guennuegues M, Boelens R, Kaptein R. Science. 2004;305:386–389. doi: 10.1126/science.1097064. [DOI] [PubMed] [Google Scholar]
- 30.Viadiu H, Aggarwal AK. Mol Cell. 2000;5:889–895. doi: 10.1016/s1097-2765(00)80329-9. [DOI] [PubMed] [Google Scholar]
- 31.Erie DA, Yang G, Schultz HC, Bustamante C. Science. 1994;266:1562–1566. doi: 10.1126/science.7985026. [DOI] [PubMed] [Google Scholar]
- 32.Kalodimos CG, Boelens R, Kaptein R. Nat Struct Biol. 2002;9:193–197. doi: 10.1038/nsb763. [DOI] [PubMed] [Google Scholar]
- 33.Schreiber G. Curr Opin Struct Biol. 2002;12:41–47. doi: 10.1016/s0959-440x(02)00287-7. [DOI] [PubMed] [Google Scholar]
- 34.Walker D, Moore GR, James R, Kleanthous C. Biochemistry. 2003;42:4161–4171. doi: 10.1021/bi0273720. [DOI] [PubMed] [Google Scholar]
- 35.Iwahara J, Zweckstetter M, Clore GM. Proc Natl Acad Sci U S A. 2006;103:15062–15067. doi: 10.1073/pnas.0605868103. [DOI] [PMC free article] [PubMed] [Google Scholar]
- 36.Stanford NP, Szczelkun MD, Marko JF, Halford SE. EMBO J. 2000;19:6546–6557. doi: 10.1093/emboj/19.23.6546. [DOI] [PMC free article] [PubMed] [Google Scholar]
- 37.Gowers DM, Wilson GG, Halford SE. Proc Natl Acad Sci U S A. 2005;102:15883–15888. doi: 10.1073/pnas.0505378102. [DOI] [PMC free article] [PubMed] [Google Scholar]
- 38.van den Broek B, Lomholt MA, Kalisch SM, Metzler R, Wuite GJ. Proc Natl Acad Sci U S A. 2008;105:15738–15742. doi: 10.1073/pnas.0804248105. [DOI] [PMC free article] [PubMed] [Google Scholar]
- 39.Porecha RH, Stivers JT. Proc Natl Acad Sci U S A. 2008;105:10791–10796. doi: 10.1073/pnas.0801612105. [DOI] [PMC free article] [PubMed] [Google Scholar]
- 40.von Hippel PH, Berg OG. J Biol Chem. 1989;264:675–678. [PubMed] [Google Scholar]
- 41.Jack WE, Terry BJ, Modrich P. Proc Natl Acad Sci U S A. 1982;79:4010–4014. doi: 10.1073/pnas.79.13.4010. [DOI] [PMC free article] [PubMed] [Google Scholar]
- 42.Gowers DM, Halford SE. EMBO J. 2003;22:1410–1418. doi: 10.1093/emboj/cdg125. [DOI] [PMC free article] [PubMed] [Google Scholar]
- 43.McKinney K, Mattia M, Gottifredi V, Prives C. Mol Cell. 2004;16:413–424. doi: 10.1016/j.molcel.2004.09.032. [DOI] [PubMed] [Google Scholar]
- 44.Harada Y, Funatsu T, Murakami K, Nonoyama Y, Ishihama A, Yanagida T. Biophys J. 1999;76:709–715. doi: 10.1016/S0006-3495(99)77237-1. [DOI] [PMC free article] [PubMed] [Google Scholar]
- 45.Kabata H, Kurosawa O, Arai I, Washizu M, Margarson SA, Glass RE, Shimamoto N. Science. 1993;262:1561–1563. doi: 10.1126/science.8248804. [DOI] [PubMed] [Google Scholar]
- 46.Kim JH, Larson RG. Nucleic Acids Res. 2007;35:3848–3858. doi: 10.1093/nar/gkm332. [DOI] [PMC free article] [PubMed] [Google Scholar]
- 47.Winter RB, Berg OG, von Hippel PH. Biochemistry. 1981;20:6961–6977. doi: 10.1021/bi00527a030. [DOI] [PubMed] [Google Scholar]
- 48.Halford SE, Szczelkun MD. Eur Biophys J. 2002;31:257–267. doi: 10.1007/s00249-002-0224-4. [DOI] [PubMed] [Google Scholar]
- 49.Graneli A, Yeykal CC, Robertson RB, Greene EC. Proc Natl Acad Sci U S A. 2006;103:1221–1226. doi: 10.1073/pnas.0508366103. [DOI] [PMC free article] [PubMed] [Google Scholar]
- 50.Gorman J, Chowdhury A, Surtees JA, Shimada J, Reichman DR, Alani E, Greene EC. Mol Cell. 2007;28:359–370. doi: 10.1016/j.molcel.2007.09.008. [DOI] [PMC free article] [PubMed] [Google Scholar]
- 51.Schurr JM. Biophys Chem. 1975;9:413–414. [PubMed] [Google Scholar]
- 52.Bagchi B, Blainey PC, Xie XS. J Phys Chem B. 2008;112:6282–6284. doi: 10.1021/jp077568f. [DOI] [PubMed] [Google Scholar]
- 53.Jeltsch A, Alves J, Wolfes H, Maass G, Pingoud A. Biochemistry. 1994;33:10215–10219. doi: 10.1021/bi00200a001. [DOI] [PubMed] [Google Scholar]
- 54.Kochaniak AB, Habuchi S, Loparo JJ, Chang DJ, Cimprich KA, Walter JC, van Oijen AM. J Biol Chem. 2009;284:17700–17710. doi: 10.1074/jbc.M109.008706. [DOI] [PMC free article] [PubMed] [Google Scholar]
- 55.Vogelstein B, Lane D, Levine AJ. Nature. 2000;408:307–310. doi: 10.1038/35042675. [DOI] [PubMed] [Google Scholar]
- 56.Jayaraman L, Prives C. Cell Mol Life Sci. 1999;55:76–87. doi: 10.1007/s000180050271. [DOI] [PMC free article] [PubMed] [Google Scholar]
- 57.Halazonetis TD, Kandil AN. EMBO J. 1993;12:5057–5064. doi: 10.1002/j.1460-2075.1993.tb06199.x. [DOI] [PMC free article] [PubMed] [Google Scholar]
- 58.Oberosler P, Hloch P, Ramsperger U, Stahl H. EMBO J. 1993;12:2389–2396. doi: 10.1002/j.1460-2075.1993.tb05893.x. [DOI] [PMC free article] [PubMed] [Google Scholar]
- 59.Wu WJ, Kakehi Y, Habuchi T, Kinoshita H, Ogawa O, Terachi T, Huang CH, Chiang CP, Yoshida O. Jpn J Cancer Res. 1995;86:730–736. doi: 10.1111/j.1349-7006.1995.tb02461.x. [DOI] [PMC free article] [PubMed] [Google Scholar]
- 60.Hupp TR, Meek DW, Midgley CA, Lane DP. Cell. 1992;71:875–886. doi: 10.1016/0092-8674(92)90562-q. [DOI] [PubMed] [Google Scholar]
- 61.Prives C, Hall PA. J Pathol. 1999;187:112–126. doi: 10.1002/(SICI)1096-9896(199901)187:1<112::AID-PATH250>3.0.CO;2-3. [DOI] [PubMed] [Google Scholar]
- 62.Muller-Tiemann BF, Halazonetis TD, Elting JJ. Proc Natl Acad Sci U S A. 1998;95:6079–6084. doi: 10.1073/pnas.95.11.6079. [DOI] [PMC free article] [PubMed] [Google Scholar]
- 63.Gohler T, Reimann M, Cherny D, Walter K, Warnecke G, Kim E, Deppert W. J Biol Chem. 2002;277:41192–41203. doi: 10.1074/jbc.M202344200. [DOI] [PubMed] [Google Scholar]
- 64.Sanchez IE, Ferreiro DU, Dellarole M, de Prat-Gay G. Proc Natl Acad Sci U S A. 2010;107:7751–7756. doi: 10.1073/pnas.0911734107. [DOI] [PMC free article] [PubMed] [Google Scholar]
- 65.Little EJ, Babic AC, Horton NC. Structure. 2008;16:1828–1837. doi: 10.1016/j.str.2008.09.009. [DOI] [PMC free article] [PubMed] [Google Scholar]
- 66.Horton JR, Liebert K, Hattman S, Jeltsch A, Cheng X. Cell. 2005;121:349–361. doi: 10.1016/j.cell.2005.02.021. [DOI] [PMC free article] [PubMed] [Google Scholar]
- 67.Kampmann M. J Biol Chem. 2004;279:38715–38720. doi: 10.1074/jbc.M404504200. [DOI] [PubMed] [Google Scholar]
- 68.Flyvbjerg H, Keatch SA, Dryden DT. Nucleic Acids Res. 2006;34:2550–2557. doi: 10.1093/nar/gkl271. [DOI] [PMC free article] [PubMed] [Google Scholar]
- 69.Hedglin M, O’Brien PJ. ACS Chem Biol. 2010;5:427–436. doi: 10.1021/cb1000185. [DOI] [PMC free article] [PubMed] [Google Scholar]
- 70.Gorman J, Plys AJ, Visnapuu ML, Alani E, Greene EC. Nat Struct Mol Biol. 2010;17:932–938. doi: 10.1038/nsmb.1858. [DOI] [PMC free article] [PubMed] [Google Scholar]
- 71.McGuffee SR, Elcock AH. PLoS Comput Biol. 2010;6:e1000694. doi: 10.1371/journal.pcbi.1000694. [DOI] [PMC free article] [PubMed] [Google Scholar]
- 72.Golding I, Cox EC. Phys Rev Lett. 2006;96:098102. doi: 10.1103/PhysRevLett.96.098102. [DOI] [PubMed] [Google Scholar]
- 73.Jeon JH, Tejedor V, Burov S, Barkai E, Selhuber-Unkel C, Berg-Sorensen K, Oddershede L, Metzler R. Phys Rev Lett. 2011;106:048103. doi: 10.1103/PhysRevLett.106.048103. [DOI] [PubMed] [Google Scholar]
- 74.Weber SC, Spakowitz AJ, Theriot JA. Phys Rev Lett. 2010;104:238102. doi: 10.1103/PhysRevLett.104.238102. [DOI] [PMC free article] [PubMed] [Google Scholar]