Abstract
Life-history strategies have evolved in response to predictable patterns of environmental features. In practice, linking life-history strategies and changes in environmental conditions requires comparable space–time scales between both processes, a difficult match in most marine system studies. We propose a novel spatio-temporal and dynamic scale to explore marine productivity patterns probably driving reproductive timing in the inshore little penguin (Eudyptula minor), based on monthly data on ocean circulation in the Southern Ocean, Australia. In contrast to what occurred when considering any other fixed scales, little penguin's highly variable laying date always occurred within the annual peak of ocean productivity that emerged from our newly defined dynamic scale. Additionally, local sea surface temperature seems to have triggered the onset of reproduction, acting as an environmental cue informing on marine productivity patterns at our dynamic scale. Chlorophyll-a patterns extracted from this scale revealed that environment factors in marine ecosystems affecting breeding decisions are related to a much wider region than foraging areas that are commonly used in current studies investigating the link between animals' life history and their environment. We suggest that marine productivity patterns may be more predictable than previously thought when environmental and biological data are examined at appropriate scales.
Keywords: spatio-temporal scale, marine productivity, reproductive timing, ocean currents, environmental cue
1. Introduction
The role of environmental variability in modulating organisms' life-history strategies is still an outstanding issue in ecology [1]. Organisms' annual cycles and their breeding milestones presumably evolved in response to predictable inter-annual patterns of environmental features driving food availability [2]. This is particularly crucial for species inhabiting temperate zones, where the success of reproduction depends on their ability to adjust reproductive timing to a suitable period of the year with enough food availability [3,4]. The timing of peak food availability varies between areas and years. As a consequence, the optimal timing of reproduction will also vary [5]. Fine-tuning at matching reproductive timing to high productivity patterns requires, therefore, certain plasticity in animals' phenology [6], along with a clear precursor signal informing on productivity patterns [2]. This cue also needs to be in time for allowing the physiological and behavioural responses leading to reproduction [7].
Investigations on environmental drivers of reproductive timing require appropriate space–time units for comparison between environmental proxies and phenological decisions [8,9]. Whereas local environmental features could have been targeted by selective pressures for reproductive timing in low dispersive species (e.g. sedentary species [10]), large-scale environmental cues (e.g. global climate indices) should be the ones probably implemented as drivers of reproductive timing in high dispersive species (e.g. migratory species [11,12]). However, in open marine environments, empirical support may be lacking when choosing a suitable scale of study that is able to predict matches between environmental and ecological processes. Indeed, physical processes largely controlling productivity patterns (e.g. currents, frontal zones and eddies) operate at scales of 10s to 100s km in the ocean [13,14], which are probably many times wider than the foraging areas of marine predators such as inshore seabirds [15,16]. Furthermore, biomass drifts away in space and time while energy flows from primary to higher trophic levels throughout marine food webs [17,18]. Accordingly, the dynamisms of marine ecosystems, along with the time delay between productivity patterns and its real consequences in food availability may be influencing species' life-history strategies far beyond the limits of their foraging ranges, and well before the onset of reproduction.
Owing to the difficulty in obtaining direct measures of prey distribution and availability in marine ecosystems, most marine animal studies use proxies such as chlorophyll-a concentration (CHL) and sea surface temperature (SST) to unravel spatio-temporal patterns in marine productivity and physical features linked to prey availability [10,19]. However, little is known about elapsed time responses between changes in environmental patterns and the related fluctuations in food availability. In most marine animal studies, correlations between environmental proxies and response variables (e.g. laying date) are explored at different time-lags (i.e. CHL and SST one to n months before the onset of reproduction), and restricted to animals' foraging grounds, thus potentially overlooking causal relationships between environmental drivers and breeding decisions.
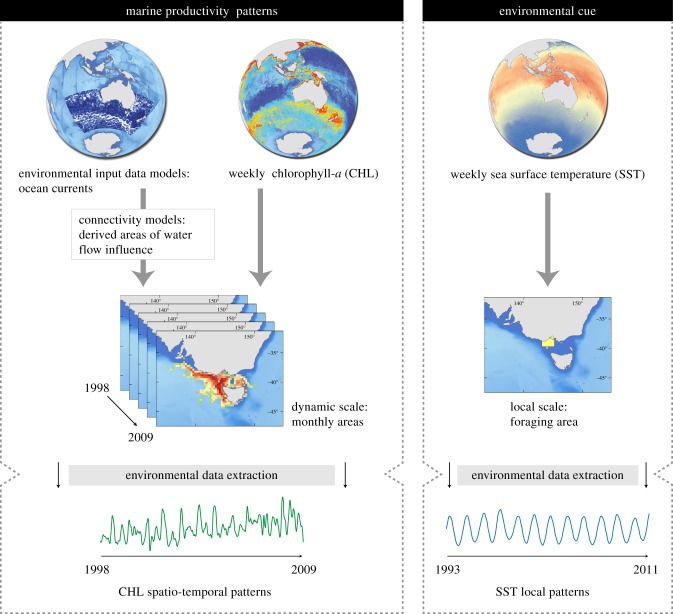
Here, we use continuous, high-temporal resolution data on ocean circulation, CHL and SST to examine the relationship between spatio-temporal patterns in marine productivity and published laying dates over 19 years (1993–2011) of an inshore seabird, the little penguin (Eudyptula minor) breeding at Philip Island, Australia, foraging in a highly dynamic and complex water circulation the Bass Strait [20]. Little penguins were selected as a suitable model species because of their great plasticity in breeding schedule, with breeding onsets varying inter-annually and thus suggesting certain ability to adjust their breeding time to inter-annual changes in marine productivity patterns. In this study, we used long-term (1993–2009) satellite-observable information on monthly ocean circulation to derive a novel dynamic spatial scale including water masses flowing to little penguin foraging ground and probably influencing its food availability and reproductive timing. Weekly information on CHL derived from the new dynamic scale (1998–2009) and local SST (1993–2011) were used as a surrogates of marine productivity [10] and environmental cues probably informing marine productivity patterns [11]. Working with this fine temporal resolution allowed us to obtain a chronological sequence of processes (environmental and biological) through all the study period, and explore for matching and temporal delays between seasonal patterns of environmental drivers and the onset of reproduction (figure 1).
Figure 1.
Flow-chart illustrating the applied methodology. From ocean currents reanalysis model data, we derived monthly water cost movement to the Bass Strait, using water speed and direction. Areas of influence comprise waters flowing to the Bass Strait, varying monthly (see Material and methods). From this dynamic spatial scale, we then obtained mean values for CHL. Temporal patterns of SST were extracted locally from little penguins' foraging area. (Online version in colour.)
2. Material and methods
(a). Study area and breeding data
We studied the timing of little penguin breeding at Phillip Island (Bass Strait), southeast Australia (38°15′ S, 143°30′ E). Field methods are described in detail elsewhere [21–23]. Only the mean laying dates of first clutches are used here. We used published laying date data of little penguins from 1993 to 2006 combined with a further 5 years of data from the same breeding sites on Phillip Island, resulting in a 19 year dataset (1993–2011).
(b). Oceanographic area and environmental data
Bass Strait is an on-shelf region of highly mixed water and relatively low productivity [17,24] with a very complex and seasonal circulation [20]. The surrounding region hosts two main surface boundary currents influencing water properties of Bass Strait (electronic supplementary material, figure S1). The Leeuwin Current provides Bass Strait with nutrient-rich water from the west, mainly during winter and spring. The East Australian Current flows southwards, bringing eddies of warm nutrient-poor tropical water from the Pacific Ocean into eastern Bass Strait, with a more intense flow from April to September [17]. The interaction of these water masses is influenced by seasonal, particularly winter, wind patterns, which enhances nutrient-rich water intrusions from western entrances resulting in significant decreases in sea temperature at the Bass Strait [11].
We used CHL (mg m−3) as proxy to marine productivity and SST (°C) as a potential environmental cue driving little penguins' onset of reproduction. CHL and SST were sourced online on a weekly basis from three different sources to cover the 1993–2011 temporal range when data were available: (i) AVHRR Pathfinder v. 5.2, spatial resolution of 0.041667°, obtained from the US National Oceanographic Data Center and GHRSST (http://pathfinder.nodc.noaa.gov) for SST data from 1993 to 2002 [25]; (ii) SeaStar SeaWiFS, spatial resolution of 0.08333° for CHL data from 1998 to 2002 (http://oceancolor.gsfc.nasa.gov/); and (iii) Aqua MODIS (http://oceancolor.gsfc.nasa.gov/), as level 3 Hierarchical Data Format (HDF) for CHL and SST products at a spatial resolution of 0.041667° (2002–2011). CHL and SST variables were processed and converted from HDF files to raster images using the Marine Geospatial Ecology Tools for ArcGIS v. 10.1 [26]. We used SST data from 1993 to 2011 and CHL from 1998 to 2009.
Sea surface current data were used to incorporate ocean dynamics in our study. Data were retrieved from the Global Ocean Physics Reanalysis Models 1993–2009 (www.myocean.eu, for the GMES services in the Marine Area project). Observation data were based on topography, altimetric sea-level anomaly and SST from track satellites (Topex Poseidon, Jason, Envisat and ERS), and in situ profiles of temperature and salinity. Models are provided in netCDF format at a 0.25° horizontal resolution and contain monthly average patterns of the main ocean currents as meridional and zonal components of horizontal water speed vectors. These variables were converted to monthly raster of water speed and direction with a Model Builder procedure in ArcGis v. 10.1 (ESRI, Redland, USA).
(c). Analyses
(i). Dynamic areas of influence
To identify the origin of connected water masses and therefore flowing to the Bass Strait, we used a connectivity-modelling approach using circuit theory. Analyses were performed with Circuitscape software [27]. Circuitscape couples graph-theory with electrical circuit theory and measures habitat connectivity by calculating the cumulative current that flows through each cell of a resistance map. This approach has been commonly used in terrestrial environments, whereas bio-physical models have been used to investigate an organism's connectivity in marine systems [17]. However, new frameworks have been recently developed for the study of connectivity matrices in the marine environment (see a graph-theorical approach in [28]). Circuit theory has improved notably the bases of the graph-theory by applying network theory to quantify connectivity in systems that respond positively to the presence of alternative pathways, relating structure and functional connection of the network [29,30]. This novel approach allows the addressing of connectivity studies through long-time series and large data by reducing computational efforts. Connectivity measures incorporate both the minimum movement distance or cost and the availability of alternative pathways [27]. Therefore, lesser connectivity is assigned to areas with multiple pathways possibilities and the result is a continuous map of probabilities of routes (outputs in volt units), rather than a single, least-cost path [31]. Circuit theory presents considerable robustness to changes in the scale of analysis, dealing with the choice of an appropriate cell size and map extent that always involves representing a landscape as a raster grid. Ocean currents information over an area of 10 000 × 4000 km surrounding the Bass Strait was used to construct a monthly resistance map as input for Circuitspace. The resistances values represent the relative effort required to traverse a pixel on a map [32]. For this purpose, we generated a direction raster representing azimuth directions between each raster cell and the Bass Strait. Then, we estimated the absolute differences (Δ angles) between sea surface current azimuths and the angle obtained from the direction raster for each cell and month in the 1993–2009 period. Following Raymond et al. 2014 [33], Δ angles were transformed into a measure of resistance by using the function y = 0.6184x – 0.0984 x2 (y = resistance, x = Δ angle, in radians; see the electronic supplementary material, figure S2). Parameters were estimated from calculated angles to obtain a [0, 1] interval of costs. This function assumes a resistance quadratic function, assigning minimum resistance values to angles pointing to the penguins' foraging zone in the Bass Strait, and increasing gradually for opposite directions, while overcoming the prerequisite of resistor isotropy ascribed to circuit theory. The final measure of resistance was obtained by multiplying the results by water speed (figure 2). From each monthly output map, we selected the higher connectivity areas to Bass Strait (those enclosed within the upper quartile -Q4-), hereafter called ‘areas of influence’. Monthly areas of influences were used as the dynamic scale to extract average values of CHL.
Figure 2.
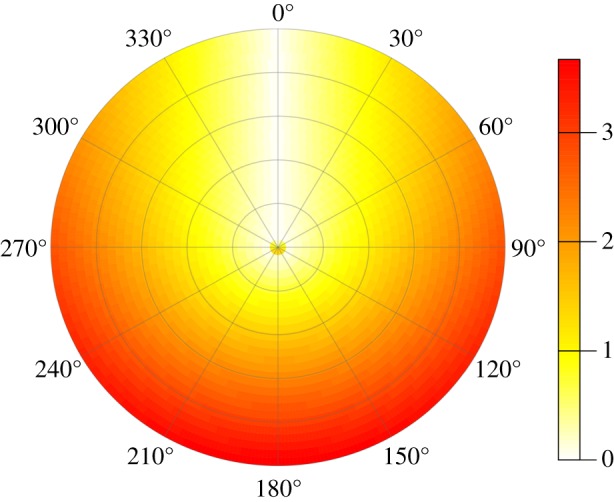
Resistance function applied to obtain the resistance habitat input in the Circuitscape analysis. Polar plot with resistance values (non-dimensional) for waterflow as a function of water direction and speed. In relation to water direction, estimates (ranging from 0 to 1) were obtained as a slope-dependent quadratic function for x-values, where x-values represent the absolute angle difference (ranging from 0 to 2π radians) between current azimuths and direction of each pixel to the sink, i.e. the Bass Strait (see the electronic supplementary material, figure S2). Final resistance was obtained by multiplying these estimates by water speed, thus resulting in higher resistant values for those spatial locations where faster currents (ca 3.6 m s−1) flowed in the opposite direction (π radians) to the Bass Strait. (Online version in colour.)
(ii). Patterns of chlorophyll-a and sea surface temperature
In order to test the suitability of the SST as environmental predictor of the CHL patterns in the areas of influence, we compared time-series data of both environmental variables for the 1998–2009 period. Weekly CHL was extracted from each monthly area of influence. As a local environmental cue, weekly SST was extracted from the foraging area. CHL and SST were interpolated daily using a non-parametric locally smoothing function (loess) to remove noise in the original signal of weekly data [34]. The smoothed data were decomposed into their trend, seasonality and irregular components by a time-series additive model [35] to explore for their repeated patterns in annual peaks and troughs. The correlation between detrended CHL and SST time series as a function of daily time-lag, was analysed through a cross-correlation method [36]. Coefficient values range from 0, no correlation, to −1 or 1, denoting total correlation, at different lagged time units.
(iii). Dynamic versus fixed scales
To test for the suitability of the areas of influence as a scale indicative of phenological processes, we defined nine different, concentric areas ranging from a local (100 km width corresponding to the Little penguin's foraging area [15]) to a regional scale (1000 km width), at incrementing intervals of 100 km. Weekly mean values of CHL were extracted from fixed and monthly dynamic scales for the 1998–2009 period. We compared the differences in time (weeks in absolute value) between laying date and maximum annual peak of CHL (mean and s.d.) for each spatial scale.
(iv). Phenological adjustment to environmental annual cycles
In order to summarize the information for the entire study period, laying date (mean and s.d., 1993–2011), CHL (1998–2009) and SST (1993–2011) were standardized and averaged daily. Mean and s.d. values were standardized relative to the time of the annual minimum values of SST. This procedure made it possible to compare the time adjustment of both environmental and phenological processes during all the annual cycles of the study period, considering the start of the season instead of the start of the calendar year. All analysis were performed in R v. 3.0.2 [37].
3. Results
Dynamic areas derived from our connectivity analysis, the areas of influence from 1998 to 2009, showed an influence zone ranging 500 km, with two separate regions at the eastern and western sides of Bass Strait (figure 3a). These regions are characterized by seasonal eddies that act as potential barriers in the resistance surfaces, and consequently, delimit the outer edges of the areas of influence (see the electronic supplementary material, figure S3). As expected by the changes in direction and intensity of ocean currents during the year, these areas extend further depending on the season (electronic supplementary material, figure S4 and video S1). Areas of influence showed greater variability in their longitudinal (157°46′ E and 128°53′ E) than in their latitudinal ranges (29°59′ S and 49°53′ S). Monthly averages revealed certain seasonality in the influence of the east and west sides, reflected in latitudinal asymmetries on areas depending on the months (electronic supplementary material, figure S4). Indeed, the eastern area of influence peaked during the austral autumn (April to October), whereas the western area of influence reached its maximum value from late winter, to spring and summer (October to February) (electronic supplementary material, figure S2 and video S1).
Figure 3.
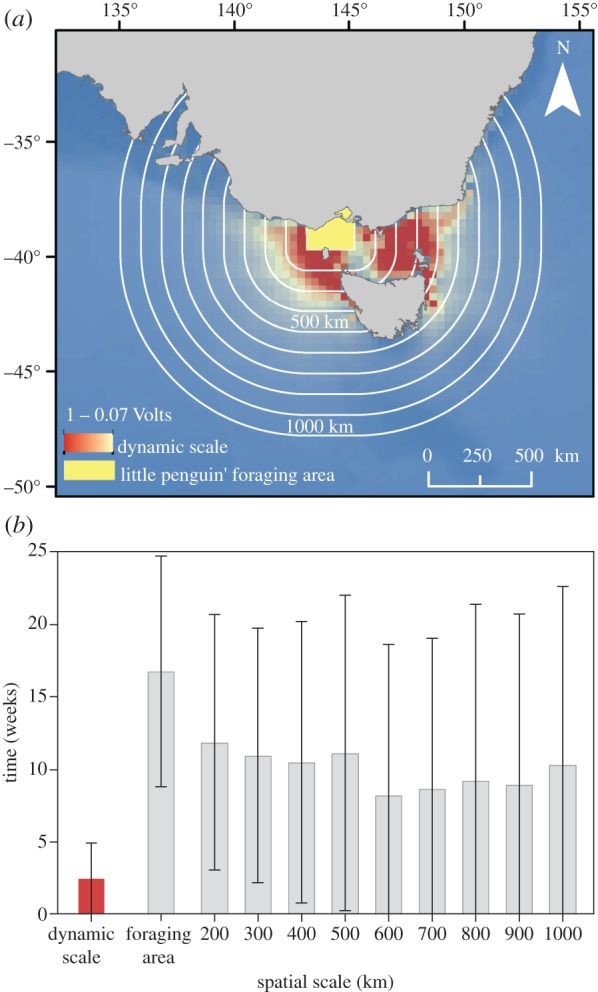
Penguins phenology was closely coupled to productivity patterns at a dynamic scale. (a) Suitability of dynamic scales was compared with fixed spatial scales at incrementing intervals of 100 km from penguins foraging area delimited by Cullen et al. [15] to regional area (1000 km). Mean areas of influence for the 1993–2009 period is shown in graduated colours displaying conductivity (in volts). (b) Inter-annual variation (±s.d.) in the differences in time (weeks in absolute value) between laying date and maximum annual peak of CHL across dynamic and fixed spatial scales between 1998 and 2009. Match time is highlighted in the dynamic scale (mean: 2.42, s.d.: 2.45 weeks). (Online version in colour.)
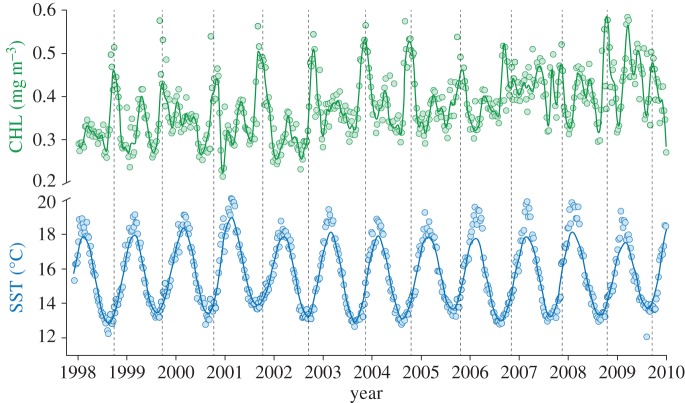
CHL trends within defined areas of influence for the 1998–2009 period (figure 4) revealed that maximum annual peaks typically occurred from September to November, matching the onset of the little penguin reproductive season (with the only exception of an anomalous year, 2009, when the maximum annual peak occurred in March).
Figure 4.
Patterns of CHL and SST. Annual patterns of CHL (green line) and SST (blue line) from 1998 to 2009. Grey dashed lines mark little penguins annual mean laying date. Time series were daily interpolated and smoothed to remove noise in the original signal of weekly data. (Online version in colour.)
During the 1993–2011 period, mean laying date of little penguins ranged from 18 September to 17 November. CHL annual peaks obtained from dynamic and a set of fixed scales (figure 3a) show a greater synchrony over time with monthly dynamic scales (figure 3b). Indeed, mean laying date occurred consistently within ca three weeks around the annual peak of CHL within our areas of influence (figure 4). By contrast, patterns exhibited at all the rest of the static scales yielded four to five times greater inter-annual variability between annual peak of CHL and penguin's phenology. Delayed time between laying date and the CHL annual peak pointed to the newly defined dynamic scale as the scale with the most predictable power, i.e. the one that showed the greater synchrony over time with little penguins' laying date (as revealed by the standard deviation of averaged, delayed time), and the one that couples the best with penguin phenology laying date (figure 3b).
SST patterns within penguin's foraging areas showed an annual cycle that oscillated with minimum values around August, ca seven weeks before annual peak of CHL in our areas of influence (figure 4). Maximum correlation between local SST and CHL values from the areas of influence was achieved with a seven-week delay (correlation coefficient = −0.37). The negative correlation implies that lower values of local SST resulted in rising CHL values in the areas of influence (figure 5).
Figure 5.
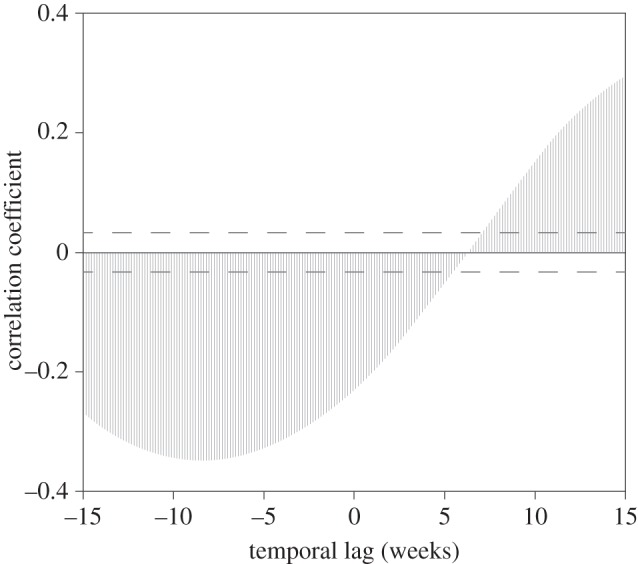
Local signal (SST) predicts productivity patterns at dynamic scale. Cross-correlation analysis between local SST and CHL extracted from areas of influence, as a function of daily lag. The maximum correlation indicates that the SST leads the productivity by seven weeks.
Seasonal cycles of SST commonly started in August, with the slow rising of SST and faster rising of CHL with a higher annual peak (figure 6). Inter-annual variability revealed SST as a physical variable with a fixed periodicity and a narrow range of variation among years. Laying date was seven weeks (± two weeks) on average after the trough of SST, associated to the CHL peak of the areas of influence.
Figure 6.
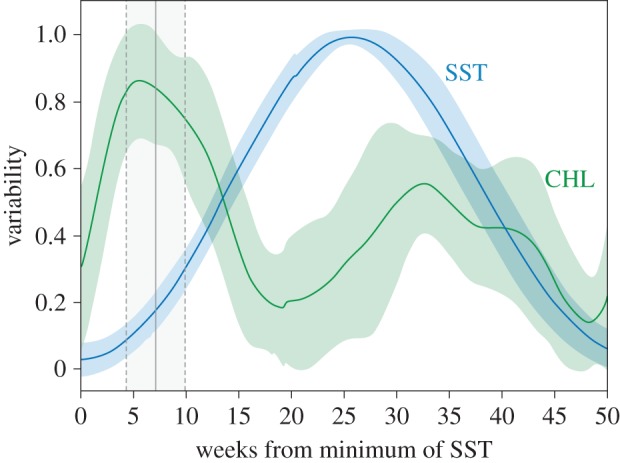
Environmental cycles and little penguin reproduction. Intra-annual trend (mean ± s.d.) for environmental variables (CHL in green and SST in blue) relative to annual minimum values of SST, and subsequently daily averaged. Environmental features were transformed to a non-dimensional variable (variability) ranging from 0 to 1 and indicating the percentage of variation with respect to the intra-annual variation range. Little penguin's laying date (mean and s.d. in grey lines) occurs ca seven weeks after rising SST values and is always enclosed within the annual peak of CHL at the dynamic scale. (Online version in colour.)
4. Discussion
Here, we developed a novel spatio-temporal and dynamic scale to explore marine productivity patterns probably driving reproductive timing in an inshore resident top predator, the little penguin. We provided strong evidence suggesting that little penguins, initially thought to breed in an unpredictable marine environmental [38] within a complex and seasonal nutrient regime [20], were able to fine-tune reproductive timing to high marine productivity patterns derived from large marine areas that included water masses that are probably connected to penguins’ foraging grounds.
Based on marine current movements within a connectivity analysis framework, we determined new regional spatial areas much larger than penguins' local foraging zone when breeding. We use these new areas, the areas of influence, to extract meaningful values of CHL to link with biological data of this top/meso predator (figure 4). To validate our approach, we compared our areas of influence with several incremental fixed areas. As a result, the CHL peak from areas of influence matched with laying date between three and six times better than any other fixed areas (figure 3b). We demonstrated that mean time of laying was enclosed within annual peak of CHL over 11 years of study, when using areas of influence based on dynamic ocean circulation rather than in any fixed spatial scales (figure 3b). Thus, ocean dynamics in the newly determined areas of influence were very robust in determining the actual scale at which seabirds interact with their environment, while fixed areas, a common approach used to derive environmental data in marine animal studies, failed to detect these interactions.
Furthermore, increase in SST within foraging areas was a clear precursor signal indicating marine CHL peaks emerging at areas of influence, thus pointing to its role as the environmental cue triggering reproduction in little penguins (figure 3b). Using mean values derived from the areas of influence, the onset of penguin breeding (laying date) was ca seven weeks after rising of the local SST and felt within the annual peak of marine CHL (figure 6). Thus, SST within penguin foraging range showed marked, repeatable, variable in time but yet predictable annual cycles regardless of the calendar year over the 19 years of this study.
Monthly areas of influence are probably those areas whose waters will take part in transport into Bass Strait and potentially influencing productivity that would eventually reach little penguin foraging zones (electronic supplementary material, figure S4). Areas of influence were composed of two main source areas at the western and eastern sides of Bass Strait. Seasonal eddies and water currents steadily flowing out of Bass Strait lead to a seasonal variability in the limits of probability surfaces (electronic supplementary material, figure S3 and video S1). The extent and influence of currents and water masses vary seasonally and inter-annually in Bass Strait [11]. In accordance with previous oceanographic works at this region, our areas of influence highlighted eastward influence during autumn and winter, whereas areas of influences grow westward during summer [17,39]. This spatio-temporal variability is integrated in our dynamic scale by constructing areas of influence on a monthly basis. CHL of areas of influence inform about the future productivity at local areas and the possibility of prey arriving during the process from primary to secondary production. Further, the observed time-lagged correlation between local SST values and patterns in CHL at derived, dynamic scales (ca seven weeks, figure 5) pointed to SST as the precursor signal to trigger penguin breeding in anticipation to the peaks of marine productivity ahead (figure 6). This period between SST trough and peak CHL would be required by penguins to accomplish their breeding preparation such as physiological (e.g. gonadal preparation [40]) and behavioural (e.g. mate selection [41]) processes leading to reproduction to match the laying period with the annual peak of marine productivity. The relatively constant elapsed time in different breeding processes among individuals found in previous works [21] suggested that inter-annual variability in the onset on reproduction seems not to be influenced by physiological aspects (e.g. sperm storage and delayed ovulation) but by individuals' choice of the right moment to start the reproduction in response to favourable environmental conditions. Our new approach could lead to new insights into animal decisions driven by changes in the complex marine environment.
Most ecological questions require knowledge on the environmental drivers of organisms’ life cycles. Each species experiences the environment on a unique range of scales, according to their own experience and their ability to cope with environmental variability [8,42]. Here, we provide strong evidence suggesting that the effects of dynamism (spatial and temporal) in the environment cannot be neglected when investigating the link between animals and their environment. Our findings suggest that environmental factors in marine ecosystems affecting breeding decisions are related to a much wider region than the ones used in current studies investigating the link between animals' life history and their environment. In turn, while most seabirds are thought to live in an unpredictable environment, our results suggested that marine productivity patterns may be more predictable than previously thought when looking at the appropriate scale. Our approach could offer new insights in processes causing altered conditions under which species have evolved, such as climatic change or overexploitation of fisheries. Environmental cues could in these cases offer a mismatch signal decoupled of historical environmental patterns, with detrimental effects on species survival [6].
Supplementary Material
Acknowledgements
We thank the continued support of the Phillip Island Nature Parks and its staff and volunteers involved in the continuous monitoring of penguins in Phillip Island since 1968. Y.Afán produced the video and improved figures design. Our analysis benefits enormously from earlier discussions with B. Raymond, C. Bulman, B. Fulton, S. Connie, D. Oro, M. Genovart, A. Sanz and M. Louzao, and with the helpful comments of Sara Maxwell and two anonymous reviewers.
Ethics
The monitoring and handling of little penguins over the study span was approved by ethics permits from the Phillip Island Nature Parks Animal Ethics Committee (current number PINP AEC 3.2014) as well as research permits issued by the Department of Environment and Primary Industry of the State of Victoria, Australia (current permit number 10007320).
Authors' contributions
I.A. and F.R. initially designed the study, carried out data and statistical analyses and drafted the manuscript. M.G.F. and A.C. participated in late design of the study, the collection of penguin data, participated in the interpretation of results, helped draft and contributed substantially to revisions of the manuscript. P.D. coordinated the long-term demographic study of penguins. All authors contributed to final revisions.
Competing interests
We declare we have no competing interests.
Funding
This work was supported by research and travel grants from the Australian Academy of Science (AC), Penguin Foundation (Australia) and Junta Andalucía (Spain).
References
- 1.Edwards KF, Litchman E, Klausmeier CA. 2013. Functional traits explain phytoplankton community structure and seasonal dynamics in a marine ecosystem. Ecol. Lett. 16, 56–63. ( 10.1111/ele.12012) [DOI] [PubMed] [Google Scholar]
- 2.Mackas DL, et al. 2012. Changing zooplankton seasonality in a changing ocean: comparing time series of zooplankton phenology. Prog. Oceanogr. 97–100, 31–62. ( 10.1016/j.pocean.2011.11.005) [DOI] [Google Scholar]
- 3.Hipfner JM. 2008. Matches and mismatches: ocean climate, prey phenology and breeding success in a zooplanktivorous seabird. Mar. Ecol. Prog. Ser. 368, 295–304. ( 10.3354/meps07603) [DOI] [Google Scholar]
- 4.Frederiksen M, Edwards M, Richardson AJ, Halliday NC, Wanless S. 2006. From plankton to top predators: bottom-up control of a marine food web across four trophic levels. J. Anim. Ecol. 75, 1259–1268. ( 10.1111/j.1365-2656.2006.01148.x) [DOI] [PubMed] [Google Scholar]
- 5.Durant JM, Anker-Nilssen T, Hjermann DØ, Stenseth NC. 2004. Regime shifts in the breeding of an Atlantic puffin population. Ecol. Lett. 7, 388–394. ( 10.1111/j.1461-0248.2004.00588.x) [DOI] [Google Scholar]
- 6.Visser ME, Both C. 2005. Shifts in phenology due to global climate change: the need for a yardstick. Proc. R. Soc. B 272, 2561–2569. ( 10.1098/rspb.2005.3356) [DOI] [PMC free article] [PubMed] [Google Scholar]
- 7.Reed TE, Warzybok P, Wilson AJ, Bradley RW, Wanless S, Sydeman WJ. 2009. Timing is everything: flexible phenology and shifting selection in a colonial seabird. J. Anim. Ecol. 78, 376–387. ( 10.1111/j.1365-2656.2008.01503.x) [DOI] [PubMed] [Google Scholar]
- 8.Wiens JA. 1989. Spatial scaling in ecology. Funct. Ecol. 3, 385–397. ( 10.2307/2389612) [DOI] [Google Scholar]
- 9.Catry T, Ramos JA, Catry I, Monticelli D, Granadeiro JP. 2013. Inter-annual variability in the breeding performance of six tropical seabird species: influence of life-history traits and relationship with oceanographic parameters. Mar. Biol. 160, 1189–1201. ( 10.1007/s00227-013-2171-2) [DOI] [Google Scholar]
- 10.Grémillet D, et al. 2008. Spatial match–mismatch in the Benguela upwelling zone: should we expect chlorophyll and sea-surface temperature to predict marine predator distributions? J. Appl. Ecol. 45, 610–621. ( 10.1111/j.1365-2664.2007.01447.x) [DOI] [Google Scholar]
- 11.Sidhu LA, Dann P, Chambers L, Catchpole EA. 2012. Seasonal ocean temperature and the survival of first-year little penguins Eudyptula minor in south-eastern Australia. Mar. Ecol. Prog. Ser. 454, 263–272. ( 10.3354/meps09709) [DOI] [Google Scholar]
- 12.Adrian R, Gerten D, Huber V, Wagner C, Schmidt SR. 2012. Windows of change: temporal scale of analysis is decisive to detect ecosystem responses to climate change. Mar. Biol. 159, 2533–2542. ( 10.1007/s00227-012-1938-1) [DOI] [Google Scholar]
- 13.Wheatley M, Johnson C. 2009. Factors limiting our understanding of ecological scale. Ecol. Complex 6, 150–159. ( 10.1016/j.ecocom.2008.10.011) [DOI] [Google Scholar]
- 14.Chave J. 2013. The problem of pattern and scale in ecology: what have we learned in 20 years? Ecol. Lett. 16, 4–16. ( 10.1111/ele.12048) [DOI] [PubMed] [Google Scholar]
- 15.Cullen JM, Chambers LE, Coutin PC, Dann P. 2009. Predicting onset and success of breeding in little penguins Eudyptula minor from ocean temperatures. Mar. Ecol. Prog. Ser. 378, 269–278. ( 10.3354/meps07881) [DOI] [Google Scholar]
- 16.Shealer DA, Schreiber E, Burger J. 2002. Foraging behavior and food of seabirds. In Biology of marine birds (eds J Burger, EA Schreiber), pp. 137–177. Boca Raton, FL: CRC Press. [Google Scholar]
- 17.Condie SA, Mansbridge JV, Cahill ML. 2011. Contrasting local retention and cross-shore transports of the East Australian Current and the Leeuwin Current and their relative influences on the life histories of small pelagic fishes. Deep-Sea Res. II 58, 606–615. ( 10.1016/j.dsr2.2010.06.003) [DOI] [Google Scholar]
- 18.Boersma PD, Rebstock GA, Frere E, Moore SE. 2009. Following the fish: penguins and productivity in the South Atlantic. Ecol. Monogr. 79, 59–76. ( 10.1890/06-0419.1) [DOI] [Google Scholar]
- 19.Frederiksen M, Harris PM, Daunt F, Rothery P, Wanless S. 2004. Scale-dependent climate signals drive breeding phenology of three seabird species. Glob. Change Biol. 10, 1214–1221. ( 10.1111/j.1365-2486.2004.00794.x) [DOI] [Google Scholar]
- 20.Gibbs C, Tomczak M, Jr, Longmore A. 1986. The nutrient regime of Bass Strait. Mar. Freshw. Res. 37, 451–466. ( 10.1071/MF9860451) [DOI] [Google Scholar]
- 21.Chiaradia A, Kerry KR. 1999. Daily nest attendance and breeding performance in the little penguin Eudyptula minor at Phillip Island, Australia. Mar. Ornithol. 27, 13–20. [Google Scholar]
- 22.Chiaradia A, Nisbet IC. 2006. Plasticity in parental provisioning and chick growth in little penguins Eudyptula minor in years of high and low breeding success. Ardea 94, 257–270. [Google Scholar]
- 23.Nisbet IC, Dann P. 2009. Reproductive performance of little penguins Eudyptula minor in relation to year, age, pair-bond duration, breeding date and individual quality. J. Avian Biol. 40, 296–308. ( 10.1111/j.1600-048X.2008.04563.x) [DOI] [Google Scholar]
- 24.Hoskins AJ, Dann P, Ropert-Coudert Y, Kato A, Chiaradia A, Costa DP, Arnould JP. 2008. Foraging behaviour and habitat selection of the little penguin Eudyptula minor during early chick rearing in Bass Strait, Australia. Mar. Ecol. Prog. Ser. 366, 293–303. ( 10.3354/meps07507) [DOI] [Google Scholar]
- 25.Casey KS, Brandon TB, Cornillon P, Evans R. 2010. The past, present and future of the AVHRR pathfinder SST program. In Oceanography from space: revisited (eds Barale V, Gower JFR, Alberotanza L.), pp. 273–287. Dordrecht, The Netherlands: Springer. [Google Scholar]
- 26.Roberts JJ, Best BD, Dunn DC, Treml EA, Halpin PN. 2010. Marine geospatial ecology tools: an integrated framework for ecological geoprocessing with ArcGIS, Python, R, MATLAB, and C++. Environ. Modell. Softw. 25, 1197–1207. ( 10.1016/j.envsoft.2010.03.029) [DOI] [Google Scholar]
- 27.McRae BH, Dickson BG, Keitt TH, Shah VB. 2008. Circuit theory to model connectivity in ecology, evolution, and conservation. Ecology 89, 2712–2724. ( 10.1890/07-1861.1) [DOI] [PubMed] [Google Scholar]
- 28.Treml E, Halpin P, Urban D, Pratson L. 2008. Modeling population connectivity by ocean currents, a graph-theoretic approach for marine conservation. Landsc. Ecol. 23, 19–36. ( 10.1007/s10980-007-9138-y) [DOI] [Google Scholar]
- 29.McRae BH, Beier P. 2007. Circuit theory predicts gene flow in plant and animal populations. Proc. Natl Acad. Sci. USA 104, 19 885–19 890. ( 10.1073/pnas.0706568104) [DOI] [PMC free article] [PubMed] [Google Scholar]
- 30.Rayfield B, Fortin M-J, Fall A. 2010. Connectivity for conservation: a framework to classify network measures. Ecology 92, 847–858. ( 10.1890/09-2190.1) [DOI] [PubMed] [Google Scholar]
- 31.Lawler J, Ruesch A, Olden J, McRae B. 2013. Projected climate-driven faunal movement routes. Ecol. Lett. 16, 1014–1022. ( 10.1111/ele.12132) [DOI] [PubMed] [Google Scholar]
- 32.Pelletier D, Clark M, Anderson MG, Rayfield B, Wulder MA, Cardille JA. 2014. Applying circuit theory for corridor expansion and management at regional scales: tiling, pinch points, and omnidirectional connectivity. PLoS ONE 9, e84135 ( 10.1371/journal.pone.0084135) [DOI] [PMC free article] [PubMed] [Google Scholar]
- 33.Raymond B, et al. 2010. Shearwater foraging in the Southern Ocean: the roles of prey availability and winds. PLoS ONE 5, e10960 ( 10.1371/journal.pone.0010960) [DOI] [PMC free article] [PubMed] [Google Scholar]
- 34.Cong N, Wang T, Nan H, Ma Y, Wang X, Myneni RB, Piao S. 2013. Changes in satellite-derived spring vegetation green-up date and its linkage to climate in China from 1982 to 2010: a multimethod analysis. Glob. Change Biol. 19, 881–891. ( 10.1111/gcb.12077) [DOI] [PubMed] [Google Scholar]
- 35.Jacquin A, Sheeren D, Lacombe J-P. 2010. Vegetation cover degradation assessment in Madagascar savanna based on trend analysis of MODIS NDVI time series. Int. J. Appl. Earth Observ. Geoinform. 12, S3–S10. ( 10.1016/j.jag.2009.11.004) [DOI] [Google Scholar]
- 36.Chang P, Ji L, Li H. 1997. A decadal climate variation in the tropical Atlantic Ocean from thermodynamic air–sea interactions. Nature 385, 516–518. ( 10.1038/385516a0) [DOI] [Google Scholar]
- 37.R Core Team. 2013. R: A language and environment for statistical computing. Vienna, Austria: R Foundation for Statistical Computing. [Google Scholar]
- 38.Pelletier L, Kato A, Chiaradia A, Ropert-Coudert Y. 2012. Can thermoclines be a cue to prey distribution for marine top predators? A case study with little penguins. PLoS ONE 7, e31768 ( 10.1371/journal.pone.0031768) [DOI] [PMC free article] [PubMed] [Google Scholar]
- 39.Middleton JF, Bye JAT. 2007. A review of the shelf-slope circulation along Australia's southern shelves: Cape Leeuwin to Portland. Prog. Oceanogr. 75, 1–41. ( 10.1016/j.pocean.2007.07.001) [DOI] [Google Scholar]
- 40.Nager RG. 2006. The challenges of making eggs. Ardea 94, 323–346. [Google Scholar]
- 41.Naves LC, Monnat JY, Cam E. 2006. Breeding performance, mate fidelity, and nest site fidelity in a long-lived seabird: behaving against the current? Oikos 115, 263–276. ( 10.1111/j.2006.0030-1299.14883.x) [DOI] [Google Scholar]
- 42.Levin SA. 1992. The problem of pattern and scale in ecology: the Robert H. MacArthur award lecture. Ecology 73, 1943–1967. ( 10.2307/1941447) [DOI] [Google Scholar]
Associated Data
This section collects any data citations, data availability statements, or supplementary materials included in this article.


