

Abstract
Can data from mobile phones be used to observe economic shocks and their consequences at multiple scales? Here we present novel methods to detect mass layoffs, identify individuals affected by them and predict changes in aggregate unemployment rates using call detail records (CDRs) from mobile phones. Using the closure of a large manufacturing plant as a case study, we first describe a structural break model to correctly detect the date of a mass layoff and estimate its size. We then use a Bayesian classification model to identify affected individuals by observing changes in calling behaviour following the plant's closure. For these affected individuals, we observe significant declines in social behaviour and mobility following job loss. Using the features identified at the micro level, we show that the same changes in these calling behaviours, aggregated at the regional level, can improve forecasts of macro unemployment rates. These methods and results highlight promise of new data resources to measure microeconomic behaviour and improve estimates of critical economic indicators.
Keywords: unemployment, computational social science, social networks, mobility, complex systems
1. Introduction
Economic statistics are critical for decision-making by both government and private institutions. Despite their great importance, current measurements draw on limited sources of information, losing precision with potentially dire consequences. The beginning of the Great Recession offers a powerful case study: the initial BEA estimate of the contraction of GDP in the fourth quarter of 2008 was an annual rate 3.8%. The American Recovery and Reinvestment Act (stimulus) was passed based on this understanding in February 2009. Less than two weeks after the plan was passed, that 3.8% figure was revised to 6.2%, and subsequent revisions peg the number at a jaw dropping 8.9%—more severe than the worst quarter during the Great Depression. The government statistics were wrong and may have hampered an effective intervention. As participation rates in unemployment surveys drop, serious questions have been raised as to the declining accuracy and increased bias in unemployment numbers [1].
In this paper, we offer a methodology to infer changes in the macroeconomy in near real time, at arbitrarily fine spatial granularity, using data already passively collected from mobile phones. We demonstrate the reliability of these techniques by studying data from two European countries. In the first, we show it is possible to observe mass layoffs and identify the users affected by them in mobile phone records. We then track the mobility and social interactions of these affected workers and observe that job loss has a systematic dampening effect on their social and mobility behaviour. Having observed an effect in the micro data, we apply our findings to the macroscale by creating corresponding features to predict unemployment rates at the province scale. In the second country, where the macro-level data are available, we show that changes in mobility and social behaviour predict unemployment rates ahead of official reports and more accurately than traditional forecasts. These results demonstrate the promise of using new data to bridge the gap between micro- and macroeconomic behaviours and track important economic indicators. Figure 1 shows a schematic of our methodology.
Figure 1.
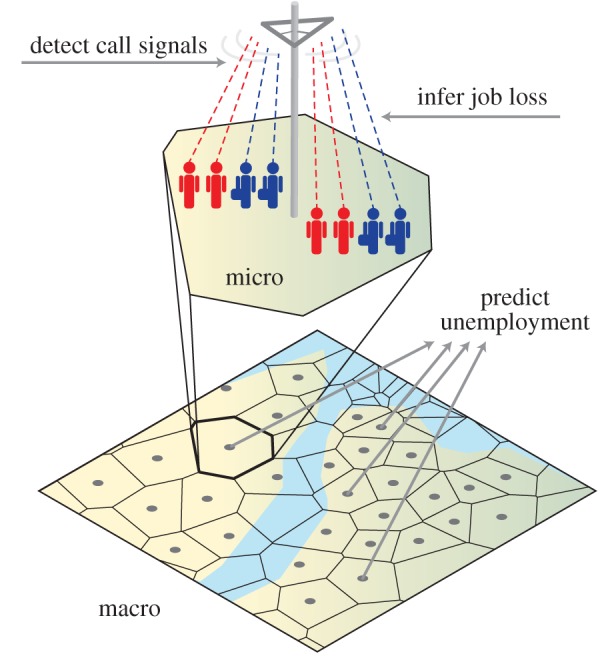
A schematic view of the relationship between job loss and call dynamics. We use the calling behaviour of individuals to infer job loss and measure its effects. We then measure these variables and include them in predictions of unemployment at the macroscale, significantly improving forecasts.
2. Measuring the economy
Contemporary macroeconomic statistics are based on a paradigm of data collection and analysis begun in the 1930s [2,3]. Most economic statistics are constructed from either survey data or administrative records. For example, the US unemployment rate is calculated based on the monthly Current Population Survey of roughly 60 000 households, and the Bureau of Labor Statistics manually collects 80 000 prices a month to calculate inflation. Both administrative databases and surveys can be slow to collect, costly to administer and fail to capture significant segments of the economy. These surveys can quickly face sample size limitations at fine geographies and require strong assumptions about the consistency of responses over time. Statistics inferred from survey methods have considerable uncertainty and are routinely revised in the months following their release as other data are slowly collected [1,4–6]. Moreover, changes in survey methodology can result in adjustments of reported rates of up to 1–2 percentage points [7].
The current survey-based paradigm also makes it challenging to study the effect of economic shocks on networks or behaviour without reliable self-reports. This has hampered scientific research. For example, many studies have documented the severe negative consequences of job loss in the form of difficulties in retirement [8], persistently lower wages following re-employment including even negative effects on children's outcomes [9,10], increased risk of death and illness [11,12], higher likelihood of divorce [13], and, unsurprisingly, negative impacts on happiness and emotional well-being [14]. Owing to the cost of obtaining the necessary data, however, social scientists have been unable to directly observe the large negative impact of a layoff on the frequency and stability of an individual's social interactions or mobility.
3. Predicting the present
These shortcomings raise the question as to whether existing methods could be supplemented by large-scale behavioural trace data. There have been substantial efforts to discern important population events from such data, captured by the pithy phrase of, ‘predicting the present’ [15–18]. Prior work has linked news stories with stock prices [19–21] and used web search or social media data to forecast labour markets [22–26], consumer behaviour [27,28], automobile demand, vacation destinations [15,29]. Research on social media, search and surfing behaviour have been shown to signal emerging public health problems [30–37]; although for a cautionary tale see [38]. And recent efforts have even been made towards leveraging Twitter to detect and track earthquakes in real-time detection faster than seismographic sensors [39–41]. While there are nuances to the analytic approaches taken, the dominant approach has been to extract features from some large-scale observational data and to evaluate the predictive (correlation) value of those features with some set of measured aggregate outcomes (such as disease prevalence). Here we offer a twist on this methodology through identification of features from observational data and to cross-validate across individual and aggregate levels.
All of the applications of predicting the future are predicated, in part, on the presence of distinct signatures associated with the systemic event under examination. The key analytic challenge is to identify signals that (i) are observable or distinctive enough to rise above the background din, (ii) are unique or generate few false positives, (iii) contain information beyond well-understood patterns such as calendar-based fluctuations and (iv) are robust to manipulation. Mobile phone data, our focus here, are particularly promising for early detection of systemic events as they combine spatial and temporal comprehensiveness, naturally incorporate mobility and social network information and are too costly to intentionally manipulate.
Data from mobile phones has already proved extremely beneficial to understanding the everyday dynamics of social networks [42–48] and mobility patterns of millions [49–56]. With a fundamental understanding of regular behaviour, it becomes possible to explore deviations caused by collective events such as emergencies [57], natural disasters [58,59] and cultural occasions [60,61]. Less has been done to link these data to economic behaviour. In this paper, we offer a methodology to robustly infer changes to measure employment shocks at extremely high spatial and temporal resolutions and improve critical economic indicators.
4. Data
We focus our analysis at three levels: the individual, the community and the provincial levels. We begin with unemployment at the community (town) level, where we examine the behavioural traces of a large-scale layoff event. At the community and individual levels, we analyse call record data from a service provider with an approximately 15% market share in an undisclosed European country. The community-level dataset spans a 15-month period between 2006 and 2007, with the exception of a six-week gap due to data extraction failures. At the province level, we examine call detail records from a service provider from another European country, with an approximately 20% market share and data running for 36 months from 2006 to 2009. Records in each dataset include an anonymous ID for caller and callee, the location of the tower through which the call was made, and the time the call occurred. In both cases, we examine the universe of call records made over the provider's network (see the electronic supplementary material for more details).
5. Observing unemployment at the community level
We study the closure of an auto-parts manufacturing plant (the plant) that occurred in December 2006. As a result of the plant closure, roughly 1100 workers lost their jobs in a small community (the town) of 15 000. Our approach builds on recent papers [52–54,57] that use call record data to measure social and mobility patterns.
There are three mobile phone towers within close proximity of the town and the plant. The first is directly within the town, the second is roughly 3 km from the first and is geographically closest to the manufacturing plant, while the third is roughly 6.5 km from the first two on a nearby hilltop. In total, these three towers serve an area of roughly 220 km2 of which only 6 km2 is densely populated. There are no other towns in the region covered by these towers. Because the exact tower through which a call is routed may depend on factors beyond simple geographical proximity (e.g. obstructions due to buildings), we consider any call made from these three towers as having originated from the town or plant.
We model the pre-closure daily population of the town as made up of a fraction of individuals γ who will no longer make calls near the plant following its closure and the complimentary set of individuals who will remain (1 − γ). As a result of the layoff, the total number of calls made near the plant will drop by an amount corresponding to the daily calls of workers who are now absent. This amounts to a structural break model that we can use to estimate the prior probability that a user observed near the plant was laid off, the expected drop in calls that would identify them as an affected worker and the time of the closure (see the electronic supplementary material for full description of this model). We suspect that some workers laid off from the plant are residents of the town, and thus they will still appear to make regular phone calls from the three towers and will not be counted as affected. Even with this limitation, we find a large change in behaviour.
To verify the date of the plant closing, we sum the number of daily calls from 1955 regular users (i.e. those who make at least one call from the town each month prior to the layoff) connecting through towers geographically proximate to the affected plant. The estimator selects a break date, tlayoff, and pre- and post-break daily volume predictions to minimize the squared deviation of the model from the data. The estimated values are overlaid on daily call volume and the actual closure date in figure 2a. As is evident in the figure, the timing of the plant closure (as reported in newspapers and court filings) can be recovered statistically using this procedure—the optimized predictions display a sharp and significant reduction at this date. As a separate check to ensure this method is correctly identifying the break date, we estimate the same model for calls from each individual user i and find a distribution of these dates  is peaked around the actual layoff date (see the electronic supplementary material, figure S1).
Figure 2.
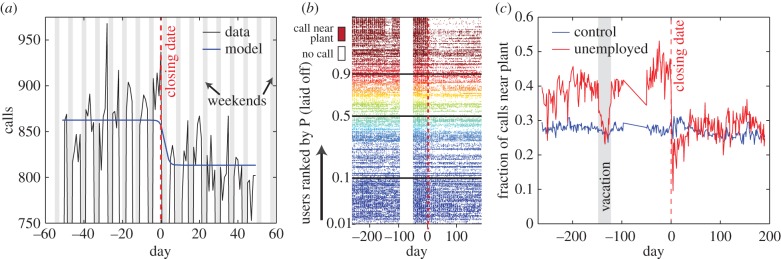
Identifying the layoff date. (a) Total aggregate call volume (black line) from users who make regular calls from towers near the plant is plotted against our model (blue). The model predicts a sudden drop in aggregate call volume and correctly identifies the date of the plant closure as the one reported in newspapers and court records. (b) Each of the top 300 users likely to have been laid off is represented by a row where we fill in a day as coloured if a call was made near the plant on that day. White space marks the absence of calls. Rows are sorted by the assigned probability of that user being laid off according to our Bayesian model. Users with high probabilities cease making calls near the plant directly following the layoff. (c) We see a sharp, sustained drop in the fraction of calls made near the plant by users assigned to the top decile in probability of being unemployed (red) while no affect is seen for the control group users believed to be unaffected (blue). Moreover, we see that laid-off individuals have an additional drop off for a two week period roughly 125 days prior the plant closure. This time period was confirmed to be a coordinated vacation for workers providing further evidence we are correctly identifying laid-off workers.
6. Observing unemployment at the individual level
To identify users directly affected by the layoff, we calculate Bayesian probability weights based on changes in mobile phone activity. For each user, we calculate the conditional probability that a user is a non-resident worker laid off as part of the plant closure based on their observed pattern of calls. To do this, we compute the difference in the fraction of days on which a user made a call near the plant in 50 days prior to the week of the layoff. We denote this difference as Δq = qpre − qpost. We consider each user's observed difference a single realization of a random variable, Δq. Under the hypothesis that there is no change in behaviour, the random variable Δq is distributed  Under the alternative hypothesis, the individual's behaviour changes pre- and post-layoff, the random variable Δq is distributed
  where d is the mean reduction in calls from the plant for non-resident plant workers laid off when the plant was closed. We assign user i the following probability of having been laid off given his or her calling pattern:
| 6.1 |
Calculating the probabilities requires two parameters, γ, our prior that an individual is a non-resident worker at the affected plant and d, the threshold we use for the alternative hypothesis. The values of γ = 5.8% and d = 0.29 are determined based on values fit from the model in the previous section.
6.1. Validating the layoff
On an individual level, figure 2b shows days on which each user makes a call near the plant ranked from highest to lowest probability weight (only the top 300 users are shown, see the electronic supplementary material, figure S2 for more users). Users highly suspected of being laid off demonstrate a sharp decline in the number of days they make calls near the plant following the reported closure date. While we do not have ground-truth evidence that any of these mobile phone users was laid off, we find more support for our hypothesis by examining a two-week period roughly 125 days prior to the plant closure. Figure 2c shows a sharp drop in the fraction of calls coming from this plant for users identified as laid-off post-closure. This period corresponds to a confirmed coordinated holiday for plant workers and statistical analysis confirms a highly significant break for individuals classified as plant workers in the layoff for this period. Given that we did not use call data from this period in our estimation of the Bayesian model, this provides strong evidence that we are correctly identifying the portion of users who were laid off by this closure. In aggregate, we assign 143 users probability weights between 50 and 100%. This represents 13% of the pre-closure plant workforce and compares closely with the roughly 15% national market share of the service provider.
7. Assessing the effect of unemployment at the individual level
We now turn to analysing behavioural changes associated with job loss at the individual level. We first consider six quantities related to the monthly social behaviour: (i) total calls, (ii) number of incoming calls, (iii) number of outgoing calls, (iv) calls made to individuals physically located in the town of the plant (as a proxy for contacts made at work), (v) number of unique contacts and (vi) the fraction of contacts called in the previous month that were not called in the current month, referred to as churn. In addition to measuring social behaviour, we also quantify changes in three metrics related to mobility: (vii) number of unique locations visited, (viii) radius of gyration and (xi) average distance from most visited tower (see the electronic supplementary material for detailed definitions of these variables). To guard against outliers such as long trips for vacation or difficulty identifying important locations due to noise, we only consider months for users where more than five calls were made and locations where a user recorded more than three calls.
We measure changes in these quantities using all calls made by each user (not just those near the plant) relative to months prior to the plant closure, weighting measurements by the probability an individual is laid off and relative to two reference groups: individuals who make regular calls from the town but were not believed to be laid off (mathematically we weight this group using the inverse weights from our Bayesian classifier) and a random sample of 10 000 mobile phone users throughout the country (all users in this sample are weighted equally).
Figure 3a–i shows monthly point estimates of the average difference between relevant characteristics of users believed to be laid off compared to control groups. This figure shows an abrupt change in variables in the month directly following the plant closure. Despite this abrupt change, data at the individual level are sufficiently noisy that the monthly point estimates are not significantly different from 0 in every month. However, when data from months pre- and post-layoff are pooled, these differences are robust and statistically significant. The right panel of figure 3 and electronic supplementary material, table I show the results of OLS regressions comparing the pre- and post-closure periods for laid-off users relative to the two reference groups (see the electronic supplementary material for detailed model specification as well as confidence intervals for per cent changes pre- and post-layoff for each variable). The abrupt and sustained change in monthly behaviour of individuals with a high probability of being laid off is compelling evidence in support of using mobile phones to detect mass layoffs with mobile phones.
Figure 3.

Changes in social networks and mobility following layoffs. We quantify the effect of mass layoffs relative to two control groups: users making regular calls from the town, who were not identified as laid off and a random sample of users from the rest of the country. We report monthly point estimates for six social and three mobility behaviours: (a) total calls, (b) number of incoming calls, (c) number of outgoing calls, (d) fraction of calls to individuals in the town at the time of the call, (e) number of unique contacts, (f) the fraction of individuals called in the previous month who were not called in the current month (churn), (g) number of unique towers visited, (h) radius of gyration, (i) average distance from most visited tower. Pooling months pre- and post-layoff yield statistically significant changes in monthly social network and mobility metrics following a mass layoff. (j) Reports regression coefficient for each of our nine dependent variables along with the 66 and 95% CIs.
We find that the total number of calls made by laid-off individuals drops 51% and 41% following the layoff when compared with non-laid-off residents and random users, respectively. Moreover, this drop is asymmetric. The number of outgoing calls decreases by 54% compared to a 41% drop in incoming calls (using non-laid-off residents as a baseline). Similarly, the number of unique contacts called in months following the closure is significantly lower for users likely to have been laid off. The fraction of calls made by a user to someone physically located in the town drops 4.7 percentage points for laid-off users compared with residents of the town who were not laid off. Finally, we find that the month-to-month churn of a laid-off person's social network increases roughly 3.6 percentage points relative to control groups. These results suggest that a user's social interactions see significant decline and that their networks become less stable following job loss. This loss of social connections may amplify the negative consequences associated with job loss observed in other studies.
For our mobility metrics, we find that the number of unique towers visited by laid-off individuals decreases 17% and 20% relative to the random sample and town sample, respectively. Radius of gyration falls by 20% and 22% while the average distance a user is found from the most visited tower also decrease decreases by 26% relative to reference groups. These changes reflect a general decline in the mobility of individuals following job loss, another potential factor in long-term consequences.
8. Observing unemployment at the province level
The relationship between mass layoff events and these features of CDRs suggests a potential for predicting important, large-scale unemployment trends based on the population's call information. Provided the effects of general layoffs and unemployment are similar enough to those due to mass layoffs, it may be possible to use observed behavioural changes as additional predictors of general levels of unemployment. To perform this analysis, we use another CDR dataset covering approximately 10 million subscribers in a different European country, which has been studied in prior work [44,45,52–54,57]. This country experienced enormous macroeconomic disruptions, the magnitude of which varied regionally during the period in which the data are available. We supplement the CDR dataset with quarterly, province-level unemployment rates from the EU Labor Force Survey, a large sample survey providing data on regional economic conditions within the EU (see the electronic supplementary material for additional details).
We compute seven aggregated measures identified in the previous section: call volume, incoming calls, outgoing calls, number of contacts, churn, number of towers and radius of gyration. Distance from home was omitted due to strong correlation with radius of gyration, while calls to the town were omitted because it is not applicable in a different country. For reasons of computational cost, we first take a random sample of 3000 mobile phone users for each province. The sample size was determined to ensure the estimation feature values are stable (see the electronic supplementary material, figure S6 for details). We then compute the seven features aggregated per month for each individual user. The kth feature value of user i at month t is denoted as yi,t,k and we compute month over month changes in this quantity as 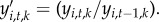 A normalized feature value for a province s is computed by averaging all users in selected province
 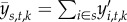 . In addition, we use percentiles of the bootstrap distribution to compute the 95% CI for the estimated feature value.
After aggregating these metrics to the province level, we assess their power to improve predictions of unemployment rates. Note that we do not attempt to identify mass layoffs in this country. Instead, we look for behavioural changes that may have been caused by layoffs and see whether these changes are predictive of general unemployment statistics. First, we correlate each aggregate measure with regional unemployment separately, finding significant correlations in the same direction as was found for individuals (see the electronic supplementary material, table II). We also find the strong correlations between calling behaviour variables, suggesting that principal component analysis (PCA) can reasonably be used to construct independent variables that capture changes in calling behaviour while guarding against colinearity. The first principal component, with an eigenvalue of 4.10, captures 59% of the variance in our data and is the only eigenvalue that satisfies the Kaiser criterion. The loadings in this component are strongest for social variables. Additional details on the results of PCA can be found in the electronic supplementary material, tables III and IV. Finally, we compute the scores for the first component for each observation and build a series of models that predict quarterly unemployment rates in provinces with and without the inclusion of this representative mobile phone variable.
First, we predict the present by estimating a regression of a given quarter's unemployment on calling behaviour in that quarter (e.g. using phone data from Q1 to predict unemployment in Q1). As phone data are available the day a quarter ends, this method can produce predictions weeks before survey results are tabulate and released. Next, we predict the future in a more traditional sense by estimating a regression on a quarter's surveyed unemployment rate using mobile phone data from last quarter as a leading indicator (e.g. phone metrics from Q1 to predict unemployment rates in Q2). This method can produce more predictions months before surveys are even conducted. See the electronic supplementary material, figure S3 for a detailed timeline of data collection, release and prediction periods. We have eight quarters of unemployment data for 52 provinces. We make and test our predictions by training our models on half of the provinces and cross-validate by testing on the other half. The groups are then switched to generate out of sample predictions for all provinces. Prediction results for an AR1 model that includes a CDR variable are plotted against actual unemployment rates in figure 4. We find strong correlation coefficients between predictions of predictions of present unemployment rates (ρ = 0.95) as well as unemployment rates one-quarter in the future (ρ = 0.85).
Figure 4.
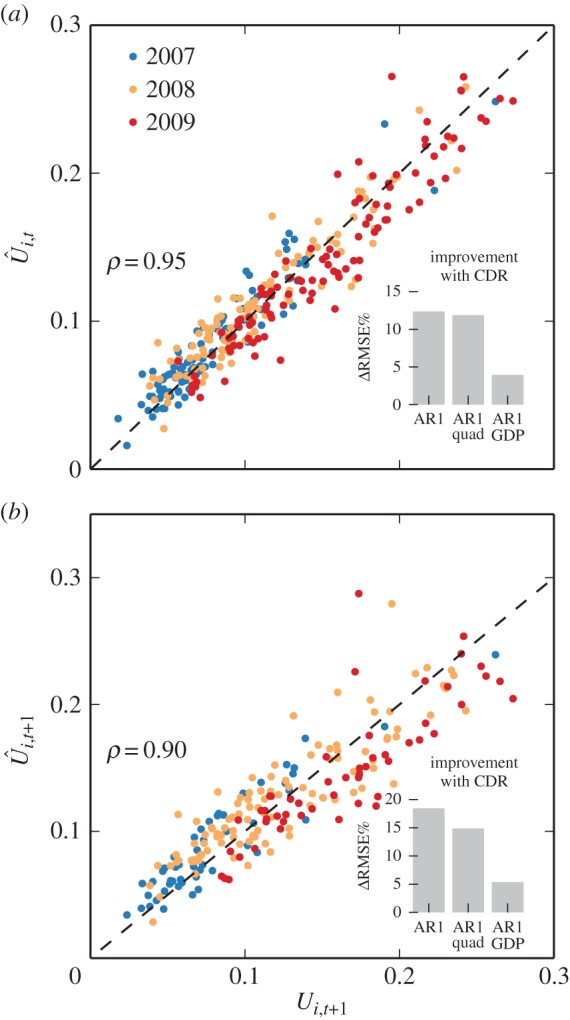
Predicting unemployment rates using mobile phone data. We demonstrate that aggregating measurements of mobile phone behaviours associated with unemployment at the individual level also predicts unemployment rates at the province level. To make our forecasts, we train various models on data from half of the provinces and use these coefficients to predict the other half. (a) Compares predictions of present unemployment rates to observed rates and (b) shows predictions of unemployment one-quarter ahead using an AR1 model that includes covariates of behaviours measured using mobile phones. Both predictions correlate strongly with actual values while changes in rates are more difficult to predict. The insets show the per cent improvement to the RMSE of predictions when mobile phone covariates are added to various baseline model specifications. In general, the inclusion of mobile phone data reduces forecast errors by 5–20%.
As advocated in [38], it is important to benchmark these type of prediction algorithms against standard forecasts that use existing data. Previous work has shown that the performance of most unemployment forecasts is poor and that simple linear models routinely outperform complicated nonlinear approaches [62–65] and the dynamic stochastic general equilibrium (DSGE) models aimed at stimulating complex macroeconomic interactions [66,67]. With this in mind, we compare predictions made with and without mobile phone covariates using three different model specifications: AR1, AR1 with a quadratic term (AR1 Quad), AR1 with a lagged national GDP covariate (AR1 GDP). In each of these model specifications, the coefficient related to the principal component CDR score is highly significant and negative as expected given that the loadings weigh heavily on social variables that declined after a mass layoff (see the electronic supplementary material, tables V and VI regression results). Moreover, adding metrics derived from mobile phone data significantly improves forecast accuracy for each model and reduces the RMSE of unemployment rate predictions by between 5 and 20% (see inserts in figure 4). As additional checks that we are capturing true improvements, we use mobile phone data from only the first half of each quarter (before surveys are even conducted) and still achieve a 3–10% improvement in forecasts. These results hold even when variants are run to include quarterly and province level fixed effects (see the electronic supplementary material, tables VII and VIII).
In summary, we have shown that features associated with job loss at the individual level are similarly correlated with province level changes in unemployment rates in a separate country. Moreover, we have demonstrated the ability of massive, passively collected data to identify salient features of economic shocks that can be scaled up to measure macroeconomic changes. These methods allow us to predict ‘present’ unemployment rates two-to-eight weeks prior to the release of traditional estimates and predict ‘future’ rates up to four months ahead of official reports more accurately than using historical data alone.
9. Discussion
We have presented algorithms capable of identifying employment shocks at the individual, community and societal scales from mobile phone data. These findings have great practical importance, potentially facilitating the identification of macroeconomic statistics with much finer spatial granularity and faster than traditional methods of tracking the economy. We can not only improve estimates of the current state of the economy and provide predictions faster than traditional methods, but also predict future states and correct for current uncertainties. Moreover, with the quantity and richness of these data increasing daily, these results represent conservative estimates of its potential for predicting economic indicators. The ability to get this information weeks to months faster than traditional methods is extremely valuable to policy and decision-makers in public and private institutions. Further, it is likely that CDR data are more robust to external manipulation and less subject to service provider algorithmic changes than most social media [38]. But, just as important, the micro nature of these data allow for the development of new empirical approaches to study the effect of economic shocks on interrelated individuals.
While this study highlights the potential of new data sources to improve forecasts of critical economic indicators, we do not view these methods as a substitute for survey-based approaches. Though data quantity is increased by orders of magnitude with the collection of passively generated data from digital devices, the price of this scale is control. The researcher no longer has the ability to precisely define which variables are collected, how they are defined, when data collection occurs making it much harder to insure data quality and integrity. In many cases, data are not collected by the researcher at all and are instead first pre-processed by the collector, introducing additional uncertainties and opportunities for contamination. Moreover, data collection itself is now conditioned on who has specific devices and services, introducing potential biases due to economic access or sorting. If policy decisions are based solely on data derived from smartphones, the segment of the population that cannot afford these devices may be underserved.
Surveys, on the other hand, provide the researcher far more control to target specific groups, ask precise questions and collect rich covariates. Though the expense of creating, administering and participating in surveys makes it difficult to collect data of the size and frequency of newer data sources, they can provide far more context about participants. This work demonstrates the benefits of both data gathering methods and shows that hybrid models offer a way to leverage the advantages of each. Traditional survey-based forecasts are improved here, not replaced, by mobile phone data. Moving forward, we hope to see more such hybrid approaches. Projects such as the Future Mobility Survey [68] and the MIT Reality Mining project [24] bridge this gap by administering surveys via mobile devices, allowing for the collection of process generated data as well as survey-based data. These projects open the possibility to directly measure the correlation between data gathered by each approach.
The macroeconomy is the complex concatenation of interdependent decisions of millions of individuals [69]. To have a measure of the activity of almost every individual in the economy, of their movements and their connections should transform our understanding of the modern economy. Moreover, the ubiquity of such data allows us to test our theories at scales large and small and all over the world with little added cost. We also note potential privacy and ethical issues regarding the inference of employment/unemployment at the individual level, with potentially dire consequences for individuals’ access, for example, to financial markets. With the behaviour of billions being volunteered, captured and stored at increasingly high resolutions, these data present an opportunity to shed light on some of the biggest problems facing researchers and policy-makers alike, but also represent an ethical conundrum typical of the ‘big data’ age.
Supplementary Material
Authors' Contributions
J.L.T., Y-R.L., D.S., E.M. and D.L. designed and performed data analysis and wrote the paper. M.C.G. provided data and edited the paper.
Competing Interests
We declare we have no competing interests.
Funding
J.L.T. received funding from the National Science Foundation Graduate Research Fellowship Program (NSF GRFP). D.L. acknowledges support from the Defense Threat Reduction Agency (grant no.: HDTRA1-10-1-0100/BRBAA08-Per4-C-2-0033). The views expressed in this paper are the authors' alone.
References
- 1.Krueger A, Mas A, Niu X. 2014. The evolution of rotation group bias: will the real unemployment rate please stand up? Technical Report, National Bureau of Economic Research.
- 2.Marcuss D, Kane RE.2007. US national income and product statistics born of the great depression and World War II. Technical Report, Bureau of Economic Analysis.
- 3.Card D. 2011. Origins of the unemployment rate: the lasting legacy of measurement without theory. Am. Econ. Rev. 101, 552–557. ( 10.1257/aer.101.3.552) [DOI] [Google Scholar]
- 4.Hausman J, Leibtag E. 2014. CPI bias from supercenters: does the BLS know that Wal-Mart exists? Technical Report, National Bureau of Economic Research.
- 5.Jones SRG, Riddell WC. 1999. The measurement of unemployment: an empirical approach. Econometrica 67, 147–162. ( 10.1111/1468-0262.00007) [DOI] [Google Scholar]
- 6.Burda MC, Hamermesh DS, Stewart J. 2012. Cyclical variation in labor hours and productivity using the ATUS. Technical Report, National Bureau of Economic Research.
- 7.Tiller R, Welch M. 1994. Predicting the national unemployment rate that the ‘old’ CPS would have produced. In Proc. Section on Survey Research Methods, Toronto, Canada. Boston, MA: American Statistical Association. [Google Scholar]
- 8.Chan S, Stevens AH. 1999. Employment and retirement following a late-career job loss. Am. Econ. Rev. 89, 211–216. ( 10.1257/aer.89.2.211) [DOI] [Google Scholar]
- 9.Ruhm CJ. 1991. Are workers permanently scarred by job displacements? Am. Econ. Rev. 81, 319–324. [Google Scholar]
- 10.Oreopoulos P, Page M, Stevens AH. 2008. The intergenerational effects of worker displacement. J. Labor Econ. 26, 455 ( 10.1086/588493) [DOI] [Google Scholar]
- 11.Sullivan D, Von Wachter T. 2009. Job displacement and mortality: an analysis using administrative data. Q. J. Econ. 124, 1265–1306. ( 10.1162/qjec.2009.124.3.1265) [DOI] [Google Scholar]
- 12.Classen TJ, Dunn RA. 2012. The effect of job loss and unemployment duration on suicide risk in the United States: a new look using mass-layoffs and unemployment duration. Health Econ. 21, 338–350. ( 10.1002/hec.1719) [DOI] [PMC free article] [PubMed] [Google Scholar]
- 13.Charles KK, Stephens M., Jr 2001. Job displacement, disability, and divorce. Technical Report, National Bureau of Economic Research.
- 14.Krueger AB, Mueller A, Davis SJ, Sahin A. 2011. Job search, emotional well-being, and job finding in a period of mass unemployment: evidence from high frequency longitudinal data [with comments and discussion]. Brookings Papers on Economic Activity pp. 1–81.
- 15.Choi H, Varian H. 2009. Predicting initial claims for unemployment benefits. Google Inc. pp. 1–5.
- 16.Vespignani A. 2009. Predicting the behavior of techno-social systems. Science 325, 425–428. ( 10.1126/science.1171990) [DOI] [PubMed] [Google Scholar]
- 17.Lazer D, et al. 2009. Computational social science. Science 323, 721–723. ( 10.1126/science.1167742) [DOI] [PMC free article] [PubMed] [Google Scholar]
- 18.Henderson JV, Storeygard A, Weil DN. 2012. Measuring economic growth from outerspace. Am. Econ. Rev. 102, 994–1028. ( 10.1257/aer.102.2.994) [DOI] [PMC free article] [PubMed] [Google Scholar]
- 19.Hayo B, Kutan AM. 2005. The impact of news, oil prices, and global market developments on Russian financial markets. Econ. Trans. 13, 373–393. ( 10.1111/j.1468-0351.2005.00214.x) [DOI] [Google Scholar]
- 20.Lavrenko V, et al. 2000. Mining of concurrent text and time series. In KDD-2000 Workshop on Text Mining, Citeseer, 2000, pp. 37–44. [Google Scholar]
- 21.Schumaker RP, Chen H. 2009. Textual analysis of stock market prediction using breaking financial news: the AZFin text system. ACM Trans. Inform. Syst. (TOIS) 27, 12 ( 10.1145/1462198.1462204) [DOI] [Google Scholar]
- 22.Ettredge M, Gerdes J, Karuga G. 2005. Using web-based search data to predict macroeconomic statistics. Commun. ACM 48, 87–92. ( 10.1145/1096000.1096010) [DOI] [Google Scholar]
- 23.Askitas N, Zimmermann KF. 2009. Google econometrics and unemployment forecasting. Appl. Econ. Q. 55, 107–120. ( 10.3790/aeq.55.2.107) [DOI] [Google Scholar]
- 24.Eagle N, Pentland A. 2006. Reality mining: sensing complex social systems. Pers. Ubiquitous Comput. 10, 255–268. ( 10.1007/s00779-005-0046-3) [DOI] [Google Scholar]
- 25.Suhoy T. 2009. Query indices and a 2008 downturn: Israeli data. Research Department, Bank of Israel. [Google Scholar]
- 26.Antenucci D, Cafarella M, Levenstein M, Ré C, Shapiro MD. 2014. Using social media to measure labor market flows. Technical Report, National Bureau of Economic Research.
- 27.Goel S, Hofman JM, Lahaie S, Pennock DM, Watts DJ. 2010. Predicting consumer behavior with Web search. Proc. Natl Acad. Sci. USA 107, 17 486–17 490. ( 10.1073/pnas.1005962107) [DOI] [PMC free article] [PubMed] [Google Scholar]
- 28.Gelman M, Kariv S, Shapiro MD, Silverman D, Tadelis S. 2014. Harnessing naturally occurring data to measure the response of spending to income. Science 345, 212–215. ( 10.1126/science.1247727) [DOI] [PMC free article] [PubMed] [Google Scholar]
- 29.Choi H, Varian H. 2012. Predicting the present with Google trends. Econ. Rec. 88, 2–9. ( 10.1111/j.1475-4932.2012.00809.x) [DOI] [Google Scholar]
- 30.Ginsberg J, Mohebbi MH, Patel RS, Brammer L, Smolinski MS, Brilliant L. 2008. Detecting influenza epidemics using search engine query data. Nature 457, 1012–1014. ( 10.1038/nature07634) [DOI] [PubMed] [Google Scholar]
- 31.Aramaki E, Maskawa S, Morita M. 2011. Twitter catches the flu: detecting influenza epidemics using Twitter. In Proc. Conference on Empirical Methods in Natural Language Processing, Association for Computational Linguistics, Edinburgh, UK, 27–29 July 2011, pp. 1568–1576. [Google Scholar]
- 32.Chew C, Eysenbach G. 2010. Pandemics in the age of Twitter: content analysis of Tweets during the 2009 H1N1 outbreak. PLoS ONE 5, e14118 ( 10.1371/journal.pone.0014118) [DOI] [PMC free article] [PubMed] [Google Scholar]
- 33.Culotta A. 2010. Towards detecting influenza epidemics by analyzing Twitter messages. In Proc. First Workshop on Social Media Analytics, Washington DC, July, pp. 115–122. New York, NY: ACM [Google Scholar]
- 34.Gomide J, et al. 2011. Dengue surveillance based on a computational model of spatio-temporal locality of Twitter. In Proc. 3rd International Web Science Conference, 3, Koblenz, Germany, June New York, NY: ACM. [Google Scholar]
- 35.de Quincey E, Kostkova P. 2010. Early warning and outbreak detection using social networking websites: the potential of twitter. In Electronic healthcare (ed. P Kostkova), pp. 21–24. Berlin, Germany: Springer. [Google Scholar]
- 36.Zamite JA, Silva FAB, Couto F, Silva MJ. 2011. MEDCollector: multisource epidemic data collector. In Transactions on large-scale data-and knowledge-centered systems IV (eds A Hameurlain, J Küng, R Wagner, C Böhm, J Eder, C Plant), pp. 40–72. Berlin, Germany: Springer. [Google Scholar]
- 37.Signorini A, Segre AM, Polgreen PM. 2011. The use of Twitter to track levels of disease activity and public concern in the US during the influenza A H1N1 pandemic. PLoS ONE 6, e19467 ( 10.1371/journal.pone.0019467) [DOI] [PMC free article] [PubMed] [Google Scholar]
- 38.Lazer D, Kennedy R, King G, Vespignani A. 2014. Big data. The parable of Google Flu: traps in big data analysis. Science 343, 1203–1205. ( 10.1126/science.1248506) [DOI] [PubMed] [Google Scholar]
- 39.Sakaki T, Okazaki M, Matsuo Y. 2010. Earthquake shakes twitter users: real-time event detection by social sensors. In Proc. 19th Int. Conf. on World Wide Web, Raleigh, NC, April New York, NY: ACM. [Google Scholar]
- 40.Guy M, Earle P, Ostrum C, Gruchalla K, Horvath S. 2010. Integration and dissemination of citizen reported and seismically derived earthquake information via social network technologies. In Advances in intelligent data analysis IX (eds PR Cohen, NM Adams, MR Berthold), pp. 42–53. Berlin, Germany: Springer. [Google Scholar]
- 41.Earle P, Bowden D, Guy M. 2012. Twitter earthquake detection: earthquake monitoring in a social world. Ann. Geophys. 54, 708–715. [Google Scholar]
- 42.Barabási A-L. 2005. The origin of bursts and heavy tails in human dynamics. Nature 435, 207–211. ( 10.1038/nature03459) [DOI] [PubMed] [Google Scholar]
- 43.Rybski D, Buldyrev SV, Havlin S, Liljeros F, Makse HA. 2009. Scaling laws of human interaction activity. Proc. Natl Acad. Sci. USA 106, 12 640–12 645. ( 10.1073/pnas.0902667106) [DOI] [PMC free article] [PubMed] [Google Scholar]
- 44.Onnela J-P, Arbesman S, González MC, Barabási A-L, Christakis NA. 2011. Geographic constraints on social network groups. PLoS ONE 6, 7 ( 10.1371/journal.pone.0016939) [DOI] [PMC free article] [PubMed] [Google Scholar]
- 45.Onnela J-P, et al. 2007. Structure and tie strengths in mobile communication networks. Proc. Natl Acad. Sci. USA 104, 7332–7336. ( 10.1073/pnas.0610245104) [DOI] [PMC free article] [PubMed] [Google Scholar]
- 46.Cho E, Myers SA, Leskovec J. 2011. Friendship and mobility. In Proc. 17th ACM SIGKDD Int. Conf. on Knowledge Discovery and Data Mining KDD 11, KDD ‘11, 1082 San Diego, CA, August New York, NY: ACM [Google Scholar]
- 47.Goncalves B, Ramasco JJ. 2008. Human dynamics revealed through Web analytics. Phys. Rev. E 78, 7 ( 10.1103/PhysRevE.78.026123) [DOI] [PubMed] [Google Scholar]
- 48.Bond RM, Fariss CJ, Jones JJ, Kramer ADI, Marlow C, Settle JE, Fowler JH. 2012. A 61-million-person experiment in social influence and political mobilization. Nature 489, 295–298. ( 10.1038/nature11421) [DOI] [PMC free article] [PubMed] [Google Scholar]
- 49.Balcan D, et al. 2009. Multiscale mobility networks and the spatial spreading of infectious diseases. Proc. Natl Acad. Sci. USA 106, 21 484–21 489. ( 10.1073/pnas.0906910106) [DOI] [PMC free article] [PubMed] [Google Scholar]
- 50.Han X-P, Hao Q, Wang B-H, Zhou T. 2011. Origin of the scaling law in human mobility: hierarchy of traffic systems. Phys. Rev. E 83, 2–6. ( 10.1103/PhysRevE.83.036117) [DOI] [PubMed] [Google Scholar]
- 51.Brockmann D, Hufnagel L, Geisel T. 2006. The scaling laws of human travel. Nature 439, 462–465. ( 10.1038/nature04292) [DOI] [PubMed] [Google Scholar]
- 52.González MC, Hidalgo CA, Barabási A-L. 2008. Understanding individual human mobility patterns. Nature 453, 779–782. ( 10.1038/nature06958) [DOI] [PubMed] [Google Scholar]
- 53.Song C, Qu Z, Blumm N, Barabási A-L. 2010. Limits of predictability in human mobility. Science 327, 1018–1021. ( 10.1126/science.1177170) [DOI] [PubMed] [Google Scholar]
- 54.Song C, Koren T, Wang P, Barabási A-L. 2010. Modelling the scaling properties of human mobility. Nat. Phys. 6, 818–823. ( 10.1038/nphys1760) [DOI] [Google Scholar]
- 55.Deville P, Linard C, Martin S, Gilbert M, Stevens FR, Gaughan AE, Blondel VD, Tatem AJ. 2014. Dynamic population mapping using mobile phone data. Proc. Natl Acad. Sci. USA 111, 15 888–15 893. ( 10.1073/pnas.1408439111) [DOI] [PMC free article] [PubMed] [Google Scholar]
- 56.Yan X-Y, Zhao C, Fan Y, Di Z, Wang W-X. 2014. Universal predictability of mobility patterns in cities. J. R. Soc. Interface 11, 20140834 ( 10.1098/rsif.2014.0834) [DOI] [PMC free article] [PubMed] [Google Scholar]
- 57.Bagrow JP, Wang D, Barabási A-L. 2011. Collective response of human populations to large-scale emergencies. PLoS ONE 6, 8 ( 10.1371/journal.pone.0017680) [DOI] [PMC free article] [PubMed] [Google Scholar]
- 58.Blumenstock JE, Fafchamps M, Eagle N. 2011. Risk and reciprocity over the mobile phone network: evidence from Rwanda. SSRN Elect. J. pp.1–36. [Google Scholar]
- 59.Lu X, Bengtsson L, Holme P. 2012. Predictability of population displacement after the 2010 Haiti earthquake. Proc. Natl Acad. Sci. USA 109, 11 576–11 581. ( 10.1073/pnas.1203882109) [DOI] [PMC free article] [PubMed] [Google Scholar]
- 60.Calabrese F, Colonna M, Lovisolo P, Parata D, Ratti C. 2011. Real-time urban monitoring using cell phones: a case study in Rome. IEEE Trans. 12, 141–151. ( 10.1109/tits.2010.2074196) [DOI] [Google Scholar]
- 61.Calabrese F, Ratti C. 2006. Real time Rome. NETCOM 20, 247–258. [Google Scholar]
- 62.Montgomery AL, Zarnowitz V, Tsay RS, Tiao GC. 1998. Forecasting the US unemployment rate. J. Am. Stat. Assoc. 93, 478–493. ( 10.1080/01621459.1998.10473696) [DOI] [Google Scholar]
- 63.Milas C, Rothman P. 2008. Out-of-sample forecasting of unemployment rates with pooled STVECM forecasts. Int. J. Forecast. 24, 101–121. ( 10.1016/j.ijforecast.2007.12.003) [DOI] [Google Scholar]
- 64.Schuh S. 2001. An evaluation of recent macroeconomic forecast errors. N Engl. Econ. Rev. 35–56. [Google Scholar]
- 65.Stock JH, Watson MW. 1998. A comparison of linear and nonlinear univariate models for forecasting macroeconomic time series. Technical Report, National Bureau of Economic Research.
- 66.Rossi B. 2013. Do DSGE models forecast more accurately out-of-sample than VAR models? Adv. Econ. 32, 27–79. ( 10.1108/S0731-9053(2013)0000031002) [DOI] [Google Scholar]
- 67.Edge RM, Gürkaynak RS, Reis R, Sims CA. 2010. How useful are estimated DSGE model forecasts for central bankers? [with comments and discussion]. Brookings Pap. Econ. Act. 41, 209–259. [Google Scholar]
- 68.Cottrill CD, Pereira FC, Zhao F, Dias IF, Lim HB, Ben-Akiva ME, Zegras PC. 2013. Future mobility survey. Transp. Res. Rec. J. 2354, 59–67. ( 10.3141/2354-07) [DOI] [Google Scholar]
- 69.Krugman PR. 1996. The self organizing economy. Oxford, UK: Blackwell Publishers. [Google Scholar]
Associated Data
This section collects any data citations, data availability statements, or supplementary materials included in this article.