

Abstract
The analogies and differences between biological and cultural evolution have been explored by evolutionary biologists, historians, engineers and linguists alike. Two well-known domains of cultural change are language and technology. Both share some traits relating the evolution of species, but technological change is very difficult to study. A major challenge in our way towards a scientific theory of technological evolution is how to properly define evolutionary trees or clades and how to weight the role played by horizontal transfer of information. Here, we study the large-scale historical development of programming languages, which have deeply marked social and technological advances in the last half century. We analyse their historical connections using network theory and reconstructed phylogenetic networks. Using both data analysis and network modelling, it is shown that their evolution is highly uneven, marked by innovation events where new languages are created out of improved combinations of different structural components belonging to previous languages. These radiation events occur in a bursty pattern and are tied to novel technological and social niches. The method can be extrapolated to other systems and consistently captures the major classes of languages and the widespread horizontal design exchanges, revealing a punctuated evolutionary path.
Keywords: cultural evolution, punctuated equilibrium, networks, technology, programming languages, software
1. Introduction
Is cultural evolution similar to biological evolution? Darwin's theory of natural selection has often been used as a basic blueprint for understanding the tempo and mode of cultural change, particularly in relation to human language [1–3] and technological designs [4,5]. Darwin himself became interested in the similarities between natural and human-driven evolutionary change and shortly after the publication of The origin of species, scholars started to speculate about the similarities between organic and man-made evolution [4]. As a crucial component of cultural evolution, technology has received great attention as a parallel experiment of selection, diversification and extinction [6]. Tentative steps towards a theory of technological innovation have been made but the debate on the similarities versus differences between cultural and biological change remains unabated [7]. In this context, it has been suggested [5] that innovations occur mainly through combinations of previous technologies. But several questions remain open: can we test this idea in a systematic way? What type of large-scale evolutionary trends is associated with technological evolution based on combination?
Most textbook examples describe historical inventions [8] as human-driven events, where a success story marks the creation of a new concept or artefact. Unfortunately, no systematic approach to extract phylogenetic relationships exist [9] and only in some cases a hand-curated tree-like structure can be inferred using human expertise and available historical records [9,10]. Often, no simple trees are obtained but instead networks with merging of branches are found. Human languages are a clear exception to the rule, since it is possible to properly define distances among words or other components and reconstruct their evolutionary record [11]. As occurs with microbial species [12], languages also display high levels of horizontal transfer, which can be treated with the appropriate tools [13]. Surprisingly, almost no attention has been dedicated to the evolution of information technology, despite its well-preserved fossil record [6,14,15]. In this area, John von Neumann's concept and development of stored programs is probably the major single factor that allowed computation to take over. This innovation represents the first decoupling between hardware and software. Once computers were able to execute different programs the landscape for new ways of communicating with the machine started to open. Programming languages (PLs) started to appear, experiencing profound diversifications and major structural innovations. PLs are (along with large-scale hardware design and the Internet) the major players of the software revolution [16]. They play, within the context of technological evolution, the same role of tongues in human language. However, instead of making communication possible among two individuals, they provide the medium to single-directed communication between humans and machines.
In this paper, we use PLs as our case study to analyse the evolutionary patterns of technological evolution. Since the appearance in 1952 of the first short written code [17], PLs rapidly emerged, diversified and propagated through different niches (communities of users). They also co-evolved with hardware [18] and can be compared to human languages, which also co-evolved with brains [19] although with a significantly different status: they are both the means of telling computers how to perform useful work (functional perspective) and a tool to share algorithmic schemes between the programmers (a communication tool). The evolutionary pattern of these systems, as shown below, is punctuated and can be reconstructed in a systematic way.
2. Results
2.1. Dataset of programming languages
In dealing with the historical record of our system, the basic elements (nodes in a network) will be PLs defined as artificial languages designed to communicate instructions to a computer [16,17]. We have reconstructed the history of the most influential PLs from the information publicly available in Wikipedia (see the electronic supplementary material, S2) which provides content on language syntax, history, applications and, more importantly, a list of PLs that have influenced their design (see next section). Whenever the historical records were found to be inconsistent, they have been double-checked with alternative sources of information.
The dataset studied here includes N = 347 different PLs spanning a period of T = 59 years, from 1952 to 2010. They belong to fairly different groups of architectures (see below). Some of them exist today while others have disappeared. Although the total number of different languages that have been created is much larger than the above number, the chosen dataset captures a significant fraction of the most relevant PLs. Previous studies of the history of PLs have considered separate version numbers for popular languages. For example, Fortran is an old PL that has remained in place despite experiencing changes through its technological history with slightly different versions that are easily identified as ‘dialects’ of the original.
In our study, we look for ‘macroevolutionary’ patterns associated with major technological events and design principles underlying truly new PLs to emerge. Close versions of PLs are of course interesting, but their origination has to do with relatively minor improvements of the basic blueprint. On the other hand, Wikipedia does not provide this kind of information in most cases and, more importantly, influences are indicated using the generic PL name. In order to maintain consistency and given our interest for true innovations, versions are not included.
2.2. Technological evolutionary trees
The first goal of our study is to provide a systematic way of extracting a well-defined surrogate of the phylogenetic tree and identify major clades. Using our dataset, connections among languages are defined in terms of their list of influences as described in Wikipedia. Here, we make a distinction between influence and usage. Our aim is to capture the relative importance of a given innovation on the evolution of future languages rather than its success. For example, Algol-68 was not widely used but it had a profound impact on subsequent developments. Similarly, ISWIM was an abstract (never implemented) language, which nonetheless had a great impact on the development of functional languages [20]. Influence is a directed relation, i.e. new languages are always influenced by older ones but not the other way around. This allows the definition of a (directed, time-dependent) graph G = (Π, E) formed by the set of PLs Π and a set E of links among them (figure 1). This graph can be analysed using standard techniques (see the electronic supplementary material, S1), but it cannot used as a proper phylogenetic map. In order to obtain an evolutionary tree along with a map of horizontal exchanges, a systematic method is required.
Figure 1.

The network of PLs. In (a), we show the overall map of PLs and in (b) we display the corresponding central core of influences between different PLs as gathered from our dataset (electronic supplementary material, S2). Here a directed link exists between two PLs if the design of the later has been based in the structure of the previous one. Despite of their time-dependent nature, this is far from a simple tree. Instead, it defines a tangled, complex network. A subset of languages (including C, Java, Pascal and Lisp) define a special group here (lighter balls). They are the core innovations within the universe of PLs (see the electronic supplementary material, S1). Size and colour represent betweenness centrality, which is a measure of information flow or indirect influence.
Before we introduce our methods, it is worth noting the major difficulties associated with defining the cultural phylogenies. This is in fact a major problem in cultural evolution: how are cultural objects related to each other? [9]. The standard process in most cases incorporates a reliable dating of artefacts along with a decision process based on similarities (as perceived by an observer) and sometimes available written information that ‘connects’ two given objects or inventions. The best case scenario is provided by the phylogenetic analysis of written texts [21,22].
In this case, symbols and strings of symbols are easily identified (as letters and words) and a distance between texts defined. It could be argued that, since PLs are ultimately described by some type of written code, matchings between different strings or corpora could be used to define a ‘genetic’ distance. Such approximation could perhaps work for closely related versions of a given PL but the nature of PLs, which depart from each other in several structural and logic ways, goes far beyond the constraints imposed by written strings.
How can we treat the evolution of PLs in a rigorous way without requiring the string-based metaphor? As it occurs with other cultural evolution problems, PLs are objects that, despite lacking a ‘gene’ organization, exhibit identifiable structural components associated with their different syntax and semantic features, libraries and runtime systems [23] but also specific properties associated with the class of hardware where they can operate (including external devices). In this context, despite the more complex nature of PLs, innovations have taken place by modification of previous components but also through the combination of different elements associated with different PLs. Because of this, engineers and practitioners can recognize the influence of previous inventions and we can trace the graph G that incorporates PLs and their influences. From these links, we define the so-called adjacency matrix A, whose elements aij ∈ A are aij = 1 if a directed link i → j exists, meaning that the πi language is based (at least in part) on the jth one (otherwise, aij = 01). Given a πi ∈ Π, it will be based on other (ancestor) languages and can influence others (descendants). The out-degree  of πi is the number of edges leaving it, i.e.:
  or the number of ancestor languages that have influenced the design of πi. Similarly, the in-degree of πi is the number of edges entering it,
  which weights the number of times that an ancestor language πi has been used to build new, descendant languages.
We need now a systematic way of building a phylogeny, using for that purpose only the topological information associated with our graph along with the time coordinate. Previous work shows that such approximation, despite all its apparent limitations, is powerful enough to uncover meaningful dependencies in citation networks [24–27]. In this context, we look at two main features in our network that have evolutionary relevance. One is the definition of dependencies that captures cultural transmission from one PL to another. As will be shown below, a systematic rule provides a proper definition of strong ties associated with major influences allow us to build the tree-like structure of our system. Secondly, we wish to uncover the presence of communities of closely related PLs that can be interpreted as clades. The detection of community structures in complex networks is a very active field [28] and has been successfully applied to the analysis of scientific citation graphs, where two papers i and j are linked (i.e. we have j → i) if j cites i. Interestingly, most of these methods only use topological information (i.e. who is linked with whom) and do not include node attributes [29,30]. Despite this apparent oversimplification, these methods are capable of detecting the most relevant citation for each paper (i.e. the most important influence) and give a tree-like structure with different branches consistent with an accurate classification of fields. As shown below, the same efficient extraction of both tree-like influences and major components is found in the PL dataset.
In this paper, we construct our phylogenetic PL tree by following the approach of Gualdi et al. [29]. The method naturally incorporates the fact that PLs sharing similar parents (i.e. technological links) are likely to be technologically related. In a related study, scientific citations were taken to represent influence and relatedness of field [31].
We define the impact Yij of πj on its offspring πi by means of
| 2.1 |
where πk≠πi is a peer node of πi derived from πj, i.e. akj = 1. The elements of the impact matrix weight the structural similarity between peers in the directed network: an ancestor πj strongly influences a descendant node πi if it has (different) offspring πk that is itself similar to πi. Similarity sik is now defined as the neighbourhood overlap among peers πi and πk [32,33]:
| 2.2 |
where Γ (i) is the set of neighbours of node i. However, the above measure is biased towards nodes with a large offspring [34]. In order to correct for this effect, we set the degree of similarity between πi and πk as the probability of two-step random walk transition from πi to πk. The intuition behind this formulation is that ancestor nodes have more impact over closer peers than distant peers. In a finite amount of time, a random walk is more likely to visit any neighbour of the starting node than nodes located far apart. Notice that hubs will spread random walkers evenly among their connections, i.e. highly connected nodes tend to decrease structural similarity.
Random walks on undirected networks are well understood [35]. The transition probability matrix of a random walk on G is given by the Laplacian matrix P = D−1A, where D is the diagonal matrix of node degrees and A is the adjacency matrix. The nice properties of the transition matrix can be exploited by spectral methods for network clustering. Unfortunately, this framework cannot be used here because influences are highly asymmetrical. One possibility is to define random walks on directed networks by ‘symmetrization’ of the adjacency matrix [36], but this approach discards valuable information and does not model the network accurately. For example, the PL network is acyclic because old languages cannot cite newer languages. The temporal constraint prevents the creation of closed loops of links in the PL network and also in scientific citation networks. In other networks, like the World Wide Web, the existence of loops enables standard random walk analysis [37].
A useful formulation of random walks on directed networks takes into account asymmetric transition probabilities. For directed networks, there are two natural definitions for structural relatedness, namely, in-similarity and out-similarity. The in-similarity between peers πi and πj is defined as
| 2.3 |
where the superscript ‘d’ stands for ‘descendant’. The above gives the probability that a random walk starting at any node πi reaches the destination πj through any common descendant πl (red ball in the right branch of figure 2d), i.e. a random walk traverses the directed path πi ← πl → πj. On the other hand, out-similarity is defined as follows:
| 2.4 |
where the superscript ‘a’ stands for ‘ancestor’. This yields the probability that a random walk starting at any node πi reaches the destination πj through any common ancestor πl (red balls in the left branch of figure 2d), i.e. a random walk traverses the directed path πi → πl ← πj. For each pair of languages with undefined similarity  we will set the minimum impact value, i.e. Yij = εAij. Otherwise, the impact combines the structural similarities in (2.1) by taking a weighted sum with λ ∈ {0,1} (figure 2d). Hereafter, we set ε = 10−9 and λ = 1/2 [21]. This measure of (directed) link strength not only takes into account asymmetric random walk transitions but also represents a good trade-off between accuracy and complexity for small-world networks [30] having short (average) path lengths (like the PL network, see the electronic supplementary material, S1).
Figure 2.

Mapping the vertical and horizontal transfer of information among PLs with topological information. (a) An example of influence network G, where balls indicate different PLs and arrows indicate influence (which languages were used to build which). Our method provides a working definition of strong links associated with major influences (black arrows). Weaker links capture the horizontal transfer of information between less related languages (red arrows). (b) The impact matrix Y computes link strength as a function of structural similarity among peers. (c) The influence backbone Ω identifies the most influential ancestor for each language using the impact matrix. The branches of this tree map the groups (clades) of PLs. (d) The impact Y3,1 of ancestor π1 over its offspring π3 takes into account the asymmetric nature of influences by weighting the in-similarity  and the out-similarity
  For example, the left branch computes in-similarity as the sum of paths between language π3 (grey ball) and its peers π2 and π4 (violet balls) with random walk probabilities 1/3 and 5/18, respectively. Note that Y4,3 = ε because there are no peers (see text).
The method generates a backbone Ω based on identifying the most influential ancestor πj for each language πi, i.e. we pick the set of links aij having largest impact Yij among all their ancestors (white entries in figure 2b), while we also have an additional graph that keeps all the ‘horizontal’ exchanges among languages (red links in figure 2a). As shown below, the resulting tree (figure 2c) and its major branches captures the main programming groups (clades).
2.3. Programming language clades
The result of using our algorithm is shown in figure 3, where the most relevant large-scale patterns of PL interactions are displayed, actually defining the clades of our system. Our method finds two large, separated subsets of PLs defining the major clades, i.e. the so-called imperative (or procedural) and declarative programming families (including the functional and logical programming subfamilies), along with several smaller classes (see the electronic supplementary material, figure S1). These disjoint trees exhibit a notable asymmetry and, despite that our method does not include additional information beyond the influence relationships, the clades accurately map the known historic development of PLs. The largest subtree (figure 3c) defines 198 imperative languages rooted in Speedcoding (1953), the oldest language in our database and a direct ancestor of Fortran (first widely used PL). The Turing machine is the theoretical model underlying this class of languages, which defines computational tasks as sequences of computer instructions altering machine states (e.g. by accessing memory registers). The second largest tree (figure 3e), which is rooted in IPL (1954) and consisting of 67 functional languages, developed almost in parallel with the imperative languages. The main representative of this class, Lisp (designed by John McCarthy 1 year after Fortran), radically departed from the Turing machine. Lisp was created as a mathematical notation (based in Lambda calculus [38]) for describing computational tasks as the evaluation of mathematical functions, without explicit state changes.
Figure 3.

Large-scale evolution of PLs. We display the time series of (a) the total number of languages (N, filled circles) and of influences (L, open circles), respectively. Note the abrupt increase in L that takes place around 1980. In (b), the number of incoming interactions against N is displayed, where PLs have been sorted chronologically. Phylogenetic and influence maps in PLs are shown in (c–f) for the two largest groups defining the imperative and functional lineages (see text). Within each of these lineages, we can reconstruct a phylogenetic subtree with the vertical axis indicating release time. For example, the influence backbone among the family of imperative languages (1953–2012) is shown in (c) which gives all the horizontal transfers among them (d). The same diagrams are shown in (e,f) for the family of functional languages (1954–2011). The zoomed diagram in (g) highlights the language Go (2009) and the global spread of its ancestors (dark links). (Online version in colour.)
The total number of interactions shows a two-regime behaviour (figure 3a) with an accelerated growth in the second phase, starting in the 1980s, matching the emergence of personal computers [39,40]. A bursty signal (figure 3b) is observed when we plot the number of incoming links ki for each new language. The clustered structure involves high peaks indicating that new complex languages were created from previously existing ones. These bursts reveal a rapid ‘speciation’ event taking place among closely related languages. The in-degree distribution is broad, following a power law  with γi ≈ 2, whereas the out-degree P(kout) distribution is exponential. These features will be relevant for our interpretation of the evolutionary trees. The scale-free in-degree distribution suggests that a few PLs have disproportionate impact while the majority of languages have a modest impact. In this context, we have to make a difference between influence and popularity. Imperative languages are often associated with an ‘intuitive’ style of programming and they are very popular among programmers. However, our study suggests that the influence of functional languages, and artificial intelligence in general, over imperative languages has been very strong and not reciprocal.
The large-scale evolution of PLs is characterized by an increasing trend towards decoupling software from hardware (and reinforced by the Moore's law) and the transition from specific-purpose to general-purpose languages (see below). This pattern is captured by two large-scale radiation events found in the PL phylogeny. The first radiation event corresponds to the rapid diversification of early computers and the tight coevolution of hardware and software. Hardware costs and specific application requirements determined this first wave of languages. For example, Fortran was used for engineering and scientific applications, Lisp was used in artificial intelligence and COBOL was used for developing business applications (see the electronic supplementary material, S1). In 1958, an international consortium launched the Algol family of PLs (leftmost branch of figure 3c) with the objective of unifying heterogeneous programming practices. Algol versions (1958–1968), although very influential in PL evolution, were eventually replaced by similar but more conceptually uniform languages, like Pascal (1968). The personal computer revolution triggered this second wave of languages. The wide adoption of cheap hardware by individuals (users) created many new opportunities for information technology and computer programming: from education to business and commerce and entertainment (video games). For the first time, computer programming became a social activity that required high-level, general-purpose languages (like C, C++, Java or Python) associated with a characteristic innovation: the capacity to exchange software among different machines. This pattern has been expanded considerably with the emergence of the Internet and web programming (Javascript) in the last decades. This is consistent with the copious offspring of C and Java (rightmost branch in figure 3c).
The influence graphs describe a very interesting situation: far from observing links relating languages close in time, bundles of links reveal very large time windows connecting modern and old languages (figure 3d,f). The zoomed diagram shown in figure 3g provides an illustration of this: links exist between languages created within the first and last decades of programming history. These graphs support the combinatorial rule of technological evolution (2.5) but point to a richer picture: there are groups of time-close languages whose properties are recruited to build new clusters of languages far in the future. Modern PLs can be understood as combinations (‘hybrids’) of different paradigms. By the 1970s, there was a common perception that the hundreds of languages derived from Fortran and Lisp were flawed and provided limited support for complex software development. A partial response to this ‘software crisis’ was an adoption of the so-called object-oriented (OO) paradigm by both the imperative and functional styles. OO proposes that programming is neither the breaking down of computations nor the definition of functions but the definition and manipulation of domain objects (like numbers, strings, arrays, files, graphs). At the clade level, we observe that the organization of the influence backbone transitions from the historical separation of imperative and functional styles to a pattern of convergent evolution. In many of these lineages, we find examples of languages displaying OO traits. For example, Smalltalk (1976) is an iconic OO language strongly influenced by the functional language Lisp (see the electronic supplementary material, figure S2). On the other hand, the simulation language Simula (1960) extended the imperative language Algol with concepts borrowed from the OO paradigm.
2.4. Modelling programming language evolution
How are these patterns generated dynamically? Does a purely combinatorial model explain the previous observations? In order to define a framework accounting for the large-scale features of our system, we need a null model that generates nodes (inventions) and makes new inventions to connect with previous ones leading to a network from which the phylogenetic tree can be extracted. Moreover, if a previous invention is chosen, which is related to others, it is likely that the new node gets also linked to those related inventions with some probability. In other words, the model must include a process of growth by combination incorporating the ‘inheritance’ of existing correlations among technologies and must provide both vertical and horizontal relations. Such requirements discard standard models of cladogenesis based on simple branching rules [41,42].
Here, we use a model of network growth by copying (GNC) that fulfils the previous requirements and leads to the empirical in- and out-degree distributions. It is based on a previous model of tinkered graph evolution [43–45]. At every step, the network grows by introducing a new node (figure 4a–b) which links to m randomly chosen target node πj with probability p as well as to all ancestor nodes of each target, with probability q (figure 4). As defined, mp is the mean number of ancestor languages that influence new languages and mq is the mean number of influences also inherited. By estimating these parameters out from our empirical dataset, we obtain networks that are statistically close to our original graphs. In order to take into account the fact that the number of links reaches saturation (probably because there is a limited number of features that can be reused in further innovations), we have modified the original model by including a Boltzmann saturation term to the probabilities of attachment, namely  is replaced by
| 2.5 |
with  = p, q and β = 0.1. Since we have a two-regime scenario (figure 3a), we estimated two pairs of values, namely: mp1 = 0.92 and mp2 = 2.2, where m = 2 is the average number of randomly selected targets and p1 and p2 are the probability to attach to any target in stage 1 (before 1982) and stage 2 (after 1982), respectively. We can in particular match the evolution of L of links against N (figure 4c,d). From the final network, both the phylogenetic tree (figure 4e) and the horizontal transfer graph (figure 4f) can be obtained. Another structural component is well fitted by the model. The final degree distributions (figure 4g,h) fit very well the observed asymmetry between in- and out-degree. Two main observations can be made by looking at the reconstructed tree and horizontal graphs: the first is much more symmetric than the original one, while in the second we can see widespread recombination but less local and long-distance clusters of correlations.
Figure 4.

Modelling the growth of the PL network. Each time step, a new node (a) is introduced. The new node (blue) attaches to a target node (red) with probability p. This new node also inherits every link (b) from the target node (dashed links), with probability q. Both parameters can be estimated. The model correctly predicts the two-stage time evolution of L(N), as shown in (c) where the real data (filled circles) is compared with the predicted one (red) using 102 different replicas starting from the same initial condition. A phylogenetic tree (e) and the horizontal influence map (f) can also be constructed. The tree is somewhat similar, but much less asymmetric than the ones shown in figure 3. The influence graph (f) displays heterogeneity, but far from the one exhibited by real data. The in- and out-degree distributions for model (red) and data (black) are shown in (g) and (h), respectively. Our model predicts different saturation constants for each stage, i.e.  and
and 
2.5. Adaptive radiations and tree imbalance
The trees extracted from the model are much less asymmetric than the empirical data. This is deeply tied to the burstiness displayed by our system (as can be appreciated in figure 3b). Such asymmetric growth seems to be characteristic of evolution in living systems, where adaptive radiations and strong differences between clades are known to exist [46]. In order to measure this asymmetry, we use standard measures of tree imbalance [47,48]. Tree imbalance measures allows the study of how species diversity is arranged through different branches. This can be addressed using structural measurements of tree shape [49]. Here, we will focus on the average depth 〈d〉 of a tree with N nodes, defined as follows:
| 2.6 |
where d(r, i) is the path length or number of intermediate nodes relating the root r with any other node i. Note that here we compute the path length for every node, not only tree leaves (which yields a different, but related measure, e.g. [48]).
Equation (2.6) is a measure of tree imbalance, i.e. the degree to which subtrees are divided in groups of unequal size [47]. Here, the average path length is lower bounded by dmin = 1−1/N. On the other hand, the maximum average distance dmax = (N2−1)/4N corresponds to a fully imbalanced binary tree. Note that, for large N, we have dmin ≈ 1 and dmax ≈ log N. We can compare our data with the simplest null model of stochastic tree growth. At every time step, the equal-rates Markov (ERM) or Yule's model attaches two new descendant nodes to a randomly chosen leaf node [49,50]. This previous rule is performed until a tree with N nodes is obtained.
It can be shown that the average depth for trees obtained with the ERM model is 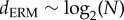 for large N. Figure 5 compares the scaling of 〈d〉 for the Fortran subtree with the predictions obtained with the ERM and the GNC models. In all systems, 〈d〉 scales linearly with log N. The slope of the scaling law in the Fortran subtree is larger than model predictions indicating a great tree imbalance in our phylogenies. The prediction for the GNC model is much less steep while the scaling for the ERM model is in-between the Fortran lineage and the GNC model.
Figure 5.
Logarithmic scaling of average depth with subtree size. We compare the different scaling behaviour exhibited by the evolutionary tree of Fortran-related languages (open circles) with the predictions of the ERM model (solid line) and the GNC model (red squares). (Online version in colour.)
As it occurs with the tree of life [46–48,50] technological trees are highly imbalanced, largely a consequence of accelerated diversification events tied to innovations. This pattern has also been found in the diversification pattern of human languages [51,52], which exhibited strong imbalances too. The asymmetries have been proposed to be evidence of punctuated equilibrium [53,54]. In our system, we do identify these shifts as major innovations associated with novel forms of engineering PLs (see §2.3). The tree imbalance, but also the bundles observed in the horizontal transfer interactions, are consistent with such bursts of rapid modifications.
3. Discussion
The study of cultural evolutionary patterns, particularly when dealing with artefacts, is usually constrained by a lack of powerful quantitative methods. The absence of a ‘genome’ is a great challenge, since it prevents us from exploiting some type of metric defining the distance among inventions. Only human languages were allowed to systematically reconstruct phylogenies while taking into account lateral transfer [13]. In this paper, we have shown that a simple network approach can reconstruct phylogenetic trees from existing databases that include information on who influenced whom in a given branch of technological development. We have used this method to study one important area of information technology, namely the large-scale evolution of PLs. Given the low level of details required to extract our networks, we predict that it can be applied to other technological webs, including other software systems, hardware development, specific tech fields (such as aircraft industry) and patent citation networks.
Our study is the first full systematic characterization of phylogenetic patterns in a cultural evolving system beyond the human language case study. It reveals that the evolutionary dynamics displayed by PLs fits the combination metaphor and also reveals the presence of non-uniform rates of change. Such correlations cannot be accounted for by our simple model. The unbalanced phylogenetic trees and complex horizontal transfer tells us that the underlying dynamics is rich and non-trivial. It supports a punctuated pattern of technological evolution. This concept has been previously explored by means of theoretical models [55,56] and supported by available historical information [57] and has been validated by our systematic method from available data of technological dependencies.
It is often said that human language co-evolved with brains [19] by infecting the mind of its hosts, thus acting as a sort of viral entity. PLs emerged as a much needed interface to communicate human brains and programmable machines [58]. They are actually virtual machines that make it possible to use diverse hardware systems and thus ‘infect’ a wide variety of devices. Their improvement made it possible to use more powerful machines but also to design even more powerful ones. Our work provides a rationale to rigorously explore the evolution of these virtual machines and how they co-evolved with both computers and human programmers. Future work should allow us to test this hypothesis by considering the parallel evolutionary changes experienced by computer hardware.
Our analysis of the influence network suggests that PLs form subgraphs according to their lineage of influence. Although procedural languages represent the largest lineage, the development of Fortran-derived languages has been influenced by the lineage of declarative languages and not the other way around. The combination of procedural and declarative approach signals the transition from top-down software design to bottom-up, evolutionary-based approaches. Early languages like Fortran are well adapted to specific domains, e.g. scientific computation, but previous attempts to build general-purpose tools (like PL/I) were not very successful. Such languages were very restricted because of machine and development constraints. In this context, Moore's law enabled the emergence of complex, rich languages. In spite of their enormous success and widespread adoption, modern languages like C or C++ have been criticized because of their inconsistent syntax and quirkiness [59]. However, this added layer of language complexity might be key to flexible software development. Both natural and artificial systems are continuously changing in order to adapt to new environments. But adaptation to specific functions restricts further evolution.
Natural systems represent a balance between optimization and flexibility: ‘Every complex species owes its unpredictable existence to the sloppy sources of evolution's creativity’ and the ‘evolutionary potential for creative response requires a set of attributes usually devalued in our culture’ [60]. In evolution, ‘the key is flexibility, not admirable precision’ [60]. Unlike engineers, evolution is not directed to any specific goals. Evolution is constrained to obtain novel features by using already existing parts. Interestingly, software development today is more about putting existing pieces of code together than designing everything from scratch. This unintended convergence between natural evolution and software development suggests that, perhaps we should be less obsessed with language purity and learn how to deal with pragmatic combinations of polyglot programming [61] and evolutionary thinking [62,63].
Supplementary Material
Supplementary Material
Acknowledgements
We thank M. Rosas-Casals, S. Kauffman, N. Eldredge, D. Farmer, L. Fortunato and L. Steels for useful discussions on cultural and technological evolution.
Funding
Our work has been supported by the Botín Foundation, by Banco Santander through its Santander Universities Global Division, the Spanish Ministry of Economy and Competitiveness, grant no. FIS2013-44674-P and by the Santa Fe Institute, where most of this research was done.
References
- 1.Pagel M. 2009. Human language as a culturally transmitted replicator. Nat. Rev. Gen. 10, 405–415. ( 10.1038/nrg2560) [DOI] [PubMed] [Google Scholar]
- 2.Mufwene S. 2001. The ecology of language evolution. Cambridge, UK: Cambridge University Press. [Google Scholar]
- 3.Solé RV, Corominas-Murtra B, Fortuny J. 2010. Diversity, competition, extinction: the ecophysics of language change. J. R. Soc. Interface 7, 1647–1664. ( 10.1098/rsif.2010.0110) [DOI] [PMC free article] [PubMed] [Google Scholar]
- 4.Basalla G. 1989. The evolution of technology. Cambridge, UK: Cambridge University Press. [Google Scholar]
- 5.Arthur B. 2009. The nature of technology: what it is and how it evolves. New York, NY: Free Press. [Google Scholar]
- 6.Solé RV, Valverde S, Rosas-Casals M, Kauffman SA, Farmer JD, Eldredge N. 2013. The evolutionary ecology of technological innovation. Complexity 18, 15–27. ( 10.1002/cplx.21436) [DOI] [Google Scholar]
- 7.Eldredge N. 2011. Paleontology and cornets: thoughts of material cultural evolution. Evo Edu Outreach 4, 364–373. ( 10.1007/s12052-011-0356-z) [DOI] [Google Scholar]
- 8.Johnson S. 2010. Where good ideas come from: a natural history of innovation. New York, NY: Riverhead Press. [Google Scholar]
- 9.Lipo CP, O'Brien MJ, Collard M, Shennan SJ. 2009. Mapping our ancestors. Chicago, IL: Aldine Transaction Publishers. [Google Scholar]
- 10.Tëmkin I, Eldredge N. 2010. Phylogenetics and material cultural evolution. Curr. Antrop. 48, 146–153. ( 10.1086/510463) [DOI] [Google Scholar]
- 11.Dunn M, Terrill A, Reesink G, Foley RA, Levinson SC. 2005. Structural phylogenetics and the reconstruction of ancient language history. Science 309, 2072–2075. ( 10.1126/science.1114615) [DOI] [PubMed] [Google Scholar]
- 12.Dagan T, Martin W. 2009. Getting a better picture of microbial evolution en route to a network of genomes. Phil. Trans. R. Soc. B 364, 2187–2196. ( 10.1098/rstb.2009.0040) [DOI] [PMC free article] [PubMed] [Google Scholar]
- 13.Nelson-Sathi S, List JM, Geisler H, Fangerau H, Gray RD, Martin W, Dagan T. 2011. Networks uncover hidden lexical borrowing in Indo-European language evolution. Proc. R. Soc. B 278, 1794–1803. ( 10.1098/rspb.2010.1917) [DOI] [PMC free article] [PubMed] [Google Scholar]
- 14.Green T. 2010. Bright boys: the making of information technology. Boca Raton, FL: CRC Press. [Google Scholar]
- 15.McNerney J, Farmer JD, Redner S, Trancik JE. 2011. Role of design complexity in technology improvement. Proc. Natl Acad. Sci. USA 108, 9008–9013. ( 10.1073/pnas.1017298108) [DOI] [PMC free article] [PubMed] [Google Scholar]
- 16.Sammet JE. 1969. Programming languages: history and fundamentals. New York, NY: Prentice-Hall. [Google Scholar]
- 17.Sammet JE. 1972. Programming languages: history and future. Comm. ACM 15, 601–610. ( 10.1145/361454.361485) [DOI] [Google Scholar]
- 18.O'Regan G. 2008. A brief history of computing. Berlin, Germany: Springer. [Google Scholar]
- 19.Deacon TW. 1997. The symbolic species: the co-evolution of language and brain. London, UK: Allen Lane. [Google Scholar]
- 20.Landin PJ. 1965. The next 700 programming languages. Comm. ACM 9, 157–65. ( 10.1145/365230.365257) [DOI] [Google Scholar]
- 21.Barbrook AC, Howe CJ, Blake N, Robinson P. 1998. The phylogeny of The Canterbury Tales. Nature 394, 839 ( 10.1038/29667) [DOI] [Google Scholar]
- 22.Howe JC, Barbrook AC, Spencer M, Robinson P, Bordalejo B, Mooney LR. 2001. Manuscript evolution. Trends Genet. 17, 147–152. ( 10.1016/S0168-9525(00)02210-1) [DOI] [PubMed] [Google Scholar]
- 23.Appel AW. 1990. A runtime system. J. Lisp Symb. Comp. 3, 343–380. ( 10.1007/BF01807697) [DOI] [Google Scholar]
- 24.de Solla Price DJ. 1965. Networks of scientific papers. Science 149, 510–515. ( 10.1126/science.149.3683.510) [DOI] [PubMed] [Google Scholar]
- 25.Small HJ. 1973. Co-citation in the scientific literature: a new measure of the relationship between two documents. J. Am. Soc. Inf. Sci. 24, 265–269. ( 10.1002/asi.4630240406) [DOI] [Google Scholar]
- 26.Small HJ. 1999. Visualising science by citation mapping. J. Am. Soc. Inf. Sci. 50, 799–813. () [DOI] [Google Scholar]
- 27.Rosvall M, Bergstrom CT. 2007. Maps of random walks on complex networks reveal community structure. Proc. Natl Acad. Sci. USA 105, 1118–1123. ( 10.1073/pnas.0706851105) [DOI] [PMC free article] [PubMed] [Google Scholar]
- 28.Fortunato S. 2010. Community detection in graphs. Phys. Rep. 486, 75–174. ( 10.1016/j.physrep.2009.11.002) [DOI] [Google Scholar]
- 29.Gualdi S, Yeung CH, Zhang YC. 2011. Tracing the evolution of physics on the backbone of citation networks. Phys. Rev. E 84, 046104 ( 10.1103/PhysRevE.84.046104) [DOI] [PubMed] [Google Scholar]
- 30.Lu L, Jin C-H, Zhou T. 2009. Similarity index based on local paths for link prediction of complex networks. Phys. Rev. E 80, 046122 ( 10.1103/PhysRevE.80.046122) [DOI] [PubMed] [Google Scholar]
- 31.Newman M. 2010. Networks: an introduction. Oxford, UK: Oxford University Press. [Google Scholar]
- 32.Jarvis RA, Patrick EA. 1973. Clustering using a similarity measure based on shared near neighbours. IEEE Trans. Comp. 22, 1025–1034. ( 10.1109/T-C.1973.223640) [DOI] [Google Scholar]
- 33.Wasserman S, Faust K. 1994. Social network analysis: methods and applications. Cambridge, UK: Cambridge University Press. [Google Scholar]
- 34.Radovanović M, Nanopoulos A, Ivanović M. 2010. Hubs in space: popular nearest neighbours in high-dimensional data. J. Mach. Learn. Res. 11, 2487–2531. [Google Scholar]
- 35.Lovàsz L. 1993. Random walks on graphs: a survey. Combinatorics 2, 1–46. [Google Scholar]
- 36.Zhou D, Huang J, Scholkopf B. 2005. Learning from labeled and unlabeled data on a directed graph. In ICML '05 Proc. 22nd Int. Conf. Machine Learning, 7–11 August, Bonn, Germany, pp. 1036–1043. New York, NY: ACM. [Google Scholar]
- 37.Brin S, Page L. 1998. The anatomy of a large-scale hypertextual web search engine. Comput. Netw. ISDN Syst. 30, 107–117. ( 10.1016/S0169-7552(98)00110-X) [DOI] [Google Scholar]
- 38.Simon HA. 1996. Models of my life. Cambridge, MA: MIT Press. [Google Scholar]
- 39.Cambell-Kelly M, Aspray W. 2004. Computer: a history of the information machine. New York, NY: Perseus Books. [Google Scholar]
- 40.Ensmenger N. 2010. The computer boys take over: computers, programmers, and the politics of technical expertise. Cambridge, MA: MIT Press. [Google Scholar]
- 41.Raup DM. 1985. Mathematical models of cladogenesis. Paleobiology 11, 42–52. [Google Scholar]
- 42.Mace R, Holden CJ. 2005. A phylogenetic approach to cultural evolution. Trends Ecol. Evol. 20, 116–121. ( 10.1016/j.tree.2004.12.002) [DOI] [PubMed] [Google Scholar]
- 43.Krapivsky PL, Redner S. 2005. Network growth by copying. Phys. Rev. E 71, 036118 ( 10.1103/PhysRevE.71.036118) [DOI] [PubMed] [Google Scholar]
- 44.Valverde S, Solé RV. 2005. Logarithmic growth dynamics in software networks. Europhys. Lett. 72, 858–864. ( 10.1209/epl/i2005-10314-9) [DOI] [Google Scholar]
- 45.Valverde S, Solé RV. 2005. Network motifs in computational networks: a case study in software architecture. Phys. Rev. E 72, 026107 ( 10.1103/PhysRevE.72.026107) [DOI] [PubMed] [Google Scholar]
- 46.Rabosky DL, Slater GJ, Alfaro ME. 2012. Clade age and species richness are decoupled across the eukaryotic tree of life. PLoS Biol. 10, e1001381 ( 10.1371/journal.pbio.1001381) [DOI] [PMC free article] [PubMed] [Google Scholar]
- 47.Kwang-Tsao S, Sokal RR. 1990. Tree balance. Syst. Zool. 39, 266–276. ( 10.2307/2992186) [DOI] [Google Scholar]
- 48.Kirkpatrick M, Slatkin M. 1993. Searching for the evolutionary patterns in the shape of a phylogenetic tree. Evolution 47, 1171–1181. ( 10.2307/2409983) [DOI] [PubMed] [Google Scholar]
- 49.Cavalli-Sforza LL, Edwards AWF. 1967. Phylogenetic analysis: models and estimation procedures. Am. J. Hum. Genet. 19, 233–257. ( 10.2307/2406616) [DOI] [PMC free article] [PubMed] [Google Scholar]
- 50.Cotton JA, Page RDM. 2006. The shape of human gene family phylogenies. BMC Evol. Biol. 6, 66 ( 10.1186/1471-2148-6-66) [DOI] [PMC free article] [PubMed] [Google Scholar]
- 51.Atkinson QD, Meade A, Venditti C, Greenhill SJ, Pagel M. 2008. Languages evolve in punctuational bursts. Science 319, 588 ( 10.1126/science.1149683) [DOI] [PubMed] [Google Scholar]
- 52.Venditti C, Pagel M. 2008. Speciation and bursts of evolution. Evo. Edu. Outreach 1, 274–280. ( 10.1007/s12052-008-0049-4) [DOI] [Google Scholar]
- 53.Eldredge N, Gould SJ. 1972. Punctuated equilibria: an alternative to phyletic gradualism. In Models in palaeobiology (ed. Schopf TM.), pp. 82–115. San Francisco, CA: Freeman Cooper. [Google Scholar]
- 54.Gould SJ, Eldredge N. 1977. Punctuated equilibria: the tempo and mode of evolution reconsidered. Paleobiology 3, 115–151. [Google Scholar]
- 55.Mokyr J. 1990. Punctuated equilibrium and technological progress. Am. Econ. Rev. 80, 350–354. [Google Scholar]
- 56.Loch CH, Huberman BA. 1999. A punctuated-equilibrium model of technology diffusion. Manag. Sci. 45, 160–177. ( 10.1287/mnsc.45.2.160) [DOI] [Google Scholar]
- 57.Levine H, Rheingold H. 1987. The cognitive connection: thought and language in man and machine. New York, NY: Prentice Hall. [Google Scholar]
- 58.Waldrop MM. 2001. The dream machine. New York, NY: Viking. [Google Scholar]
- 59.Ritchie DM. 1993. The development of the C language. In Proc. HOPL-II The Second ACM SIGPLAN Conf. on History of Programming languages, pp. 201–208. New York, NY. [Google Scholar]
- 60.Gould SJ. 1996. Creating the creators. Discover Magazine (October, 1996). [Google Scholar]
- 61.Wampler D, Clark T. (eds). 2010. Guest editors' introduction: multiparadigm programming. IEEE Software 27, 20–24. ( 10.1109/MS.2010.119) [DOI] [Google Scholar]
- 62.Koza JR. 1992. Genetic programming: on the programming of computers by means of natural evolution. Cambridge, MA: MIT Press. [Google Scholar]
- 63.Back Th, Fogel DB, Michalewicz Z. (eds). 1997. Handbook of evolutionary computation. New York, NY: Oxford University Press. [Google Scholar]
Associated Data
This section collects any data citations, data availability statements, or supplementary materials included in this article.