This study describes earnings patterns among state public health agency employees and examines correlates thereof.
Keywords: earnings, public health workforce, Public Health Workforce Interests and Needs Survey (PH WINS), salary, wages
Context:
Earnings have been shown to be a critical point in workforce recruitment and retention. However, little is known about how much governmental public health staff are paid across the United States.
Objective:
To characterize earnings among state health agency central office employees.
Design:
A cross-sectional survey was conducted of state health agency central office employees in late 2014. The sampling approach was stratified by 5 (paired HHS) regions. Balanced repeated replication weights were used to correctly calculate variance estimates, given the complex sampling design. Descriptive and bivariate statistical comparisons were conducted. A linear regression model was used to examine correlates of earnings among full-time employees.
Setting and Participants:
A total of 9300 permanently employed, full-time state health agency central office staff who reported earnings information.
Main Outcome Measure:
Earnings are the main outcomes examined in this article.
Results:
Central office staff earn between $55 000 and $65 000 on average annually. Ascending supervisory status, educational attainment, and tenure are all associated with greater earnings. Those employed in clinical and laboratory positions and public health science positions earn more than their colleagues in administrative positions. Disparities exist between men and women, with men earning more, all else being equal (P < .001). Racial/ethnic disparities also exist, after accounting for other factors.
Conclusions:
This study provides baseline information to characterize the workforce and key challenges that result from earnings levels, including disparities in earnings that persist after accounting for education and experience. Data from the survey can inform strategies to address earnings issues and help reduce disparities.
Maintaining a well-prepared workforce in governmental public health agencies has long been a policy concern.1 Public health workforce shortages have been forecast for nearly 2 decades, driven by an aging workforce,2–8 annual turnover,4,9 and fewer new graduates entering the state and local public health workforce.10,11 Furthermore, since 2008, most governmental public health agencies have experienced job losses through a combination of layoffs and attrition.7,12 As of 2014, state public health agencies were actively recruiting for only 28% of their vacant positions.7
An adequate supply of well-trained, skilled public health professionals is essential for the effective operation of the governmental public health enterprise.13,14 To ensure that such a supply exists, approaches are needed to address challenges to workforce recruitment and retention.15 Several attempts have been made to enumerate the workforce16–21 and identify barriers to retention and recruitment,20,22–24 but the diversity of the occupations within the broader field of public health has made reaching a consensus estimate difficult.25 However, several studies among different occupational groups have identified earnings as a barrier to successful workforce retention and recruitment.13,23,25–27
Individual state and local public health agencies have conducted workforce assessments that include salary information and earnings satisfaction, but no national perspective currently exists. The purpose of this study was to describe earnings patterns among state public health agency employees and examine correlates thereof. This is the first study to quantify differences in earnings by key demographic variables at the national and regional levels.
Methods
Data used in the analyses for this article were drawn from the 2014 Public Health Workforce Interests and Needs Survey (PH WINS),28 and in particular the nationally representative sample of central office employees of state health agencies (SHAs) in the United States. PH WINS is the largest public health workforce survey of its kind. Approximately 25 000 central office staff from 37 participating SHAs made up the sample; there are approximately 42 000 central office SHA staff nationwide.28 Respondents were identified and contacted through SHA directories and staff lists. Participants were asked to complete a Web-based survey, taking 15 to 25 minutes on average. The survey was conducted in the fall of 2014. Approximately 10 794 permanent and temporary staff responded. This constituted a response rate of 46% after accounting for undeliverable e-mails (n = 1681) and staff who had left their position (n = 199). An additional 546 staff indicated they were temporary employees and were excluded from estimates, as were 539 permanent, part-time employees. A small number of staff did not report earnings information. In total, about 9300 were permanent, full-time staff who reported earnings information and are used in the analyses given in this article.
This article examines correlates of salary and wages among full-time employees, which group constitutes 95% of the total population of central office employees. Respondents were asked a series of questions related to salaries and wages. First they were asked whether they were paid a salary or an hourly wage. Next they were asked to indicate their salary or hourly wage, respectively, on equivalent scales.* Descriptive statistics are presented in the Results. We collapsed several variables, including position type, into administrative, clinical or laboratory, public health sciences, or another social services or “all other” position category.†
Three methods were used to examine correlates of earnings: (1) linear regression to establish an overall model; (2) models stratified on educational attainment and region; and (3) a propensity-score matching approach used as an alternative estimate on the impact of gender and race/ethnicity on earnings after accounting for other variables of interest through establishing matches within SHAs. Results were calculated in scale intervals but are reported in dollars for accessibility purposes. After eliminating outliers (<$25 000 [1.8% of population] and >$145 000 [1.0% of population] and their respective hourly equivalents), each interval used in the model represents a span of approximately $10 000 in earnings. Independent variables of interest include supervisory status, gender, number of years in public health, educational attainment, region, position type (administrative, public health science, or clinical), race/ethnicity, whether the individual's full-time position was salaried or hourly, and whether the individual was a member of a collective bargaining unit or union. In these analyses, approximately 8300 respondents' records are utilized because of some additional nonresponse among the independent variables used in the models. This project received a determination of “exempt” from the Chesapeake institutional review board (Pro00009674).
Results
Earnings patterns
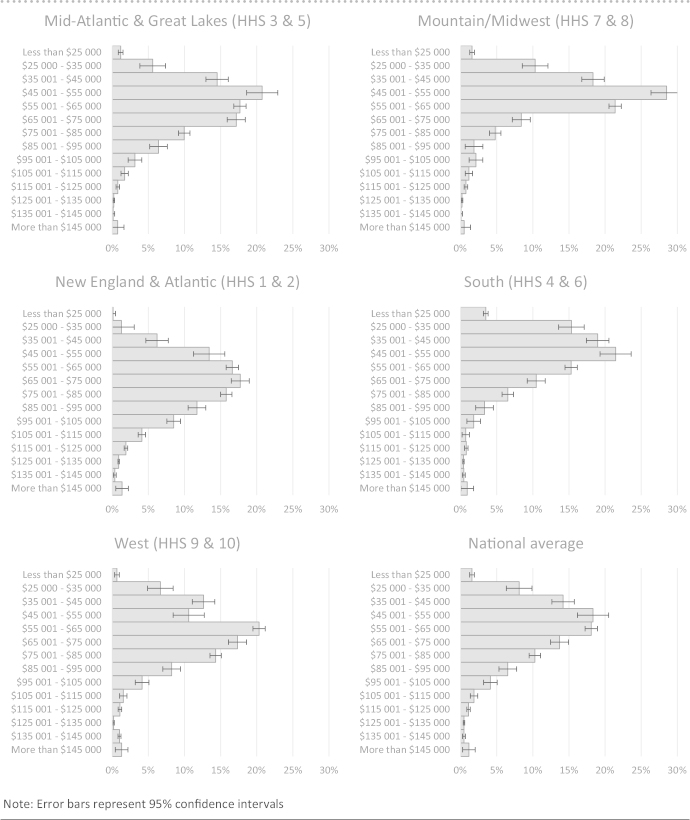
Among full-time staff, annualized earnings fall between $55 000 and $65 000 for both the mean and median. Eight percent of the workforce makes more than $95 000 a year. About one-quarter makes under $45 000. Meaningful differences in earnings were found across several demographic variables (Table 1).* Nationally, on average, nonsupervisory staff earned about $52 000. Supervisory staff, which included team leaders, supervisors, managers, and executives,† reported greater earnings than nonsupervisory staff. Team leaders earned approximately $60 000 on average, whereas supervisors earned about $66 000. Managers earned approximately $79 000, and executives earned about $109 000. On average, women earned $59 000 nationally. Men earned about $65 000 on average. Those in public health the longest (≥21 years) earned about $16 000 more than those who had worked in public health for 0 to 5 years.
TABLE 1 •. Salary/Wages Among Full-time Central Office Employees of State Health Agenciesa.
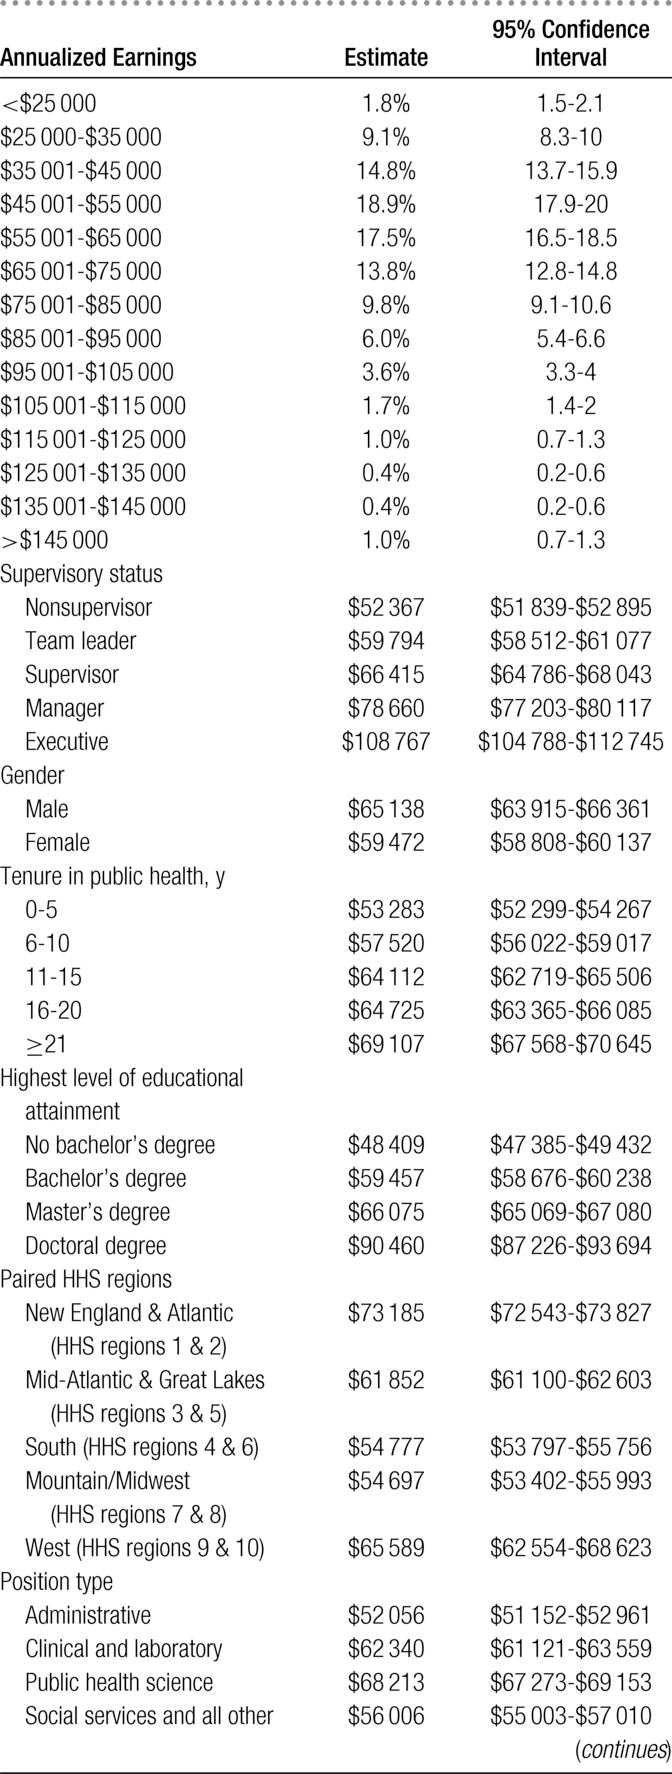
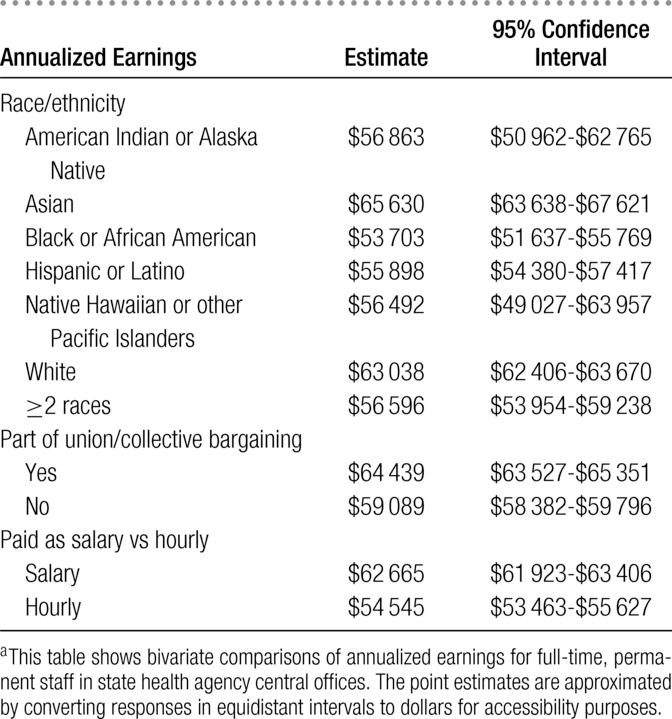
Those with a doctoral degree as their highest level of education earned around $90 000 on average, compared with $66 000 among those with a master's degree, $59 000 among those with a bachelor's degree, and $48 000 among those without a bachelor's degree. Overall, staff in administrative positions earned $52 000 on average annually, staff in clinical and laboratory positions earned $62 000, staff in the public health sciences earned $68 000 on average, and staff in social services and all other earned $56 000 on average. Among racial/ethnic groups, Asian staff earned the most on average at $66 000, followed by non-Hispanic white staff earning $63 000 annually, $57 000 for American Indians/Alaska Native staff, $56 000 for Hispanic/Latino staff, $56 000 for Native Hawaiian or other Pacific Islander staff, $56 000 for staff of 2 or more races, and $54 000 for black/African American staff. Significant differences in earnings were observed by paired HHS region (Table 1 and Figure), with New England & Atlantic states (HHS regions 1 & 2) having the highest average salary at approximately $73 000, and staff in the South (HHS regions 4 & 6) and Mountain/Midwest (HHS regions 7 & 8) earned the least on average, at approximately $55 000.
FIGURE •.
Distribution of Earnings Among State Health Agency Central Office Employees, by Paired HHS Region
A linear regression was run to examine the impact of multiple variables on the outcome of interest. Earnings served as the dependent variable and the identified demographic variables of interest as the independent variables in the model (Table 2). Models with conceptually related variables were fit. Collinearity was examined; the final model showed reasonable explanatory power (R2 = 0.5544) and had an average variance inflation factor of 1.5 (max 2.98). Results of an unweighted robust regression were similar. After controlling for other variables, ascending supervisory status was associated with a higher salary (P < .001). Similarly, greater educational attainment was associated with a larger salary, considering those without a bachelor's degree. Women earned less than men, even after adjusting for experience, seniority, and other demographic characteristics. Differences observed in the bivariate comparisons of salary against race/ethnicity, region, and position type also persisted.
TABLE 2 •. Correlates of Salary/Wages Among Full-time Central Office Employees of State Health Agenciesa.
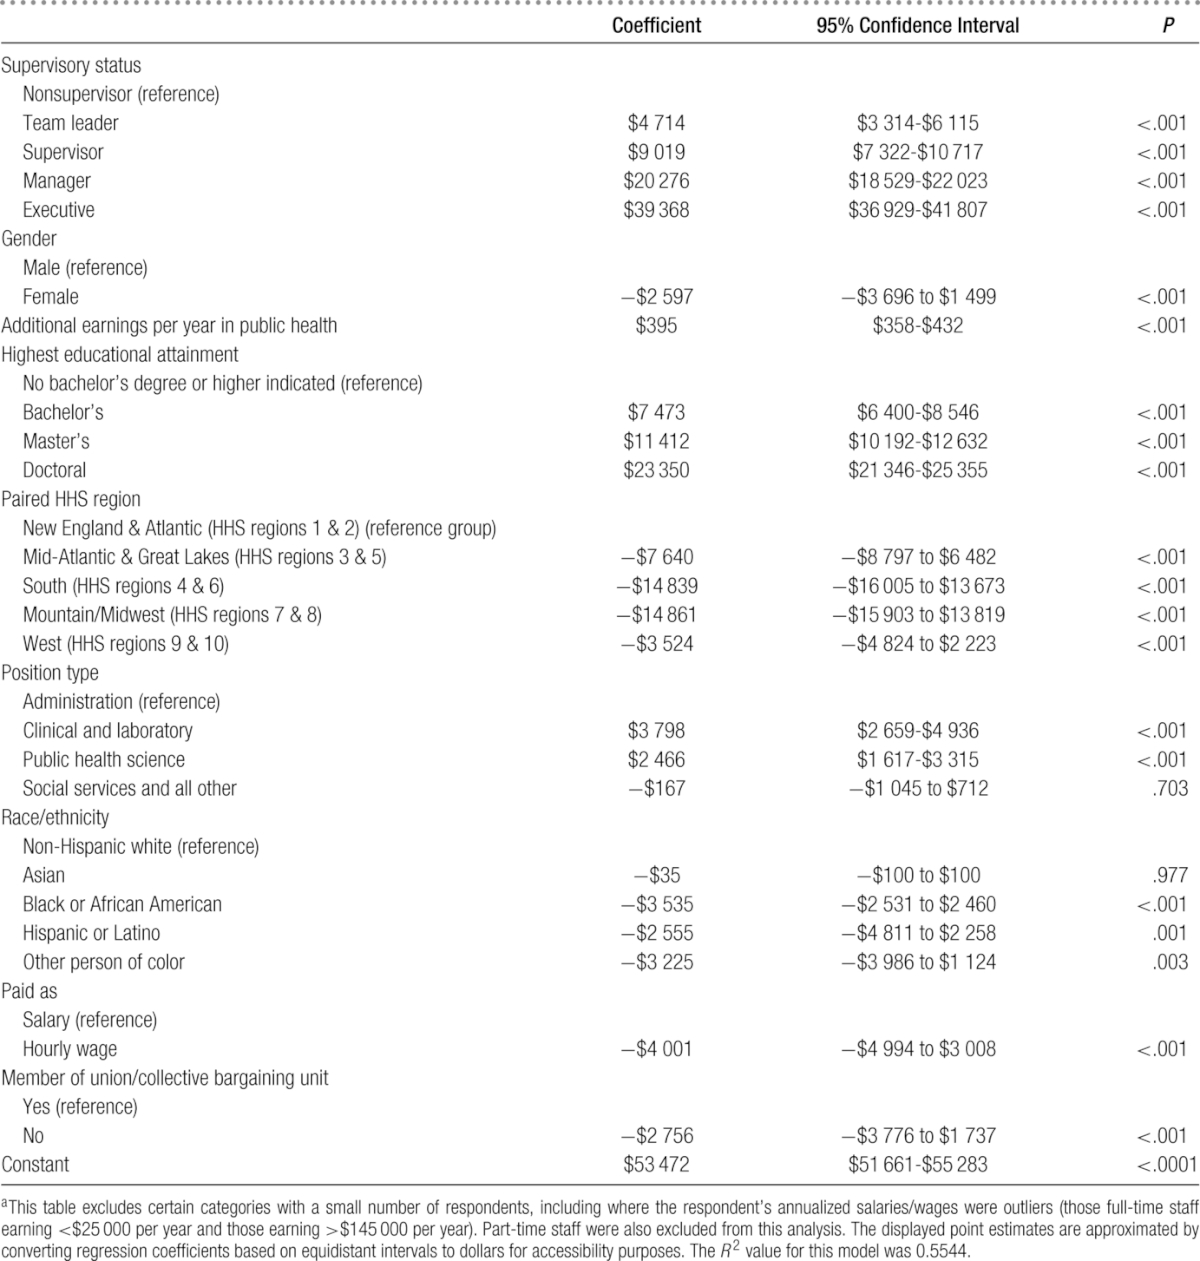
Regression models were run separately to explore earnings differences by race/ethnicity when stratified by gender (data not shown). Among males, black or African American state governmental public health employees earned approximately $4500 less (P < .001), Hispanic or Latino state governmental public health employees earned about $3500 less (P = .022), and other people of color earned $3000 less (P = .038) than white state governmental public health employees. Among females, black or African American state governmental public health employees earned about $3000 less (P = .01), Hispanic or Latino state governmental public health employees earned approximately $2000 less (P = .138), and other people of color earned $3000 less (P = .01) than white state governmental public health employees. Among both genders, non-Hispanic white staff and Asian staff earned approximately the same, all else equal. Being a member in a union/collective bargaining unit was significantly associated with greater pay, all else being equal.
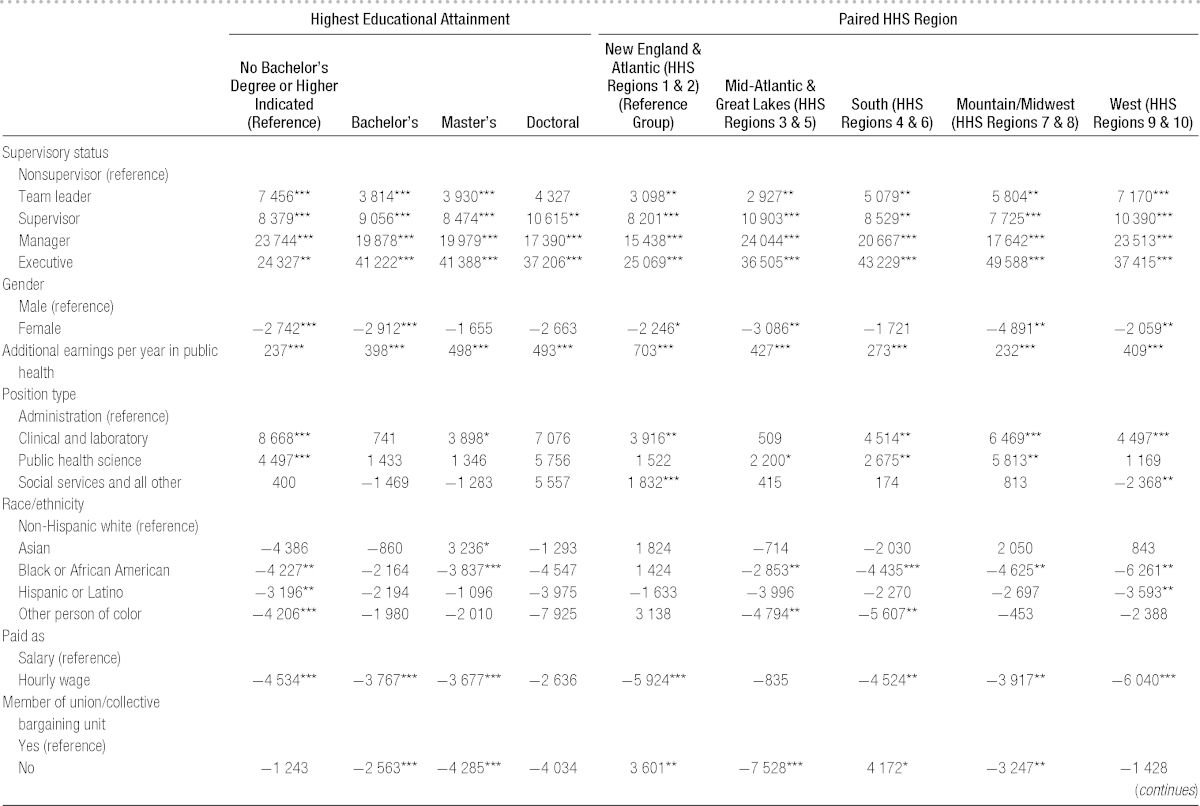
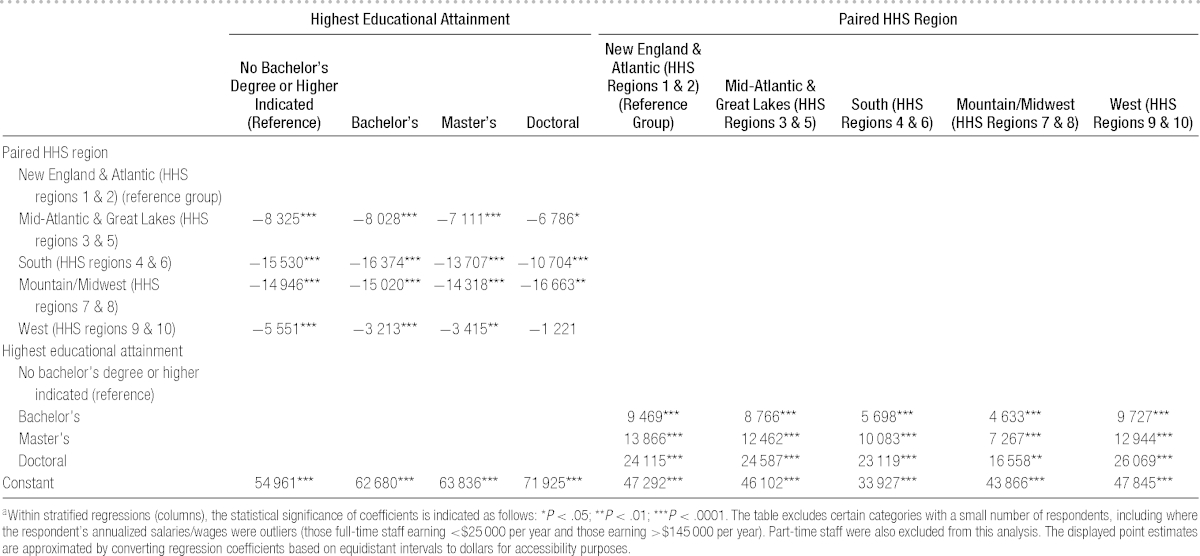
Table 3 presents the results of stratified analyses by paired HHS regions and educational attainment. Gender differences persisted in all paired regions except the South (HHS regions 4 & 6), with women earning several thousand dollars less than men annually, after accounting for experience, seniority, and other demographic characteristics. The value of educational attainment also differed regionally, with those with a bachelor's degree having about $6000 additional earnings in the South and $5000 in the Mountain/Midwest compared with other regions' $9000 to $10 000 in additional earnings for having a bachelor's degree compared with those without any bachelor's degree. Being black/African American, Hispanic/Latino, or another person of color (except Asian) was associated with earning less than non-Hispanic whites, after adjusting for all other variables in the models, although these findings were not statistically significant across all regions. Similarly, the benefits of higher educational attainment were not experienced equally across staff. Wage gaps were statistically significant for black/African American staff, Hispanic/Latino staff, and other staff who were people of color among those without a bachelor's degree. No differences by race/ethnicity were statistically significant among those with only a bachelor's degree. Differences between non-Hispanic white staff and black/African American staff were again significant for those holding master's and doctoral degrees. Asian staff with a master's degree earned relatively more than staff of other racial/ethnic groups. Educational attainment was associated with different levels of benefits across regions, as was membership in a union/collective bargaining unit.
TABLE 3 •. Linear Regression of Demographic Variables of Interest on Annualized Salary/Wages Among Full-time Central Office Employees of State Health Agencies, Stratified by Paired HHS Regions and Educational Attainment (in US Dollars)a.
One set of additional analyses was conducted to examine the association between gender and earnings. Using propensity score matching (Stata command teffects psmatch), staff within SHAs were matched on the basis of supervisory status, time in public health, educational attainment, position type, race/ethnicity, and whether they were paid as a salary or hourly wage; the “treatment effect” in this analysis was gender (female vs male) using a robust variance estimator. Of the 8572 full-time respondents used in this analysis, 8887 matches were established (minimum 1 match, maximum 9). After matching on seniority, experience, educational attainment, and other demographic characteristics within a state, a matched analysis suggests women earned approximately $2000 less than men on average (P < .001; 95% confidence interval [CI], −$3180 to −$891); the CI for this approach and the regressions overlap suggesting the impact of gender is robust to multiple approaches. On average, this represents women earning 90 to 95 cents on the dollar compared with men of similar experience and seniority. This gap grows considerably among women who have higher levels of supervisory status.
A similar analysis was conducted with treatment effect being a staff member who was a person of color. From full-time respondents with earnings information, 8572 matches were established (minimum 1 match, maximum 11). Staff who were people of color earned about $3500 less than their white counterparts (95% CI, −$2358 to −$4701). Overall, this also represents earning 90 to 95 cents on the dollar compared with their non-Hispanic white colleagues. This gap is not statistically significant among nonsupervisors but increases dramatically for staff with higher supervisory status.
Discussion
We found an earnings gap of approximately 90 to 95 cents on the dollar between male and female state governmental public health employees, in contrast to an overall national gender gap for all types of workers of 78 cents on the dollar.29 This is consistent with previous work that shows the gender gap to be smaller in the governmental sector than in the private sector.30 While a recent study found another female-dominated field (nursing) had earnings gaps similar to those in public health,31 generally, compared with other health professions, gender differences are typically greater than those observed here.32–36 Results were similar in our analyses of earnings gaps by race/ethnicity.
PH WINS provides an opportunity to evaluate (and eliminate) many of the presumed explanations for differences in earnings, such as differences in educational attainment37–39 or the unequal distribution of employees in professional, executive, or managerial positions.38,39 After accounting for these characteristics, earnings gaps are still present by both gender and race/ethnicity. Further research is needed to explore factors associated with the persistence of gaps even in female-dominated workplaces, and in juxtaposition, factors in the governmental public health workplace that help explain those gaps that are significantly lower than in other sectors. This includes examinations of other potential factors that PH WINS was not equipped to measure, including systemic and institutional discrimination, the effect of educational prestige on earnings, differences in earnings within position types, and temporal associations between when a degree was received and changes in earnings.37,40,41 In addition, analyses similar to those conducted here could be conducted by each state health department using its own salary data to determine the presence of earnings gaps by demographic characteristics of interest; departments could then create and implement strategies that can contribute to improved earnings equity. Furthermore, state-specific studies may allow for collection of additional explanatory variables of interest that may explain some of the variation not captured in the current models.
The value of education in governmental public health
Earnings differences are a potential measure of educational value. These data find significant increases in earnings associated with earning a bachelor's degree and a doctoral degree. The earnings increase for a master's degree was approximately $4000, which was relatively consistent across regions. Given growing costs for attaining master's level degrees, the relatively small difference (and longer horizon to realize a return on investment) may discourage existing state employees to pursue a master's of public health (MPH) degree for career advancement. If this is unique to the governmental workforce, it presents a potential competitive disadvantage to government public health agencies in attracting new MPH graduates. Policies, such as loan repayment programs, or reclassification of positions leading to higher earnings may be necessary to recruit staff with graduate degrees for key positions.
The influence of earnings satisfaction
Previous studies have identified salary as a recruitment barrier for the public health workforce.13,23,25–27 Nearly 40% of the employees in state governmental public health agencies reported being somewhat or very dissatisfied with their pay.42 Other studies published in this issue find that earnings dissatisfaction may also be associated with less positive perceptions about one's job and organization, which, in turn, may be limiting employee performance.43,44 These possible associations bear further examination by researchers and practitioners alike.
Limitations
This article has several limitations. The first relates to PH WINS itself; while the data are nationally representative of central office employees, it is possible that nonresponse bias exists. We attempted to address this through complex sampling methodology, a strong response rate (>46%), and poststratification adjustments. Another limitation is that the data for earnings came from scales rather than exact numbers. This was done to maximize item response with the thought that a large number of respondents would not give an exact answer to such a sensitive question, although the survey collected no personal identifiers. Because these scales are equidistant, and because PH WINS has a large sample size, interval estimates may be soundly converted to dollars for ease of interpretation. However, these estimates could be made more precise in future studies if exact salary/wage estimates were gathered from respondents. Although regional differences were broadly accounted for in the model, formal cost-of-living adjustments were not made, as significant intra- and interstate differences would have made such adjustments imprecise. Moreover, other adjustments might be warranted to generate more comparable estimates—for example, by marital status, number of dependents, and the like. However, these questions were not asked in PH WINS for confidentiality reasons.
For analysis purposes, dozens of specific position types were collapsed into 4 primary areas (eg, Epidemiology was subsumed by “Public Health Sciences,” Executive Assistants by “Administration”). It is worth noting that differences in roles, responsibilities, and required experience may exist within and across these jobs that affect earnings. These potential differences are not captured by PH WINS. Another significant consideration is overtime—PH WINS did not ask individuals to parse overtime from normal earnings. It may be the case that some (full-time) individuals work more than the estimated 2000 hours per year. For this reason sensitivity analysis was conducted removing hourly staff; coefficients from the regressions were similar. A final consideration is earnings versus total compensation. This analysis examines only earnings from salary or wages and not fringe benefits. There may be significant variations in benefits packages across SHAs that are different from the distribution of earnings across SHAs. For example, states with relatively higher salaries may or may not have relatively higher benefits packages. This warrants further research.
Conclusion
This is the first study to explore earnings patterns among the state governmental public health workforce. This study confirms that the governmental public health workforce experiences earnings disparities by race and gender. However, the magnitude of these gaps is smaller than national averages or in some other health professions. If the United States is to maintain an adequate supply of well-trained, skilled public health professionals, strategies and solutions will be needed to further reduce disparities and improve earnings satisfaction.
Salary options included less than $25 000; $25 001-$35 000; $35 001-$45 000; $45 001-$55 000; $55 001-$65 000; $65 001-$75 000; $75 001-$85 000; $85 001-$95 000; $95 001-$105 000; $105 001-$115 000; $115 001-$125 000; $125 001-$135 000; $135 001-$145 000; more than $145 000. Hourly equivalents were less than $12.50; $12.51-$17.50; $17.51-$22.50; $22.51-$27.50; $27.51-$32.50; $32.51-$37.50; $37.51-$42.50; $42.51-$47.50; $47.51-$52.50; $52.51-$57.50; $57.51-$62.50; $62.51-$67.50; $67.51-$72.50; more than $72.50. Among full-time employees, wages were annualized at 2000 paid hours worked per year.
These items were collapsed from a list of job classifications respondents were asked to select as best representative of their position. This includes Administration & Business Support—Accountant Fiscal, Clerical Personnel (Administrative Assistant, Secretary), Custodian, Grant and Contracts Specialist, Health Officer, Human Resources Personnel, Information Technology Specialist, Other Facilities Operations worker, Public Health Agency Director, Public Information Specialist; Clinical and Laboratory & Behavioral Health Professional, Community Health Worker, Home Health Worker, Laboratory Aide Assistant, Laboratory Developmental Scientist, Laboratory Scientist (Manager, Supervisor), Laboratory Scientist Medical Technologist, Laboratory Technician, Licensed Practical Vocational Nurse, Medical Examiner, Nutritionist, Other Oral Health Professional, Other Physician, Other Registered Nurse—Clinical Services, Other Veterinarian, Physician Assistant, Public Health Dentist, Public Health Preventative Medicine Physician, Registered Nurse—Community Health Nurse, Registered Nurse—Unspecified; Public Health Science & Animal Control Registered Nurse—Unspecified; Public Health Science & Animal Control Worker, Behavioral Health Professional, Department Bureau Director, Deputy Director, Engineer, Environmentalist, Epidemiologist, Health Educator, Other Management and Leadership, Other Professional and Scientific, Program Director, Public Health Manager Program Manager, Public Health Veterinarian, Public Health Informatics Specialist, Sanitarian Inspector, Technician, Statistician, Student—Professional and Scientific; Social Services and All Other & Social Services Counselor, Social Worker, Other.
These estimates are extrapolated from equidistant salary intervals and so should be viewed as approximations of the respective means.
Nonsupervisors were defined as those who did not supervise other employees. All other employees were supervisory. Supervisory classifications includes team leaders (those who provide employees with day-to-day guidance in work projects but do not have official supervisory responsibility or conduct performance appraisals), supervisors (those who provide employees' performance appraisals and approval of leave, but do not supervise other supervisors), managers (those who supervise ≥1 supervisors), and executive (member of senior executive service or equivalent).
The Public Health Workforce Interests and Needs Survey (PH WINS) was funded by the de Beaumont Foundation. The de Beaumont Foundation and the Association of State and Territorial Health Officials acknowledge Brenda Joly, Carolyn Leep, Vicki Pineau, Lin Liu, Michael Meit, the PH WINS technical expert panel, and state and local health department staff for their contributions to the PH WINS.
The authors declare no conflicts of interest.
REFERENCES
- 1.Gebbie KM, Turnock BJ. The public health workforce, 2006: new challenges. Health Aff (Millwood). 2006;25(4):923–933. 10.1377/hlthaff.25.4.923. [DOI] [PubMed] [Google Scholar]
- 2.Association of Schools of Public Health. Confronting the Public Health Workforce Crisis. Washington, DC: Association of Schools of Public Health; 2008. [Google Scholar]
- 3.Association of State and Territorial Health Officials. State Public Health Employee Worker Shortage Report: A Civil Service Recruitment and Retention Crisis. Washington, DC: Association of State and Territorial Health Officials; 2004. [Google Scholar]
- 4.Association of State and Territorial Health Officials. 2007 State Health Care Workforce Survey Results. Washington, DC: Association of State and Territorial Health Officials; 2008. [Google Scholar]
- 5.Center for State and Local Government Excellence. The impending shortage in the state and local public health workforce. http://slge.org/publications/the-impending-shortage-in-the-state-and-local-public-health-workforce. Published 2008. Accessed March 15, 2015.
- 6.National Association of County & City Health Officials. The Local Health Department Workforce: Findings From the 2005 National Profile of Local Health Departments Study. Washington, DC: National Association of County & City Health Officials; 2007. [Google Scholar]
- 7.Association of State and Territorial Health Officials. Profile of Health. Vol 3 Washington, DC: Association of State and Territorial Health Officials; 2014. [Google Scholar]
- 8.Leider JP, Castrucci BC, Plepys CM, Blakely C, Burke E, Sprague JB. Characterizing the growth of the undergraduate public health major: U.S., 1992-2012. Public Health Rep. 2015;130(1):104–113. [DOI] [PMC free article] [PubMed] [Google Scholar]
- 9.Newman SJ, Ye J, Leep CJ. Workforce turnover at local health departments: nature, characteristics, and implications. Am J Prev Med. 2014;47(5)(suppl 3):S337–S343. 10.1016/j.amepre.2014.07.023. [DOI] [PubMed] [Google Scholar]
- 10.Gebbie K, Merrill J, Tilson HH. The public health workforce. Health Aff (Millwood). 2002;21(6):57–67. [DOI] [PubMed] [Google Scholar]
- 11.The Association of Schools of Public Health Council of Public Health Practice Coordinators. Demonstrating excellence in academic public health practice. J Public Health Manag Pract. 2000;6(1):10–24. [DOI] [PubMed] [Google Scholar]
- 12.Association of State and Territorial Health Officials. Budget Cuts Continue to Affect the Health of Americans—May 2011 Update. Washington, DC: Association of State and Territorial Health Officials; 2011. [Google Scholar]
- 13.Baker EL, Potter MA, Jones DL, et al. The public health infrastructure and our nation's health. Annu Rev Public Health. 2005;26:303–318. 10.1146/annurev.publhealth.26.021304.144647. [DOI] [PubMed] [Google Scholar]
- 14.US Department of Health and Human Services. Healthy People 2010: Understanding and Improving Health. Washington, DC: US Government Printing Office; 2000. [Google Scholar]
- 15.Institute of Medicine. The Future of Public Health. Washington, DC: National Academies Press; 1988. http://www.nap.edu/catalog/1091/the-future-of-public-health. Accessed March 20, 2015. [Google Scholar]
- 16.Beck AJ, Boulton ML, Coronado F. Enumeration of the governmental public health workforce, 2014. Am J Prev Med. 2014;47(5)(suppl 3):S306–S313. 10.1016/j.amepre.2014.07.018. [DOI] [PMC free article] [PubMed] [Google Scholar]
- 17.Gebbie K, Merrill J, Hwang I, Gebbie EN, Gupta M. The public health workforce in the year 2000. J Public Health Manag Pract. 2003;9(1):79–86. [DOI] [PubMed] [Google Scholar]
- 18.Gebbie KM, Merrill J. Enumeration of the public health workforce: developing a system. J Public Health Manag Pract. 2001;7(4):8–16. [DOI] [PubMed] [Google Scholar]
- 19.Gebbie KM, Raziano A, Elliott S. Public health workforce enumeration. Am J Public Health. 2009;99(5):786–787. 10.2105/AJPH.2008.137539. [DOI] [PMC free article] [PubMed] [Google Scholar]
- 20.Kennedy VC. Public health workforce employment in US public and private sectors. J Public Health Manag Pract. 2009;15(3):E1–E8. 10.1097/01.PHH.0000349744.11738.25. [DOI] [PubMed] [Google Scholar]
- 21.Kennedy VC, Spears WD, Loe HD, Jr, Moore FI. Public health workforce information: a state-level study. J Public Health Manag Pract. 1999;5(3):10–19. [DOI] [PubMed] [Google Scholar]
- 22.Beck AJ, Boulton ML. Predictors of capacity in public health, environmental, and agricultural laboratories. J Public Health Manag Pract. 2014;20(6):654–661. 10.1097/PHH.0000000000000050. [DOI] [PubMed] [Google Scholar]
- 23.Beck AJ, Boulton ML, Lemmings J, Clayton JL. Challenges to recruitment and retention of the state health department epidemiology workforce. Am J Prev Med. 2012;42(1):76–80. 10.1016/j.amepre.2011.08.021. [DOI] [PubMed] [Google Scholar]
- 24.Hajat A, Stewart K, Hayes KL. The local public health workforce in rural communities. J Public Health Manag Pract. 2003;9(6):481–488. [DOI] [PubMed] [Google Scholar]
- 25.Draper DA, Hurley RE, Lauer J. Public Health Workforce Shortages Imperil Nation's Health. Washington, DC: Center for Studying Health System Change; 2008. HSC Research Brief No. 4. [PubMed] [Google Scholar]
- 26.DeBoy JM, Boulton ML, Carpenter DF. Salaries and earnings practices in public health, environmental, and agricultural laboratories: findings from a 2010 national survey. J Public Health Manag Pract. 2013;19(3):199–204. 10.1097/PHH.0b013e318252eec2. [DOI] [PubMed] [Google Scholar]
- 27.Hilliard TM, Boulton ML. Public health workforce research in review: a 25-year retrospective. Am J Prev Med. 2012;42(5)(suppl 1):S17–S28. 10.1016/j.amepre.2012.01.031. [DOI] [PubMed] [Google Scholar]
- 28.Leider JP, Bharthapudi K, Pineau V, Lui L, Harper E. The methods behind PH WINS. J Public Health Manag Pract. 2015;21(suppl 6):S28–S35. [DOI] [PMC free article] [PubMed] [Google Scholar]
- 29.National Committee on Pay Equity. The wage gap over time: In real dollars, women see a continuing gap. http://www.pay-equity.org/info-time.html. Updated 2014. Accessed March 9, 2015.
- 30.Miller PW. The gender pay gap in the US: does sector make a difference? J Labor Res. 2009;30(1):52–74. [Google Scholar]
- 31.Muench U, Sindelar J, Busch SH, Buerhaus PI. Salary differences between male and female registered nurses in the United States. JAMA. 2015;313(12):1265–1267. 10.1001/jama.2015.1487. [DOI] [PubMed] [Google Scholar]
- 32.Willett LL, Halvorsen AJ, McDonald FS, Chaudhry SI, Arora VM. Gender differences in salary of internal medicine residency directors: a national survey. Am J Med. 2015;128(6):659–665. 10.1016/j.amjmed.2015.02.002. [DOI] [PubMed] [Google Scholar]
- 33.Coombs J, Valentin V. Salary differences of male and female physician assistant educators. J Physician Assist Educ. 2014;25(3):9–14. 01367895-201425030-00003 [pii]. [DOI] [PubMed] [Google Scholar]
- 34.Jagsi R, Griffith KA, Stewart A, Sambuco D, DeCastro R, Ubel PA. Gender differences in the salaries of physician researchers. JAMA. 2012;307(22):2410–2417. 10.1001/jama.2012.6183. [DOI] [PubMed] [Google Scholar]
- 35.Pollard P, Taylor M, Daher N. Gender-based wage differentials among registered dietitians. Health Care Manag (Frederick). 2007;26(1):52–63. 00126450-200701000-00007. [DOI] [PubMed] [Google Scholar]
- 36.US Census Bureau. Statistical Abstract of the United States: 2012. 131st ed. Washington, DC: US Census Bureau; 2011. [Google Scholar]
- 37.Waters MC, Eschbach K. Immigration and ethnic and racial inequality in the United States. Annu Rev Sociol. 1995;21:419–446. [Google Scholar]
- 38.Couch K, Daly MC. Black-white wage inequality in the 1990s: a decade of progress. Econ Inq. 2002;40(1):31–41. [Google Scholar]
- 39.Campbell LA, Kaufman RL. Racial differences in household wealth: beyond black and white. Res Soc Stratif Mobil. 2006;24(2):131–152. [Google Scholar]
- 40.Grodsky E, Pager D. The structure of disadvantage: individual and occupational determinants of the black-white wage gap. Am Soc Rev. 2001;66(4):542–567. [Google Scholar]
- 41.Boraas S, Rodgers WM., III How does gender play a role in the earnings gap—an update. Monthly Lab Rev. 2003;126:9. [Google Scholar]
- 42.Sellers K, Leider J, Harper E, Castrucci B. Highlights from the Public Health Workforce Interests and Needs Survey: the first nationally representative survey of state health agency employees. J Public Heal Manag Pract. 2015;21(suppl 6):S13–S27. [DOI] [PMC free article] [PubMed] [Google Scholar]
- 43.Harper E, Castrucci BC, Bharthapudi K, Sellers K. Job satisfaction: a critical, understudied facet of workforce development in public health. J Public Health Manag Pract. 2015;21(suppl 6):S46–S55. [DOI] [PMC free article] [PubMed] [Google Scholar]
- 44.Liss-Levinson R, Bharthapudi K, Leider JP, Sellers K. Loving and leaving public health: predictors of intentions to quit among state health agency workers. J Public Health Manag Pract. 2015;21(suppl 6):S91–S101. [DOI] [PMC free article] [PubMed] [Google Scholar]


