

Abstract
Multiple myeloma (MM) is the paradigmatic proteasome inhibitor (PI) responsive cancer, but many patients fail to respond. An attractive target to enhance sensitivity is (macro)autophagy, recently found essential to bone marrow plasma cells, the normal counterpart of MM. Here, integrating proteomics with hypothesis-driven strategies, we identified the autophagic cargo receptor and adapter protein, SQSTM1/p62 as an essential component of an autophagic reserve that not only synergizes with the proteasome to maintain proteostasis, but also mediates a plastic adaptive response to PIs, and faithfully reports on inherent PI sensitivity. Lentiviral engineering revealed that SQSTM1 is essential for MM cell survival and affords specific PI protection. Under basal conditions, SQSTM1-dependent autophagy alleviates the degradative burden on the proteasome by constitutively disposing of substantial amounts of ubiquitinated proteins. Indeed, its inhibition or stimulation greatly sensitized to, or protected from, PI-induced protein aggregation and cell death. Moreover, under proteasome stress, myeloma cells selectively enhanced SQSTM1 de novo expression and reset its vast endogenous interactome, diverting SQSTM1 from signaling partners to maximize its association with ubiquitinated proteins. Saturation of such autophagic reserve, as indicated by intracellular accumulation of undigested SQSTM1-positive aggregates, specifically discriminated patient-derived myelomas inherently susceptible to PIs from primarily resistant ones. These aggregates correlated with accumulation of the endoplasmic reticulum, which comparative proteomics identified as the main cell compartment targeted by autophagy in MM. Altogether, the data integrate autophagy into our previously established proteasome load-versus-capacity model, and reveal SQSTM1 aggregation as a faithful marker of defective proteostasis, defining a novel prognostic and therapeutic framework for MM.
Keywords: aggregate, autophagy, bortezomib, endoplasmic reticulum, multiple myeloma, p62, plasma cells, proteasome, proteasome inhibitors, proteostasis, SQSTM1, ubiquitin
Abbreviations
- Ab
antibody
- amc
7-amino-4-methylcoumarin
- APC
allophycocyanin
- Baf A1
bafilomycin A1
- Btz
bortezomib
- BM
bone marrow
- ER
endoplasmic reticulum
- ERGIC
ER-Golgi intermediate compartment
- GO
gene ontology
- HCQ
hydroxychloroquine
- Ig
immunoglobulin
- IP
immunoprecipitation
- LC-MS/MS
liquid chromatography–tandem mass spectrometry
- MM
multiple myeloma
- pAb
polyclonal antibody
- PBS
phosphate-buffered saline
- PC
plasma cell
- PI
proteasome inhibitor
- Rapa
rapamycin
- SILAC
stable isotope labeling in cell culture
- Ub
ubiquitin
- UPR
unfolded protein response
- UPS
ubiquitin-proteasome system
Introduction
Multiple myeloma (MM) is the paradigmatic cancer susceptible to proteasome inhibitors (PIs), prototypical negative proteostasis regulators.1 Accumulation of ubiquitin-protein conjugates is a crucial mechanism in PI toxicity.2,3 Normal plasma cells (PCs) acquire extreme vulnerability to PIs during their differentiation, due to a dramatic reduction of proteasome capacity, which does not meet the increased load of misfolded proteins requiring proteasomal degradation, thereby triggering stress and lowering the apoptotic threshold.4 This load-versus-capacity model contributes to explain PI sensitivity in malignant PCs, as myelomas with high proteasome capacity and low proteasome workload show relative primary resistance.5 Indicative of cause-effect relationships, both increasing proteasome expression5 and attenuating protein synthesis6 specifically reduced vulnerability of myeloma cells to the first-in-class PI bortezomib.
Despite the undisputed benefits of PIs, a proportion of PI-naïve patients fail to respond,7-9 establishing a strong need to develop biomarkers to identify patients more likely to benefit from PI-based therapy. Notably, such biomarkers may offer targets for novel therapeutic approaches to achieve higher efficacy, prevent side effects, and overcome resistance.2,10-12
Macroautophagy, conventionally referred to as autophagy, is a conserved self-digestive lysosomal recycling pathway that sustains cell metabolism under conditions of nutrient deprivation.13-15 Autophagy also mediates selective degradation of intracellular supramolecular structures, including microbes (xenophagy), protein aggregates (aggrephagy), and organelles, thereby affording innate defense, maintaining protein homeostasis (proteostasis), and exerting critical quality control functions.16,17 In adaptive immunity, selective autophagy mediates key tissue-specific functions, including antigen presentation and T cell development.18,19 Recently, we discovered that autophagy is essential to ensure sustainable immunoglobulin (Ig) production in PCs, through the selective restriction of the endoplasmic reticulum (ER).20 Other groups have independently confirmed the essential role of autophagy in sustaining antibody responses.21 Moreover, we found that autophagy is absolutely required to maintain the resident pool of bone marrow (BM) long-lived PCs, the normal counterpart of MM.20
Autophagy is thought to play a 2-sided, context-dependent role in cancer biology, oncosuppressive in normal cells, and protumoral in established cancers, which may exploit autophagy to resist stress.22 In cellular and animal models of proteotoxicity, autophagy compensates for proteasome insufficiency by clearing protein aggregates.15,23,24 Myeloma cells are thus thought to be particularly dependent on autophagy owing to their distinctive overloaded ubiquitin (Ub)-proteasome system (UPS).10-12 Hence, defining the constitutive levels, exact homeostatic functions and molecular mechanisms of autophagy in MM cells is needed to design specific strategies to disarm this cancer.
Selective autophagic degradation is achieved through proteins that act as specific cargo receptors, which crosslink the substrate with the autophagic machinery. The prototypical receptor, SQSTM1/p62, is a multifunctional signaling adapter protein that has been implicated in a number of selective autophagic processes.17
In the present work, we investigated the role of SQSTM1 in the maintenance of protein homeostasis in MM cells. By combining unbiased proteomics and hypothesis-driven technologies, we identified a SQSTM1-dependent autophagic reserve that not only cooperates with the UPS for the clearance of Ub-protein conjugates, but is also capable of adapting to proteasome stress, through enhanced SQSTM1 expression and a profound reshaping of its interactome, revealing a tighter collaboration between the UPS and autophagy than previously thought. As a result, SQSTM1 is critical for MM cell survival, and its inhibition sensitizes to PIs. Moreover, the presence of SQSTM1-containing protein aggregates emerges as a novel potential biomarker of PI susceptibility of therapeutic and prognostic value.
Results
Intense autophagy constitutively degrades ubiquitinated proteins to prevent accumulation of SQSTM1-positive protein aggregates in myeloma cells
To quantify overall autophagic activity in MM cells, we assessed the rate of lysosomal digestion of lipidated, autophagosome-bound MAP1LC3A/LC3A (LC3A-II) in a panel of 6 MM lines. All 6 cell lines showed intense autophagic fluxes (Fig. 1A). In particular, their autophagic activity was 5- to 50-times higher than in the B lymphomas MEC1 (Fig. 1A) and RAJI (not shown). Stable lentiviral silencing of the essential autophagic molecule ATG7 confirmed the critical role of autophagy in maintaining MM cell survival (Fig. S1).25,26
Figure 1.

Autophagy inhibition leads to accumulation of SQSTM1+ undigested protein aggregates in MM cells. (A) Immunoblot analysis of endogenous unconjugated LC3-I to lipid-conjugated LC3-II and SQSTM1 in multiple myeloma (MM) cell lines. The MEC1 lymphoma and the indicated MM cell lines were treated for 2 h with 50 mM NH4Cl or left untreated, lysed in 1% SDS and analyzed by western blot with anti-LC3 Ab (left). ACTB/actin serves as a loading control throughout. Right, autophagic flux quantified as the difference of LC3-II band intensity with and without NH4Cl, normalized on MEC1 values (average ±s.e.m., n = 5). (B) Immunoblot analysis of ubiquitinated proteins, SQSTM1 and LC3 in MM cells treated with 100 nM bafilomycin A1 (Baf A1) for 24 h (representative image, n = 3). (C) Immunofluorescence analysis of SQSTM1 (green) and ubiquitin (red) in MM.1S cells. Nuclei are stained blue with DAPI. Scale bars: 10 µm. (D) Immunofluorescence analysis of SQSTM1 and ubiquitin in MM.1S and OPM2 cells treated with chloroquine (50 µM) or bafilomycin A1 (100 nM) for 24 h. Nuclei are stained blue with DAPI. Scale bars; 10 µm. (E) Representative immunoblot analysis of SQSTM1 in MM cells treated with 100 nM Baf A1 for 24 h and lysed in 1% NP-40. Insoluble material was treated with 1% SDS and the DNA was sonicated. NP-40 soluble and insoluble fractions were quantified and equal protein amounts resolved by SDS-PAGE.
To address the function of such intense constitutive autophagy, we asked if it mediates the clearance of Ub-conjugated proteins in MM cells. Distal pharmacological inhibition of autophagy induced remarkable accumulation of heterogeneous ubiquitinated proteins and of the prototypical autophagic receptor, SQSTM1 (Fig. 1B). Immunofluorescence experiments revealed Ub-protein aggregates that colocalized with SQSTM1 (Fig. 1C). Moreover, autophagy blockade led to a remarkable increase in the number and size of SQSTM1+ cytoplasmic aggregates (Fig. 1D), and induced substantial accumulation of SQSTM1 in detergent-insoluble cellular fractions (Fig. 1E). The data demonstrate abundant and constitutive autophagic clearance of ubiquitinated proteins in MM cells, and suggest SQSTM1 as the receptor involved in such clearance.
Collaboration of the proteasome and autophagy to maintain protein homeostasis and viability of MM cells
The finding that autophagy constitutively contributes substantial clearance of ubiquitinated proteins suggests that it may play a crucial role in alleviating proteasome stress in MM cells, if substrates were shared with the UPS. To test this hypothesis, we attempted to increase or reduce PI toxicity, respectively, by weakening or empowering autophagy. Treatment with nontoxic doses of bortezomib and the distal authophagy inhibitor leupeptin yielded dramatic accumulation of Ub-protein conjugates and insoluble SQSTM1 (Fig. 2A–B), which preceded massive synergistic cell death in MM lines (Fig. 2C) and in primary, patient-derived MM cells (Fig. 2D). Conversely, stimulation of autophagy substantially prevented PI-induced accumulation of Ub-proteins (Fig. 2E) and the subsequent death of MM cells (Fig. 2F-G). The data establish that in myeloma cells autophagy cooperates with the proteasome, sharing Ub-protein substrates, and limits PI sensitivity. However, in our hands, autophagic inhibition by lentiviral ATG7 silencing or by hydroxychloroquine (HCQ) caused minor increases of bortezomib-induced toxicity in MM cell lines (Figs. S1F and S2). The data also suggest that, by integrating stress of both the UPS and autophagy, accumulation of insoluble SQSTM1 (Fig. 2B and E) may predict proteotoxicity.
Figure 2.

For figure legend, see page 1165.
SQSTM1 is essential to myeloma cells and yields specific protection against proteasome inhibitors
In view of the tight cooperation of the UPS and autophagy documented in MM cells, we next challenged the relevance of SQSTM1 in myeloma cell viability and PI sensitivity. To this aim, we achieved stable SQSTM1 silencing by lentiviral shRNA expression. Reduction of SQSTM1 protein abundance in MM cell lines (Fig. 3A and Fig. S3A) induced significant decrease of intracellular ATP (Fig. 3B) and remarkable toxicity, with massive death of SQSTM1-silenced MM lines in less than 2 wk, as assessed by apoptosis and colony-forming assays (Fig. 3C, D and Fig. S3B). Conversely, a comparable reduction of SQSTM1 expression in 2 B lymphomas elected as controls (Fig. 3A) induced significantly less or negligible death (Fig. 3C), suggesting that SQSTM1 requirement is specific to PCs. We then exploited the timeframe preceding overt toxicity to test if SQSTM1 confers specific protection against PIs. Prior to the onset of cell death, SQSTM1-silenced MM cells revealed significantly increased susceptibility to bortezomib-induced accumulation of ubiquitinated proteins and toxicity (Fig. 3E, F and Fig. S3C). The protective activity of SQSTM1 was specific, as its reduction failed to affect the toxicity of the distinct anti-myeloma agent doxorubicin (Fig. 3F). Thus, MM cells require SQSTM1 for survival and specific inherent resistance to PIs.
Figure 3.

For figure legend, see page 1167.
Proteasome stress co-opts SQSTM1 onto protein aggregates and induces de novo SQSTM1 expression
The increased sensitivity of SQSTM1-silenced MM cells to PIs urged us to address the mechanisms whereby SQSTM1 mediates PI resistance in MM cells. Along with its role as an autophagic receptor, SQSTM1 is a multi-tasking adapter protein regulating multiple signaling pathways. We thus examined its expression, distribution, and activity under proteasome stress. Short (1 h) treatment with a high dose (1 µM) of the first-in-class PI bortezomib induced the appearance of large (∼100 nm to >1 µm) SQSTM1+ aggregates in MM cells (Fig. 4A), with a Ub+ core surrounded by SQSTM1 (Fig. 4B). Immunoprecipitation (IP) experiments demonstrated the specific interaction of SQSTM1 and ubiquitinated proteins. Such interaction was magnified by PIs, while the prototypic interaction with KEAP1, which promotes NFE2L2/NRF2-dependent anti-oxidant responses, was greatly reduced (Fig. 4C). We then adopted stable isotope labeling in cell culture (SILAC) proteomics to precisely quantify the changes of the SQSTM1 interactome upon proteasome inhibition (experimental design illustrated in Fig. S4A, B). Under basal conditions, SQSTM1 bound a number of known interactors, e.g., KEAP1, PRKCI, and Ub (Table 1). Noticeably, proteasome inhibition induced a dramatic change of the SQSTM1 interactome, with Ub increasing by ∼10 times, at the expense of other interactors (Fig. 4D and Table 1). Moreover, SQSTM1 expression analyses revealed that bortezomib also selectively increased de novo expression of SQSTM1, but not of the autophagic receptors NBR1 and OPTN/optineurin, as demonstrated by increased transcript and protein levels (Fig. 4E, F and Fig. S4C), an effect independent of autophagy (attested to by no consistent change in LC3 conversion in Fig. 4F) and completely prevented by inhibition of protein translation (Fig. 4G). Together, the data reveal a previously unrecognized 2-fold adaptive response deployed by MM cells under proteasome stress, consisting of rapid co-opting of SQSTM1 onto Ub-protein aggregates, at the expense of its signaling activities, and enhanced SQSTM1 expression.
Figure 4.

Acute proteasome stress co-opts SQSTM1 onto protein aggregates, and induces de novo SQSTM1 expression. (A, B) Immunofluorescence analysis of SQSTM1 and ubiquitin accumulation in MM lines upon treatment with bortezomib (Btz). Nuclei are stained blue with DAPI. Scale bars: 10 µm. (A) SQSTM1 in MM.1S cells left untreated (left) or treated for 1 h with 1 µM Btz (right) (n = 5 independent experiments). (B) SQSTM1 and ubiquitin in MM.1S cells treated with Btz (as in A). (C) Co-immunoprecipitation (IP) of polyubiquitinated proteins with SQSTM1. MM.1S cells were treated with Btz (as in A), prior to IP of SQSTM1, and the association of ubiquitinated proteins and KEAP1 with SQSTM1 assessed by immunoblot (n ≥ 3 ). (D) Changes of selected proteins of the SQSTM1 interactome upon treatment with Btz (as in A) as determined by SILAC LC-MS/MS in MM.1S cells (more proteins listed in Table 1). (E) Quantitative RT-PCR analysis of transcripts encoding the indicated autophagy receptors in MM lines treated with 1 µM Btz for 4 h. mRNA amounts were normalized by histone H3 and expressed relative to untreated controls (average induction ±s.e.m.; n = 3). (F) Immunoblot analysis of SQSTM1 and LC3 in the indicated MM lines treated with 1 µM Btz for 8 h (representative blot, n = 3). (G) Immunoblot analysis of SQSTM1 in MM.1S cells treated with 1 µM Btz for 8 h in the presence or absence of 10 µg/ml cycloheximide (CHX).
Table 1.
The interactome of SQSTM1 in basal conditions and under proteasome stress
| Protein | Gene name | SQSTM1/Control ratio | Btz/UT ratio |
|---|---|---|---|
| sequestosome 1 | SQSTM1 | 10.38 | 1 |
| kelch-like ECH-associated protein 1 | KEAP1 | 9.67 | 0.57 |
| ependymin related 1 | EPDR1/UCC1 | 9.19 | 0.68 |
| glioblastoma amplified sequence | GBAS | 8.71 | 0.25 |
| insulin receptor | INSR | 8.07 | 3.12 |
| protein kinase C, iota | PRKCI | 5.60 | 0.87 |
| NOP2/Sun domain family, member 4 | NSUN4 | 4.65 | 0.32 |
| growth arrest-specific 6 | GAS6 | 4.23 | 0.68 |
| tripartite motif containing 21 | TRIM21 | 3.62 | 1.91 |
| NADH dehydrogenase (ubiquinone) Fe-S protein 2, 49kDa (NADH-coenzyme Q reductase) | NDUFS2 | 3.04 | 0.62 |
| NADH dehydrogenase (ubiquinone) Fe-S protein 3, 30kDa (NADH-coenzyme Q reductase) | NDUFS3 | 2.82 | 0.51 |
| G elongation factor, mitochondrial 2 | GFM2 | 2.71 | 2.29 |
| hydroxyacyl-CoA dehydrogenase/3-ketoacyl-CoA thiolase/enoyl-CoA hydratase (trifunctional protein), β subunit | HADHB | 2.54 | 2.60 |
| NADH dehydrogenase (ubiquinone) 1 α subcomplex, 5 | NDUFA5 | 2.50 | 1.16 |
| hydroxyacyl-CoA dehydrogenase/3-ketoacyl-CoA thiolase/enoyl-CoA hydratase (trifunctional protein), α subunit | HADHA | 2.28 | 1.93 |
| CD48 molecule | CD48 | 2.13 | 0.68 |
| lactate dehydrogenase A | LDHA | 2.09 | 1.57 |
| reticulocalbin 2, EF-hand calcium binding domain | RCN2 | 2.08 | 1.09 |
| ubiquitin | UBC; UBB | 2.05 | 9.93 |
Specific SQSTM1 interactors with a SQSTM1/control ratio > 2. Bortezomib (Btz) / untreated (UT) ratios indicate relative interaction changes upon treatment.
SQSTM1+ protein aggregates specifically predict proteasome inhibitor susceptibility in MM lines and patient-derived myelomas
Having identified a key protective role for SQSTM1 in mediating the autophagic degradation of proteasome-undigested Ub-proteins in MM cells (Fig. 4), and in view of the strong correlation between SQSTM1 aggregation and subsequent toxicity observed in vitro (Fig. 2), we then explored the prognostic significance of SQSTM1 as a biomarker of primary PI susceptibility. This idea stemmed from 2 observations: first, that PI-sensitive MM.1S cells displayed SQSTM1+ aggregates in basal conditions, whereas relatively resistant OPM2 cells did not (Fig. 1); second, that SQSTM1 aggregation preceded cell death upon treatment with toxic doses of proteasome and autophagy inhibitors, alone or in combination (Fig. 2). Hence, we hypothesized that SQSTM1 aggregation could serve as a reliable marker of insufficient autophagic reserve and proteotoxicity.
To test this hypothesis, we extended the immunofluorescence and biochemical analyses of SQSTM1 accumulation to a panel of 11 MM lines, hallmarked by differential intrinsic sensitivity to bortezomib, as determined in standard 24-h apoptotic response curves (Fig. S5A). Immunoblotting experiments showed remarkable accumulation of SQSTM1 in the lines characterized by lower EC50 values (Fig. 5A, left panel and Fig. S5B). Moreover, we found SQSTM1 in detergent-insoluble fractions and in immunofluorescent aggregates exclusively in the most PI-sensitive lines (Fig. 5A, right, 5B, and Fig. S5C). Accumulation of SQSTM1+ aggregates specifically reported on defective proteostasis, as the average cell count of SQSTM1+ puncta in each line correlated significantly with the EC50 of bortezomib (Fig. 5C), but not with that calculated with the distinct anti-myeloma agent, dexamethasone (Fig. 5D).
Figure 5.

For figure legend, see page 1171.
We then challenged the significance of SQSTM1+ puncta in primary MM cells purified from newly diagnosed MM patients. Notably, also in patient-derived cells, we could neatly discriminate between myelomas that do or do not display SQSTM1+ puncta (Fig. 5E). The presence of SQSTM1+ structures identified the myelomas with the highest susceptibility to bortezomib in vitro (i.e., EC50 ≤5 nM) (Fig. 5F). Moreover, the average cellular count of SQSTM1+ puncta within each tumor population significantly correlated with the EC50 of bortezomib determined in vitro (Fig. 5G). The coincidence of accumulation of SQSTM1+ aggregates with exquisite inherent PI sensitivity also in primary samples confirms saturation of a putative protective autophagic reserve. The data provide proof-of-principle evidence and pre-clinical validation of SQSTM1 aggregation as a single-cell indicator of intrinsic susceptibility to PIs.
A proteostatic autophagic reserve is saturated in PI-sensitive myelomas
The observation of SQSTM1 aggregation selectively in most PI-sensitive myelomas (Fig. 5) suggested the existence of a functional autophagic reserve saturated in basal conditions in those tumors. Indeed, when we challenged a panel of MM lines with low dose (5 nM) bortezomib, relatively PI-resistant lines did not accumulate ubiquitinated proteins, while PI-sensitive cells did, despite the fact that comparable proteasome inhibition had been achieved (Fig. 6A, B). To test if this differential proteostatic reserve is accounted for by autophagy, we utilized pharmacological and genetic inhibition. In keeping with our hypothesis, immunofluorescent detection of SQSTM1+ puncta revealed defective autophagic clearance of bortezomib-induced aggregates in PI-sensitive MM lines (Fig. 6C, D). Immunoblotting experiments confirmed that bortezomib was sufficient to induce the accumulation of insoluble SQSTM1 in PI-sensitive MM lines, whereas the distal autophagy inhibitor bafilomycin A1 was required to induce accumulation of insoluble SQSTM1 in PI-resistant cells (Fig. 6E). Indeed, in these cells, inhibition of autophagy, as achieved by cotreatment with leupeptin or by previous lentiviral ATG7 RNAi, maximized the limited accumulation of ubiquitinated proteins induced by subtoxic proteasome stress (Fig. 6F). Together, these experiments formally demonstrate the existence, in MM cells, of an autophagic reserve required to cope with PI-induced proteotoxicity and maintain proteostasis, and that such reserve is saturated in PI-sensitive myelomas.
Figure 6.

For figure legend, see page 1173.
The ER is a major autophagic substrate that accumulates in PI-sensitive myelomas
The observation that SQSTM1-containing aggregates hallmark certain myelomas, but not all (Fig. 5), raises the question as to whether additional targets burden autophagy. We recently discovered that the ER is the main cell compartment degraded by autophagy in normal PCs.20 To test if reticulophagy is a major autophagic task also in malignant PCs, we adopted an unbiased proteomic approach to define the cell compartments that are constitutive targets of autophagy in MM cells. We first studied OPM2 cells, in which SQSTM1 degradation and autophagy are most proficient, and then extended our observations to other cell lines. The proteome of OPM2 cells was labeled by SILAC and the changes of individual proteins upon pharmacological autophagy inhibition quantified by LC-MS/MS. We achieved distal autophagy blockade by treating MM cells for 24 h with the lysosomal inhibitor leupeptin at a dose that arrested the autophagic flux (Fig. S6A), causing no toxicity (loss of ATP or viability), no proteasome stress (accumulation of Ub-proteins), and no adaptive activation of the unfolded protein response (UPR) (Fig. S6B–E). In 2 different experiments with inverted isotope labeling, we identified 981 proteins with at least 2 peptides quantified in both experiments (Dataset S1). We found 45 proteins consistently and significantly upregulated by leupeptin. These included established components of the secretory apparatus, such as LMAN1/ERGIC53, ERP44, and RAB7A (Table S1). Gene ontology (GO) analysis of upregulated proteins among the 981 quantified found significant specific enrichment of ER-resident proteins (GO:0005789; p = 0.041) and the Golgi apparatus (GO:0005794; p = 0.039), together with the expected lysosomal compartment (GO:0005764; p = 0.024). By extending the GO analysis to all quantified proteins, we found lysosomal inhibition to induce a concerted, significant increase of ER membrane proteins (n = 32, average increase 4.3%), ERGIC (n = 12, average increase 7.6%) and Golgi (n = 60, average increase 6.6%). Conversely, no increase was found in ribosomal, nuclear and cytosolic proteins, whereas a slight, concerted increase was detected for mitochondrial proteins (n = 167, average increase 0.7%) (Fig. 7A). A significant increase of selected components of the secretory apparatus was also confirmed upon genetic inhibition of autophagy in ATG7-silenced MM cells by immunoblotting (Fig. S6F). Also in this independent setting, we excluded autophagy inhibition to induce a UPR, by documenting no increase of total and spliced XBP1, P4HB/PDI, and HSPA5/BiP mRNA (Fig. S6G), further confirming that ER expansion stemmed from defective protein digestion, rather than from increased biogenesis. The data demonstrate a selective negative control exerted by autophagy on the secretory pathway in MM cells, previously recognized only in normal PCs.20 Interestingly, we found that Ig molecules did not accumulate upon lysosomal inhibition, indicating that misfolded Igs are recycled via the canonical proteasomal ER-associated degradation, at least in light chain-producing myeloma cells (Fig. S7; Table S2), confirming our previous findings in normal plasma cells.20 Next, we confirmed that autophagy negatively regulates the ER in a panel of MM lines by revealing increased abundance of representative ER resident proteins upon pharmacological autophagic inhibition (Fig. 7B).
Figure 7.
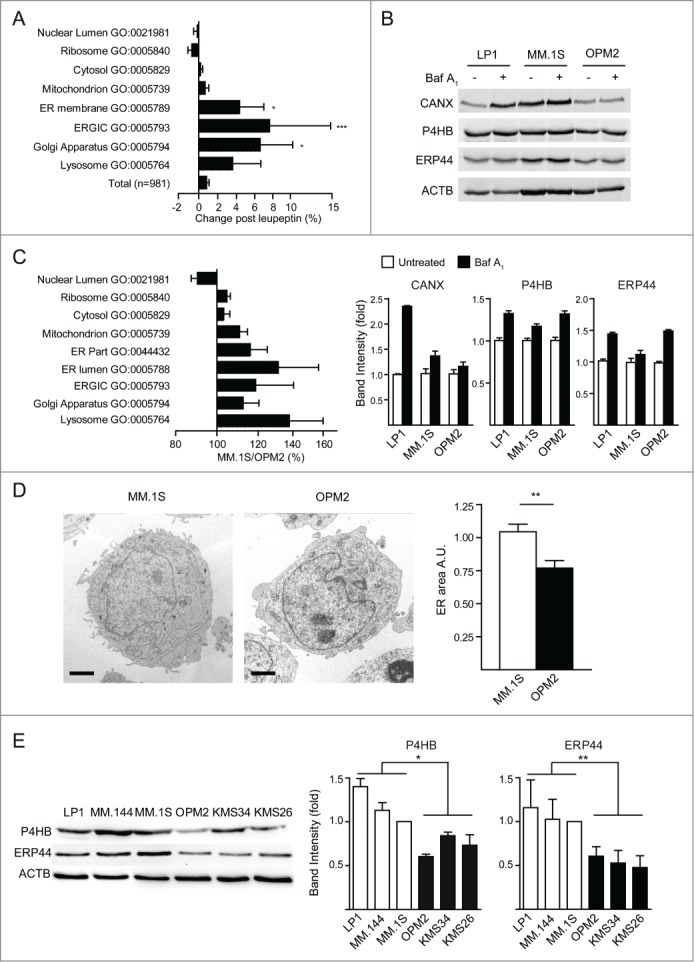
Endoplasmic reticulum is the main cell compartment degraded by autophagy in MM cells. (A) Proteome changes upon autophagy inhibition (as in Fig. S4) by SILAC LC-MS/MS. The 981 proteins quantified in 2 independent experiments were grouped by the indicated gene ontology (GO) categories (average ratios ±s.e.m.; significance calculated against all quantified proteins). (B) Immunoblot analysis of selected ER proteins in MM cells treated with 100 nM bafilomycin A1 (Baf A1) for 24 h (representative image, n = 4). Top, representative blots; bottom, quantification normalized by ACTB/actin expressed relative to untreated cells (average ±s.e.m., n = 4). (C) Relative protein abundance in MM.1S vs. OPM2 cells by SILAC. The relative abundance of 1,674 proteins was quantified in 2 independent experiments. Proteins were assigned to the corresponding GO cell compartment (average GO values ±s.e.m.). (D) ER morphology was assessed in OPM2 and MM.1S by electron microscopy and the area of the cell occupied by the ER was quantified by stereology. Left, representative images; right, quantification (average ±s.e.m.; n ≥ 30 cells per line). Scale bar: 1 µm. (E) Selected ER proteins were quantified in MM lines by immunoblot analysis. Left, representative blots (n = 4 independent experiments). Right, average quantification ±s.e.m. *P < 0 .05; **P < 0 .01; ***P < 0 .001 by unpaired Student t test.
Having identified the ER as a major autophagic substrate in MM cells, we then hypothesized the saturated autophagic reserve identified in relatively PI-sensitive myelomas, as indicated by SQSTM1+ aggregates, to be associated with higher ER abundance. To test this hypothesis, we performed a proteomic and morphological comparison, respectively by SILAC LC-MS/MS and electron microscopy, of the MM lines containing respectively the highest and lowest number of SQSTM1+ puncta per cell, namely MM.1S and OPM2 cells. This combined approach revealed higher abundance of the ER in MM.1S cells (Fig. 7C-D; Dataset S2; Table S3). We confirmed this finding by immunoblotting analyses of representative ER proteins that were significantly more abundant in PI-sensitive than in PI-resistant MM lines (Fig. 7E).
By identifying the ER as the main cell compartment constitutively degraded by autophagy in MM cells, whose accumulation correlates with SQSTM1-containing aggregates, the data confirm that the autophagic capacity is saturated in inherently PI-sensitive myelomas.
Together, the data provide a more comprehensive and integrated picture of the cellular determinants of proteostasis and PI sensitivity in myeloma cells.
Discussion
The role of autophagy in cancer is multifaceted. In keeping with its cytoprotective action, loss-of-function mutations of genes encoding autophagic players have been linked with tumorigenesis, supporting the notion that autophagy is oncosuppressive in normal cells.22,27 The underlying mechanisms include the disposal of oncogenic proteins and damaged organelles, preventing local inflammation, necrosis, accumulation of reactive oxygen species, and oncogenic mutations.28-31 Conversely, due to deregulated growth, cancer cells generally experience more stress (e.g., hypoxia, nutrient deprivation, oxidative stress) and rely on adaptive strategies more than normal cells.32,33 Autophagy may thus be essential for transformed cells to resist metabolic, environmental, and pharmacological stress. Hence, autophagy inhibitors may be effective against cancer by killing tumor cells or sensitizing them to chemotherapy.22
In addition, specific metabolic features could render certain tumors particularly dependent on autophagy. This applies to RAS-driven cancers, owing to impaired acetyl-CoA biosynthesis.22 Myeloma has been proposed to be particularly reliant on autophagy, due to its extraordinary UPS dependence, demonstrated by the successful clinical use of PIs,2 owing, at least in part, to an imbalance between high proteasome workload, contributed by intensive Ig synthesis, and limited proteasome complement.5,34 Such imbalance is a general trait of Ig-producing PCs, which are also extremely PI-sensitive in vitro4 and in vivo.35,36 Long viewed as independent strategies with distinct substrates, the UPS and autophagy are now recognized as interdependent and complementary. Indeed, autophagy is activated in response to, and partially compensates for, proteasome impairment.15,23,24
The results presented herein are in keeping with previous reports supporting a protective role for basal autophagy in MM cell survival. However, pharmacological or genetic autophagic inhibition yielded discrepant results on PI sensitivity, ranging from synergy to antagonism.10,25,26,38,39 Notably, a phase 1 clinical trial showed that the combined use of bortezomib and HCQ for relapsed or refractory myeloma may improve therapeutic outcomes.40 In our hands, autophagy inhibition with leupeptin or SQSTM1 RNAi sensitized to bortezomib, and autophagy induction with rapamycin reduced PI sensitivity (Figs. 2 and 3), but HCQ and ATG7 RNAi had no remarkable effects on PI toxicity (Figs, S1–S2). Such controversies might in part be accounted for by nonspecific effects achieved on additional signaling pathways, especially in the case of proximal autophagic inhibition.
Despite the general belief that autophagy inhibition should be beneficial against myeloma,10,11 we reasoned that our current poor understanding of the role of autophagy in this malignancy limits its therapeutic exploitation. Our recent discovery that long-lived plasma cells completely depend on autophagy20 urged us to dissect the precise functions of autophagy in myeloma, to identify specific cargo-recognizing mechanisms, as a framework for novel markers and targets.
Autophagy serves a variety of cell-specific functions through selective target digestion via distinct receptor/adapter proteins.41 We thus set out to test the role of the prototypical autophagic receptor, SQSTM1 in MM cells, assuming that a deeper knowledge of the molecular mechanisms of cargo selection may offer a framework to design more specific therapeutic agents.
Our work establishes SQSTM1 as an essential mediator of the cooperation between the UPS and autophagy in MM cells, providing a potential target to overcome PI resistance. First, we found that autophagy constitutively degrades aggregation-prone ubiquitinated proteins, as autophagy inhibition alone was sufficient to induce the accumulation of SQSTM1- and Ub-containing protein aggregates (Figs. 1 and S2). The relevance of SQSTM1-dependent autophagy as a functional reserve regulating PI susceptibility of MM cells is demonstrated by the documented capacity of autophagy inhibition or stimulation to respectively synergize or antagonize with the PI-induced build-up of ubiquitinated proteins and subsequent toxicity (Fig. 2). The coexistence of SQSTM1 aggregation and abundant autophagy in PI-sensitive myelomas in basal conditions suggests that certain tumors require more autophagic activity than they deploy. Indeed, an increased demand imposed by acute proteasome stress is coped for by autophagy in PI-resistant MM cells, while aggravating accumulation of SQSTM1+ aggregates in PI-sensitive myelomas (Fig. 6). Taken together, our results yield proof-of-concept evidence in PI-sensitive myelomas of an insufficient autophagic reserve in the face of stresses that increase the functional demand for autophagy.
Moreover, we disclosed that MM cells adapt to proteasome stress via SQSTM1. We devised, for the first time, a wide-scope, quantitative LC-MS/MS analysis of proteins co-immunoprecipitated with endogenous SQSTM1 to define the interactome of SQSTM1 in steady conditions and under proteasome stress, using the SILAC technology to precisely quantify PI-induced changes. Together with immunofluorescence experiments, this powerful, unbiased approach led us to recognize the association of Ub-protein aggregates with SQSTM1 in myeloma cells. Moreover, we visualized aggregates nucleating into large, supra-micrometric bodies under PI treatment, and found a dramatic co-opting of SQSTM1 onto Ub-protein aggregates at the expense of other signaling partners. As a multi-domain adapter protein, SQSTM1 is a hub for multiple signaling pathways, including NFKB and KEAP1-NFE2L2, along with its recognized role in autophagic cargo recognition.42,43 Our unbiased dynamic study of the SQSTM1 interactome revealed an intriguing adaptation of MM cells to proteasome stress, aimed to intensify the autophagic activity of this protein. Furthermore, we found that PIs not only divert SQSTM1 toward ubiquitinated proteins, but also selectively induce its de novo expression (Fig. 4). Together, these mechanisms define an unanticipated 2-fold adaptive plastic response to PIs, by which myeloma cells boost autophagic degradation of aggregates to compensate for UPS insufficiency. The data indicate that in MM cells autophagy and the UPS cooperate more closely than previously thought, as both constitutively degrade Ub-conjugated proteins, and provide insights into the nature and mechanisms of this cooperation. By furthering our understanding of the tight interplay between autophagy and the UPS,44 these findings may help explain PI resistance and unveil new therapeutic targets. Indeed, the genetic ablation of SQSTM1 resulted in increased susceptibility to PIs and in vitro extinction of MM cell lines (Fig. 3).
Functional redundancy exists among autophagic receptors,17 as witnessed by the nonlethal mouse phenotype of systemic SQSTM1 deficiency,45 and by the tissue-restricted and late-onset phenotype of Paget disease of bone, typically associated with germline inactivating mutations of the Ub-binding domain of SQSTM1.46 Thus, the absolute requirement of SQSTM1 for MM cell survival offers a specific therapeutic target, and a framework for identifying additional new targets.
Further supporting specificity, while SQSTM1 is protective to MM cells, it demonstrates toxicity in distinct models, possibly via hampered proteasomal degradation of substrates sequestered into insoluble aggregates.47 In mice with liver-specific ablation of autophagy, SQSTM1 silencing prevents protein aggregation, oxidative stress, and tissue hypertrophy.48 Such toxicity of SQSTM1 was suppressed by NFE2L2 ablation, suggesting that the otherwise protective SQSTM1-KEAP1-NFE2L2 axis may turn maladaptive in certain conditions.49 The addiction of MM cells to SQSTM1-dependent autophagy for survival, identified herein, may reflect the fragile proteostasis of malignant PCs, already challenged in the absence of exogenous stressors, with overloaded UPS, high PI vulnerability, and intense autophagy.12 Accordingly, we found that SQSTM1 silencing was extremely toxic for MM cell lines, but not for B lymphomas, and that its knockdown specifically sensitized MM cells to the first-in-class PI bortezomib, but not to other anti-myeloma agents (Fig. 3). The mechanisms whereby insufficient SQSTM1-dependent autophagy is toxic to MM cells remain to be elucidated. A recent report of BIK-mediated apoptosis triggered by SQSTM1 downregulation upon autophagy induction suggests a possible mechanism.50
Through unbiased analyses of cells in which autophagy had been blocked pharmacologically or genetically, our work disclosed that in MM cells autophagy not only disposes of aggregation-prone ubiquitinated proteins, but also constitutively restricts the secretory compartment, a previously unrecognized function in MM cells (Fig. 7). Both activities are predicted to reduce the UPS workload.2,12 The data extend our previous finding that autophagy moderates ER expansion in normal differentiating PCs to their malignant counterparts.20
The present study provides a more comprehensive understanding of protein degradation in MM cells. In view of the tight and multifaceted cooperation, documented herein, between autophagy and the UPS, the data encourage us to integrate the model currently proposed to underlie PI sensitivity, which exclusively refers to the proteasomal workload and capacity,5 so as to include autophagy in the functional assessment of MM cell biology. The peculiar feature of being induced by PIs and specifically digested by autophagy renders SQSTM1 an integrated reporter of stress in both proteocatabolic routes, possibly indicative of high susceptibility of myeloma cells to negative proteostasis regulators, and particularly PIs. Indeed, we found that the presence of SQSTM1+ aggregates, as assessed biochemically or by immunofluorescence, neatly discriminated between 2 groups of MM lines or patients, characterized by differential inherent vulnerability to PIs (Fig. 5). This striking correlation urges us to test SQSTM1 as a potential, highly needed single-cell prognostic tool to predict individual clinical responses to PI treatment. The circumstance that both the abundance and cellular distribution of SQSTM1 change under proteasome stress is likely to magnify its accuracy as a reporter. Should this marker be able to predict the clinical responsiveness to PIs, at least in selected groups of patients, a new tool could be developed for clinical hematologists to help inform the design of personalized therapeutic regimens.
Materials and Methods
Cell cultures
Human myeloma cell lines (kindly provided by Giovanni Tonon, San Raffaele Scientific Institute, Milan, Italy) and B lymphoma cell lines (kindly provided by Paolo Ghia, San Raffaele Scientific Institute, Milano, Italy) were cultured in RPMI medium (Gibco-Life Technologies, 31860) supplemented with 10% fetal bovine serum (Euroclone, ECS0180L), L-glutamine (2 mM; Gibco-Life Technologies, 25030–081), penicillin/streptomycin (100 μg/ml; Lonza, 17–602E) and sodium pyruvate (1 mM; Sigma-Aldrich, S8636). Each culture was examined for Ig secretion and SDC1/CD138 expression, and periodically tested for mycoplasma negativity. All lines are routinely genotyped by the Tonon lab using 2 protocols, one based on a set of a microsatellite markers set in collaboration with the Mayo Clinic (Scottsdale, AZ), and a second one, based on short tandem repeats assessment, as developed by the DSMZ (details at http://www.dsmz.de/services/services-human-and-animal-cell-lines/online-str-analysis.html).
Patient-derived MM cells were purified from BM aspirates by SDC1 immunomagnetic-positive selection using the Human Plasma Cell Isolation kit (Miltenyi Biotech, 130–093–628). Informed consent was obtained in accordance with the declaration of Helsinki. Approval for use of primary samples was obtained from the Institutional Review Board of the San Raffaele Scientific Institute. Cells were treated with leupeptin, bafilomycin A1, chloroquine, rapamycin, hydroxychloroquine (Sigma-Aldrich, L2884, B1793, C6628, R8781, H0915) or bortezomib (Millennium, VELCADE™) as indicated.
Flow cytometric analyses of cell viability
Cells were treated as indicated, harvested and stained with fluorescein isothiocyanate or allophycocyanin (APC)-conjugated ANXA5/annexinV (BD PharmMingen, 556547, 550474) and propidium iodide, as per the manufacturer's instructions. SDC1 positivity was controlled with anti-human SDC1 APC conjugated antibody (Ab) (Miltenyi Biotec, 130–091–250). Data were obtained with Accuri C6 Flow Cytometer (BD biosciences, San Jose, CA) and analyzed using the FCS Express 4 Flow Research Edition (De Novo Software). Patient-derived MM cells were seeded at 30,000 cells/well and treated for 24 h as indicated.
Lentiviral RNA interference
Plasmid constructs expressing anti-ATG7, anti-SQSTM1, and control shRNAs were obtained with Mission shRNAs pLKO.1-puro (nontarget shRNA: SHC002; shATG7 1: TRCN0000007584; shATG7 2: TRCN0000007587; shSQSTM1 1:TRCN0000007234; shSQSTM1 2: TRCN0000007236; Sigma-Aldrich). Lentiviral vectors were packaged with Sigma-Aldrich Mission shRNAs, pMD2-VSV-G, pMDLg/pRRE and pRSV-Rev plasmids in HEK 293T cells for 14 h, then medium was replaced and 1 mM Na-butyrate added. 48 h later cell supernatant fractions were collected, ultracentrifuged, filtered and administered to MM cells with polybrene (8 μg/ml; Sigma-Aldrich AL-118) for 16 h. Transduced cells were selected for 1 wk with 2 μg/ml puromycin (Sigma-Aldrich, P9620).
To assess shRNA toxicity, the gene encoding puromycin resistance was replaced with GFP. The GFP-positive proportion of viable cells for each shRNA was determined 3 d after infection and then monitored by Accuri C6 Flow Cytometer (BD Biosciences, San Jose CA) upon staining with APC-conjugated ANXA5 (BD PharmMingen, 550474) and propidium iodide, and normalized to initial values and nonspecific toxicity.
shRNA sequences. shATG7(1): CCGGGCCTGCTGAGGAGCTCTCCATCTCGAGATGGAGAGCTCCTCAGCAGGCTTTTT; shATG7(2): CCGGCCCAGCTATTGGAACACTGTACTCGAGTACAGTGTTCCAATAGCTGGGTTTTT; shSQSTM1 (1): CCGGCGAGGAATTGACAATGGCCATCTCGAGATGGCCATTGTCAATTCCTCGTTTTT; shSQSTM1 (2): CCGGCCGAATCTACATTAAAGAGAACTCGAGTTCTCTTTAATGTAGATTCGGTTTTT.
Colony-forming assay
Cells were resuspended in RPMI complete medium with 0.4% 2-hydroxyethylagarose (Sigma-Aldrich, A9414) at a concentration of 5,000 cells/well and plated over a 0.8% agar layer in a 6-well plate. The experiment was performed in duplicate and plates were incubated at 37°C in a humidified incubator for 21 d. Upon staining with thiazolyl blue tetrazolium bromide (Sigma-Aldrich, M2128) diluted 1:10 in 1X phosphate-buffered saline (PBS; Euroclone, ECB4004L) for 4 h, colonies containing at least 20 cells as assessed by light microscopy were counted.
Immunoblot analyses
Total cellular extracts were obtained by lysis in 150 mM NaCl, 10 mM Tris-HCl (pH 7.5), 1% SDS (Sigma-Aldrich, 05030) for 15 min on ice. Genomic DNA was sheared by 30 min sonication.
To obtain soluble fractions, cells were collected and lysed in 150 mM NaCl, 10 mM Tris-HCl (pH 7.5) and 1% Nonidet NP-40 substitute (Sigma-Aldrich, IGEPAL CA-630, I8896), supplemented with protease inhibitors (30 μg; Roche, 05056489001), for 15 min on ice. Insoluble material was pelleted by centrifugation at 16,000 g for 15 min at 4°C and resuspended in 150 mM NaCl, 10 mM Tris-HCl (pH 7.5), 2% SDS (Sigma-Aldrich, 05030). After lysis, proteins were quantified by BCA assay. Proteins (30 μg) were resolved by 8%, 10%, 12% or 15% SDS-PAGE and blotted on nitrocellulose membrane (Bio-Rad, 162–0115). Membranes were blocked in 5% milk in PBS, 0.1% Tween-20 (Sigma-Aldrich, 274348), incubated with primary and secondary antibodies, thoroughly washed with PBS, 0.1% Tween-20, and proteins revealed by ECL using a ChemiDoc-it (UVP) for HRP-conjugated secondary Ab or at FLA9000 (FujiFilm, Tokyo Japan) for Alexa Fluor conjugated secondary antibodies (Life Technologies, A-21235, A-21036, A-21244, A-21450). Band densitometric analysis was performed with ImageJ free software (http://rsbweb.nih.gov/ij/). The following Abs were used: guinea pig anti-SQSTM1 C-terminal polyclonal Ab (1:1000 dilution; ProGen, GP62-C); rabbit anti-SQSTM1 (1:1000; Sigma-Aldrich, P0067); rabbit anti-MAP1LC3 polyclonal Ab (1:500; Novus Biologicals, NB100–220); rabbit anti-ATG7 (1:1000; Sigma-Aldrich, A2856); anti-ACTB/β actin (1:2000; Sigma-Aldrich, A5441); mouse anti-TUBA4A/α tubulin (1:5000; Sigma-Aldrich, T6074); rabbit anti-P4HB (1:1000, polyclonal antibody; kind gift of Ineke Braakman, Utrecht, NL); goat anti-KEAP1 (1:200; Santa Cruz Biotechnologies, sc-15246); mouse anti-ERP44 (1:1000; monoclonal Ab (36C9), kind gift of Roberto Sitia, Milano, Italy); rabbit anti-PRDX4 (1:1000; AbFrontier, PA0009); mouse anti-Ub monoclonal Ab (P4D1; 1:500; Santa Cruz Biotechnology, sc-8017).
SQSTM1 immunoprecipitation
Cells were collected and lysed in 150 mM NaCl, 10 mM Tris-HCl (pH 7.5), 1% Nonidet NP-40 substitute, supplemented with protease inhibitors, incubated for 15 min on ice; the nuclei were then pelleted at 1000 g for 15 min. Soluble material was quantified and 10 mg protein lysate incubated for 2 pre-clearing cycles with 30 µl protein A Sepharose fast flow beads (GE Healthcare, 17–0618–01) for 3 h. Pre-cleared lysate was incubated for 16 h with 30 µg beads preconjugated with 5 µg rabbit anti-SQSTM1 antiserum (Sigma-Aldrich, PA0067) or control serum. Beads were washed 4 times in 150 mM NaCl, 10 mM Tris-HCl (pH 7.5), 0.1% Nonidet NP-40 substitute, and resuspended in Laemmli buffer for SDS-PAGE resolution.
Immunofluorescence
MM cells were seeded on poly-l-lysine-coated slides, fixed with 4% paraformaldehyde, and permeabilized with PBS 0.1% Triton X-100. Cells were stained with guinea pig SQSTM1 antisera (1:200), C-terminal (Progen, GP62-C), rinsed in PBS, and stained with Alexa Fluor 488 goat anti-guinea pig IgG (1:500: Life Technologies, A11073) and Hoechst 33,342 (Life Technologies, H3570). Images were acquired with Deltavision (Applied Precision, Issaquah, WA) with an Olympus 60× objective with a numerical aperture of 1.42. For every sample several stacks were acquired on the z-axis. Images were deconvoluted using SoftWorks 3.5.0 (Applied Precision) and processed with ImageJ. More than 80 cells per sample were counted and analyzed.
Intracellular ATP quantification
ATP was quantified with the luminescent CellTiter-Glo assay per the manufacturer's instructions (Promega, G7570), as described.20 Briefly, for each condition 10,000 living cells were plated in quadruplicate on white 96-well multiwell plates and were analyzed with a Victor plate reader (Perkin-Elmer, Waltham MA).
Proteasome activity assays
Proteasome activity was determined using fluorogenic peptides, as previously described.5,6 Briefly, cells were sonicated in ice-cold buffer (50 mM Tris-HCl [pH 7.5], 1 mM DTT, 0.25 M sucrose, 5 mM MgCl2, 0.5 mM EDTA, 2 mM ATP), and extracts were prepared by centrifugation (30 min 10,000 g, and 15 min 100,000 g). Proteasome-specific chymotryptic peptidase activity was assayed by monitoring the production of 7-amino-4-methylcoumarin (amc) from 100 µM Suc-LLVY-amc (Bachem, I-1395) in 20 mM Tris-HCl (pH 7.5), 1 mM ATP, 2 mM MgCl2, 0.2% bovine serum albumin. Reactions were started by adding an aliquot of cell extract, and the fluorescence of released amc (excitation, 380 nm; emission, 460 nm) was monitored continuously at 37°C with a Carry Eclipse spectrofluorometer (Varian, Palo Alto, CA). Background activity (due to nonproteasomal degradation) was determined by addition of 10 µM MG132 (Sigma-Aldrich C2211). Assays were calibrated using standard free fluorophore solutions, and reaction velocities calculated from the slopes of the initial linear curve portions. Substrate consumption at the end of incubation never exceeded 1%.
Electron microscopy
Cells were pelleted and processed as described.20 Ultrathin sections were observed with a Zeiss Leo 912AB electron microscope (Zeiss, Oberkochen Germany) operating at 80 kV. Digital micrographs were captured with a 2kx2k Proscan slow-scan charge-coupled device camera system (Proscan HSC2, Lagerlechfeld Germany) controlled by the integrated Soft Imaging software (Soft Imaging Software). ER was measured by stereography with a fixed grid in ImageJ.
qRT-PCR
For RT-PCR, RNA was extracted from 1 × 10⁶ cells with Trizol (Invitrogen, 10296028), 1000 ng RNA retrotranscribed with ImProm-II Reverse Transcriptase (Promega, A3800), and cDNA corresponding to 2–5 ng of original RNA used as template in qPCR reactions.
qPCR were performed in 10 μL mix with 5 μl SYBR green I master mix (Roche, 04707516001) on Roche LightCycler 480 and 1 μl 5 μM primers. Data were analyzed on Roche LC480 software with Advance Relative Quantification. Human H3 expression was used as normalizer in the analyses. Primers used were: hATG7 FW: AGACAGAGGGCAGGATAGCA; hATG7 RV: TGGAACAAGCAGCAAATGAG; hHSPA5 FW: TAGCGTATGGTGCTGCTGTC; hHSPA5 RV: TGACACCTCCCACAGTTTCA; hP4HBFW: TCACATCCTGCTGTTCTTGC; hP4HB RV: GTCGCTGTCGATGAAGATGA; hSQSTM1 FW: GGGGCGCCCTGAGGAACAGA; hSQSTM1 RV: CCTGGTGAGCCAGCCGCCTT; hXBP1s FW: CCGCAGCAGGTGCAGG; hXBP1s RV: GAGTCAATACCGCCAGAATCCA; hXBP1 total FW: GCAAGCGACAGCGCCT; hXBP1 total RV: TTTTCAGTTTCCTCCTCAGCG; hH3 FW: GTGAAGAAACCTCATCGTTACAGGCCTGGT; hH3 RV: CTGCAAAGCACCAATAGCTGCACTCTGGAA; hNBR1 FW: GCGAGCTGAGAAGAAACAACG; hNBR1 RV: GAAGGTGAGTCCCATCAGGC; hOPTN FW: TTCGGCCTGGACAGAGAAAC; hOPTN RV: TGCCTTCTCTGCTTGTAGCC.
SILAC mass-spectrometry
MM lines were grown in complete SILAC RPMI medium (Thermo Scientific, 89984) supplemented with “light” (Lys0, Arg0), “heavy” (Lys8, Arg10) or “intermediate” (Lys4, Arg6) SILAC amino acids (arginine, Sigma-Aldrich, 643440, 608033; lysine, Cambridge Isotope Laboratories, DLM-2640, CNLM-291) for 14 d, with 95% mean labeling efficiency. Lysates were loaded in SDS-PAGE, trypsin-digested, and analyzed using a LTQ-Orbitrap mass spectrometer (Thermo Fisher Scientific, Waltham MA). For SILAC analyses of leupeptin effects, OPM2 cells were treated for 24 h with 20 µM leupeptin. Treated and untreated cells differentially labeled were mixed 1:1 and lysed in 150 mM NaCl, 10 mM Tris-HCl (pH 7.5), 1% SDS for 15 min on ice. Samples were loaded on a 10% SDS-PAGE gel and stained with colloidal Coomassie brilliant blue. Gel slices were excised from the gel sampling the entire length of the lanes from the direct and reverse experiments (12 slices each). For MM.1S and OPM2 comparative analysis, differentially labeled cells were mixed 1:1 and a cellular fractionation was performed using the Qproteome Cell Compartment Kit (Qiagen, 37502). Cytosolic, membrane and nuclear fractions were loaded on a 10% SDS-PAGE gel and 10 gel slices were excised from each lane from the direct and reverse experiments. For SQSTM1 dynamic interactome SILAC, MM.1S cells were labeled with “light,” “intermediate,” and “heavy” amino acids and IP performed as described in Figure S2. Immunoprecipitates were mixed 1:1:1 and loaded on a 10% SDS-PAGE gel and 10 gel slices were excised and analyzed by LC-MS/MS. After reduction with 10 mM DTT (Sigma-Aldrich, D9779), alkylation with 55 mM iodoacetamide (Sigma-Aldrich, I1149) and overnight tryptic digestion, digests were desalted and concentrated on C18 Stage Tips (Proxeon Biosystems, SP301) and then separated on a NanoLC (EasyLC, Proxeon Biosystems, Odense Denmark). Peptide separation occurred on a RP homemade 15-cm reverse phase (RP) spraying fused silica capillary column (75 μm i.d.), packed inhouse with 3-μm ReproSil-Pur 120 C18-AQ (Dr. Maisch GmbH, Germany). A gradient of eluents A (H2O with 2% v/v ACN, 0.5% v/v acetic acid) and B (80%ACN with 0.5% v/v acetic acid) was used to achieve separation, from 7% B (at 0 min 0.2 μL/min flow rate) to 40% B (in 70 min, 0.2 μL/min flow rate). The LC system was connected to an LTQ-Orbitrap mass spectrometer (Thermo Fisher Scientific, Waltham MA) equipped with a nanoelectrospray ion source (Proxeon Biosystems, Odense, Denmark). MS and MS/MS spectra were acquired selecting the 10 most intense ions per survey spectrum acquired in the orbitrap from m/z 300–1750 with 30.000 resolution. Target ions selected for the MS/MS were fragmented in the ion trap and dynamically excluded for 60s. For accurate mass measurements, the lock-mass option was employed. Technical replicates were conducted on the LC-MS/MS part of the analysis. Raw data were processed with MaxQuant (version 1.2.2.5) and peptides identified from MS/MS spectra against the Human Uniprot Complete Proteome Set database (ver. 2012_05) using the Andromeda search engine. Cysteine carbamidomethylation was used as fixed modification, methionine oxidation and protein N-terminal acetylation as variable modifications. Mass deviation for MS/MS peaks was set at 0.5 m/z units with a maximum of 2 missed cleavages allowed. The peptides and protein false discovery rates were set to 0.01; the minimal length required for a peptide was 6 amino acids; minimum 2 peptides and at least one unique peptide were required for high-confidence protein identification; for quantitative analysis options Re-quantify and second peptide were selected. The lists of identified proteins were filtered to eliminate reverse hits and known contaminants.
Statistical and data analyses
For mass spectrometry, the Perseus software (v.1.1.1.21) was used. Identification of significant protein changes required: i) significance B at P < 0.05; ii) ratio normalized values concordant in both direct and reverse experiments; iii) ≥2 ratio counts. Proteins consistently upregulated were run through functional annotation clustering on DAVID web resource, as described.20,51 For general analyses of graphs and data, the Prism software, version 4.0 (GraphPad) was used. Statistical significance was tested with a 2-tailed Student t test (α = 0.05). Figures were assembled with Adobe Illustrator.
Disclosure of Potential Conflicts of Interest
No potential conflicts of interest were disclosed.
Acknowledgements
We thank Federica Loro for patient assistance, and all the Cenci lab members for creative discussions. We are particularly grateful to: Annapaola Andolfo, Holger W. Auner, Elisa Benatti, Stefano Casola, Angela Cattaneo, Floriana Cremasco, Paolo Dellabona, Monica Fabbri, Francesca Fontana, Luigi Gennari, Fernando Gianfrancesco, Luigi Maiuri, Giampaolo Merlini, Daniela Merlotti, Andrea Orsi, Niccolò Pengo, Maurilio Ponzoni, Fulvio Reggiori, Umberto Restuccia, Carmine Settembre, Roberto Sitia, and Giovanni Tonon.
Funding
The work was supported by grants to S.C. from the Multiple Myeloma Research Foundation (Senior Research Award 2010), the Italian Ministry of Health (Giovani Ricercatori 1143560) and the Italian Association for Cancer Research (AIRC, Investigator Grant 14691 and Special Program Molecular Clinical Oncology 5 per mille n. 9965).
Supplemental Material
Supplemental data for this article can be accessed on the publisher's website.
References
- 1.Goldberg AL. Development of proteasome inhibitors as research tools and cancer drugs. J. Cell Biol. 2012; 199:583-8; PMID:23148232; http://dx.doi.org/ 10.1083/jcb.201210077 [DOI] [PMC free article] [PubMed] [Google Scholar]
- 2.Hideshima T, Anderson KC. Biologic impact of proteasome inhibition in multiple myeloma cells-from the aspects of preclinical studies. Semin. Hematol. 2012; 49: 223-27; PMID:22726545; http://dx.doi.org/ 10.1053/j.seminhematol.2012.04.006 [DOI] [PMC free article] [PubMed] [Google Scholar]
- 3.Shah JJ, Orlowski RZ. Proteasome inhibitors in the treatment of multiple myeloma. Leukemia 2009; 23:1964-79;PMID:19741722; http://dx.doi.org/ 10.1038/leu.2009.173 [DOI] [PMC free article] [PubMed] [Google Scholar]
- 4.Cenci S, Mezghrani A, Cascio P, Bianchi G, Cerruti F, Fra A, Lelouard H, Masciarelli S, Mattioli L, Oliva L. et al. Progressively impaired proteasomal capacity during terminal plasma cell differentiation. EMBO J. 2006; 25:1104-13; PMID:16498407; http://dx.doi.org/ 10.1038/sj.emboj.7601009 [DOI] [PMC free article] [PubMed] [Google Scholar]
- 5.Bianchi G, Oliva L, Cascio P, Pengo N, Fontana F, Cerruti F, Orsi A, Pasqualetto E, Mezghrani A, Calbi V, et al.. The proteasome load versus capacity balance determines apoptotic sensitivity of multiple myeloma cells to proteasome inhibition. Blood 2009; 113:3040-49; PMID:19164601; http://dx.doi.org/ 10.1182/blood-2008-08-172734 [DOI] [PubMed] [Google Scholar]
- 6.Cenci S, Oliva L, Cerruti F, Milan E, Bianchi G, Raule M, Mezghrani A, Pasqualetto E, Sitia R, Cascio P. Pivotal Advance: Protein synthesis modulates responsiveness of differentiating and malignant plasma cells to proteasome inhibitors. J Leukoc Biol. 2012; 92:921-31; PMID:22685320; http://dx.doi.org/ 10.1189/jlb.1011497 [DOI] [PubMed] [Google Scholar]
- 7.Richardson PG, Barlogie B, Berenson J, Singhal S, Jagannath S, Irwin DH, Rajkumar SV, Srkalovic G, Alsina M, Anderson KC. Extended follow-up of a phase II trial in relapsed, refractory multiple myeloma: final time-to-event results from the SUMMIT trial. Cancer 2006; 106:1316-19; PMID:16470606; http://dx.doi.org/ 10.1002/cncr.21740 [DOI] [PubMed] [Google Scholar]
- 8.Richardson PG, Sonneveld P, Schuster M, Irwin D, Stadtmauer E, Facon T, Harousseau JL, Ben-Yehuda D, Lonial S, Goldschmidt H, et al.. Extended follow-up of a phase 3 trial in relapsed multiple myeloma: final time-to-event results of the APEX trial. Blood 2007; 110:3557-60; PMID:17690257; http://dx.doi.org/ 10.1182/blood-2006-08-036947 [DOI] [PubMed] [Google Scholar]
- 9.Vij R, Wang M, Kaufman JL, Lonial S, Jakubowiak AJ, Stewart AK, Kukreti V, Jagannath S, McDonagh KT, Alsina M, et al.. An open-label, single-arm, phase 2 (PX-171-004) study of single-agent carfilzomib in bortezomib-naive patients with relapsed and/or refractory multiple myeloma. Blood 2012; 119:5661-70; PMID:22555973; http://dx.doi.org/ 10.1182/blood-2012-03-414359 [DOI] [PMC free article] [PubMed] [Google Scholar]
- 10.Hideshima T, Richardson PG, Anderson KC. Mechanism of action of proteasome inhibitors and deacetylase inhibitors and the biological basis of synergy in multiple myeloma. Mol. Cancer Ther. 2011; 10:2034-42; PMID:22072815; http://dx.doi.org/ 10.1158/1535-7163.MCT-11-0433 [DOI] [PMC free article] [PubMed] [Google Scholar]
- 11.Aronson LI, Davies FE. DangER: protein ovERload. Targeting protein degradation to treat myeloma. Haematologica 2012; 97:1119-30; PMID:22580998; http://dx.doi.org/ 10.3324/haematol.2012.064923 [DOI] [PMC free article] [PubMed] [Google Scholar]
- 12.Cenci S. The proteasome in terminal plasma cell differentiation. Semin Hematol. 2012; 49:215-22; PMID:22726544; http://dx.doi.org/ 10.1053/j.seminhematol.2012.04.005 [DOI] [PubMed] [Google Scholar]
- 13.Lum JJ, DeBerardinis RJ, Thompson CB. Autophagy in metazoans: cell survival in the land of plenty. Nat. Rev. Mol. Cell Biol. 2005; 6:439-48; PMID:15928708; http://dx.doi.org/ 10.1038/nrm1660 [DOI] [PubMed] [Google Scholar]
- 14.He C, Klionsky DJ. Regulation mechanisms and signaling pathways of autophagy. Annu. Rev. Genet. 2009; 43: 67-93; PMID:19653858; http://dx.doi.org/ 10.1146/annurev-genet-102808-114910 [DOI] [PMC free article] [PubMed] [Google Scholar]
- 15.Mizushima N, Komatsu M. Autophagy: renovation of cells and tissues. Cell 2011; 147:728-41; PMID:22078875; http://dx.doi.org/ 10.1016/j.cell.2011.10.026 [DOI] [PubMed] [Google Scholar]
- 16.Kroemer G, Marino G, Levine B. Autophagy and the integrated stress response. Mol. Cell 2010; 40:280-93; PMID:20965422; http://dx.doi.org/ 10.1016/j.molcel.2010.09.023 [DOI] [PMC free article] [PubMed] [Google Scholar]
- 17.Johansen T, Lamark T. Selective autophagy mediated by autophagic adapter proteins. Autophagy 2011; 7:279-96; PMID:21189453; http://dx.doi.org/ 10.4161/auto.7.3.14487 [DOI] [PMC free article] [PubMed] [Google Scholar]
- 18.McLeod IX, Jia W, He YW. The contribution of autophagy to lymphocyte survival and homeostasis. Immunol Rev. 2012; 2:195-204; http://dx.doi.org/ 10.1111/j.1600-065X.2012.01143.x [DOI] [PMC free article] [PubMed] [Google Scholar]
- 19.Deretic V, Saitoh T, Akira S. Autophagy in infection, inflammation and immunity. Nat Rev Immunol. 2013; 13:722-37; PMID:24064518; http://dx.doi.org/ 10.1038/nri3532 [DOI] [PMC free article] [PubMed] [Google Scholar]
- 20.Pengo N, Scolari M, Oliva L, Milan E, Mainoldi F, Raimondi A, Fagioli C, Merlini A, Mariani E, Pasqualetto E, et al.. Plasma cells require autophagy for sustainable immunoglobulin production. Nat. Immunol. 2013; 14:298-305; PMID:23354484; http://dx.doi.org/ 10.1038/ni.2524 [DOI] [PubMed] [Google Scholar]
- 21.Conway KL, Kuballa P, Khor B, Zhang M, Shi HN, Virgin HW, Xavier RJ. ATG5 regulates plasma cell differentiation. Autophagy 2013; 9:528-37; PMID:23327930; http://dx.doi.org/ 10.4161/auto.23484 [DOI] [PMC free article] [PubMed] [Google Scholar]
- 22.White E. Deconvoluting the context-dependent role for autophagy in cancer. Nat. Rev. Cancer 2012; 12:401-10; PMID:22534666; http://dx.doi.org/ 10.1038/nrc3262 [DOI] [PMC free article] [PubMed] [Google Scholar]
- 23.Pandey UB, Nie Z, Batlevi Y, McCray BA, Ritson GP, Nedelsky NB, Schwartz SL, DiProspero NA, Knight MA, Schuldiner O, et al.. HDAC6 rescues neurodegeneration and provides an essential link between autophagy and the UPS. Nature 2007; 447:859-63; PMID:17568747; http://dx.doi.org/ 10.1038/nature05853 [DOI] [PubMed] [Google Scholar]
- 24.Choi AM, Ryter SW, Levine B. Autophagy in human health and disease. N. Engl. J. Med. 2013; 368:651-62; PMID:23406030; http://dx.doi.org/ 10.1056/NEJMra1205406 [DOI] [PubMed] [Google Scholar]
- 25.Hoang B, Benavides A, Shi Y, Frost P, Lichtenstein A. Effect of autophagy on multiple myeloma cell viability. Mol. Cancer Ther. 2009; 8:1974-84; PMID:19509276; http://dx.doi.org/ 10.1158/1535-7163.MCT-08-1177 [DOI] [PubMed] [Google Scholar]
- 26.Lamy L, Ngo VN, Emre NCT, Shaffer AL 3rd, Yang Y, Tian E, Nair V, Kruhlak MJ, Zingone A, Landgren O, et al.. Control of autophagic cell death by caspase-10 in multiple myeloma. Cancer Cell 2013; 23:435-49; PMID:23541952; http://dx.doi.org/ 10.1016/j.ccr.2013.02.017 [DOI] [PMC free article] [PubMed] [Google Scholar]
- 27.Levine B, Kroemer G. Autophagy in the pathogenesis of disease. Cell 2008; 132:27-42; PMID:18191218; http://dx.doi.org/ 10.1016/j.cell.2007.12.018 [DOI] [PMC free article] [PubMed] [Google Scholar]
- 28.Mathew R, Kongara S, Beaudoin B, Karp CM, Bray K, Degenhardt K, Chen G, Jin S, White E. Autophagy suppresses tumor progression by limiting chromosomal instability. Genes Dev. 2007; 21:1367-81; PMID:17510285; http://dx.doi.org/ 10.1101/gad.1545107 [DOI] [PMC free article] [PubMed] [Google Scholar]
- 29.Degenhardt K, Mathew R, Beaudoin B, Bray K, Anderson D, Chen G, Mukherjee C, Shi Y, Gélinas C, Fan Y, et al.. Autophagy promotes tumor cell survival and restricts necrosis, inflammation, and tumorigenesis. Cancer Cell 2006; 10:51-64; PMID:16843265; http://dx.doi.org/ 10.1016/j.ccr.2006.06.001 [DOI] [PMC free article] [PubMed] [Google Scholar]
- 30.Maiuri MC, Tasdemir E, Criollo A, Morselli E, Vicencio JM, Carnuccio R, Kroemer G. Control of autophagy by oncogenes and tumor suppressor genes. Cell Death Differ. 2009; 16:87-93; PMID:18806760; http://dx.doi.org/ 10.1038/cdd.2008.131 [DOI] [PubMed] [Google Scholar]
- 31.Karantza-Wadsworth V, Patel S, Kravchuk O, Chen G, Mathew R, Jin S, White E. Autophagy mitigates metabolic stress and genome damage in mammary tumorigenesis. Genes Dev. 2007; 21:1621-35; PMID:17606641; http://dx.doi.org/ 10.1101/gad.1565707 [DOI] [PMC free article] [PubMed] [Google Scholar]
- 32.Dang CV, Kim JW, Gao P, Yustein J. The interplay between MYC and HIF in cancer. Nat. Rev. Cancer. 2008; 8:51-6; PMID:18046334; http://dx.doi.org/ 10.1038/nrc2274 [DOI] [PubMed] [Google Scholar]
- 33.Ma Y, Hendershot LM. The role of the unfolded protein response in tumour development: friend or foe? Nat. Rev. Cancer 2004; 4:966-77; PMID:15573118; http://dx.doi.org/ 10.1038/nrc1505 [DOI] [PubMed] [Google Scholar]
- 34.Meister S, Schubert U, Neubert K, Herrmann K, Burger R, Gramatzki M, Hahn S, Schreiber S, Wilhelm S, Herrmann M, et al.. Extensive immunoglobulin production sensitizes myeloma cells for proteasome inhibition. Cancer Res. 2007; 67:1783-92; PMID:17308121; http://dx.doi.org/ 10.1158/0008-5472.CAN-06-2258 [DOI] [PubMed] [Google Scholar]
- 35.Cascio P, Oliva L, Cerruti F, Mariani E, Pasqualetto E, Cenci S, Sitia R. Dampening Ab responses using proteasome inhibitors following in vivo B cell activation. Eur. J. Immunol. 2008; 38:658-67; PMID:18253932; http://dx.doi.org/ 10.1002/eji.200737743 [DOI] [PubMed] [Google Scholar]
- 36.Neubert K, Meister S, Moser K, Weisel F, Maseda D, Amann K, Wiethe C, Winkler TH, Kalden JR, Manz RA, et al.. The proteasome inhibitor bortezomib depletes plasma cells and protects mice with lupus-like disease from nephritis. Nat. Med. 2008; 14:748-55; PMID:18542049; http://dx.doi.org/ 10.1038/nm1763 [DOI] [PubMed] [Google Scholar]
- 37.Hideshima T, Bradner JE, Wong J, Chauhan D, Richardson P, Schreiber SL, Anderson KC. Small-molecule inhibition of proteasome and aggresome function induces synergistic antitumor activity in multiple myeloma. Proc. Natl. Acad. Sci. U S A. 2005; 102:8567-72; PMID:15937109; http://dx.doi.org/ 10.1073/pnas.0503221102 [DOI] [PMC free article] [PubMed] [Google Scholar]
- 38.Kawaguchi T, Miyazawa K, Moriya S, Ohtomo T, Che XF, Naito M, Itoh M, Tomoda A. Combined treatment with bortezomib plus bafilomycin A1 enhances the cytocidal effect and induces endoplasmic reticulum stress in U266 myeloma cells: crosstalk among proteasome, autophagy–lysosome and ER stress. Int. J. Oncol. 2011; 38:643-54; PMID:21174067 [DOI] [PubMed] [Google Scholar]
- 39.Santo L, Hideshima T, Kung AL, Tseng JC, Tamang D, Yang M, Jarpe M, van Duzer JH, Mazitschek R, Ogier WC, et al.. Preclinical activity, pharmacodynamic, and pharmacokinetic properties of a selective HDAC6 inhibitor, ACY-1215, in combination with bortezomib in multiple myeloma. Blood 2012; 119:2579-89; PMID:22262760; http://dx.doi.org/ 10.1182/blood-2011-10-387365 [DOI] [PMC free article] [PubMed] [Google Scholar]
- 40.Vogl DT, Stadtmauer EA, Tan KS, Heitjan DF, Davis LE, Pontiggia L, Rangwala R, Piao S, Chang YC, Scott EC, et al.. Combined autophagy and proteasome inhibition: a phase 1 trial of hydroxychloroquine and bortezomib in patients with relapsed/refractory myeloma. Autophagy 2014; 10: 1380-90; PMID:24991834; http://dx.doi.org/ 10.4161/auto.29264 [DOI] [PMC free article] [PubMed] [Google Scholar]
- 41.Boya P, Reggiori F, Codogno P. Emerging regulation and functions of autophagy. Nat. Cell Biol. 2013; 15:713-20; PMID:23817233; http://dx.doi.org/ 10.1038/ncb2788 [DOI] [PMC free article] [PubMed] [Google Scholar]
- 42.Moscat J, Diaz-Meco MT. p62 at the crossroads of autophagy, apoptosis, and cancer. Cell 2009; 137:1001-4; PMID:19524504; http://dx.doi.org/ 10.1016/j.cell.2009.05.023 [DOI] [PMC free article] [PubMed] [Google Scholar]
- 43.Komatsu M, Ichimura Y. Physiological significance of selective degradation of p62 by autophagy. FEBS Lett. 2010; 584:1374-8; PMID:20153326; http://dx.doi.org/ 10.1016/j.febslet.2010.02.017 [DOI] [PubMed] [Google Scholar]
- 44.Korolchuk VI, Menzies FM, Rubinsztein DC. Mechanisms of cross-talk between the ubiquitin-proteasome and autophagy-lysosome systems. FEBS Lett. 2010; 584:1393-8; PMID:20040365; http://dx.doi.org/ 10.1016/j.febslet.2009.12.047 [DOI] [PubMed] [Google Scholar]
- 45.Rodriguez A, Durán A, Selloum M, Champy MF, Diez-Guerra FJ, Flores JM, Serrano M, Auwerx J, Diaz-Meco MT, Moscat J. Mature-onset obesity and insulin resistance in mice deficient in the signaling adapter p62. Cell Metab. 2006; 3:211-22; PMID:16517408; http://dx.doi.org/ 10.1016/j.cmet.2006.01.011 [DOI] [PubMed] [Google Scholar]
- 46.Ralston SH, Langston AL, Reid IR. Pathogenesis and management of Paget's disease of bone. Lancet 2008; 372:155-63; PMID:18620951; http://dx.doi.org/ 10.1016/S0140-6736(08)61035-1 [DOI] [PubMed] [Google Scholar]
- 47.Korolchuk VI, Mansilla A, Menzies FM, Rubinsztein DC. Autophagy inhibition compromises degradation of ubiquitin-proteasome pathway substrates. Mol Cell 2009; 33:517-27; PMID:19250912; http://dx.doi.org/ 10.1016/j.molcel.2009.01.021 [DOI] [PMC free article] [PubMed] [Google Scholar]
- 48.Komatsu M, Waguri S, Koike M, Sou YS, Ueno T, Hara T, Mizushima N, Iwata J, Ezaki J, Murata S, et al.. Homeostatic levels of p62 control cytoplasmic inclusion body formation in autophagy-deficient mice. Cell 2007; 131:1149-63; PMID:18083104; http://dx.doi.org/ 10.1016/j.cell.2007.10.035 [DOI] [PubMed] [Google Scholar]
- 49.Riley BE, Kaiser SE, Shaler TA, Ng AC, Hara T, Hipp MS, Lage K, Xavier RJ, Ryu KY, Taguchi K, et al.. Ubiquitin accumulation in autophagy-deficient mice is dependent on the Nrf2-mediated stress response pathway: a potential role for protein aggregation in autophagic substrate selection. J. Cell Biol. 2010; 191:537-52; PMID:21041446; http://dx.doi.org/ 10.1083/jcb.201005012 [DOI] [PMC free article] [PubMed] [Google Scholar]
- 50.Chen S, Zhou L, Zhang Y, Leng Y, Pei XY, Lin H, Jones R, Orlowski RZ, Dai Y, Grant S. Targeting SQSTM1/p62 Induces Cargo-Loading Failure and Converts Autophagy to Apoptosis via NBK/Bik. Mol Cell Biol. 2014; 34:3435-49; PMID:25002530; http://dx.doi.org/ 10.1128/MCB.01383-13 [DOI] [PMC free article] [PubMed] [Google Scholar]
- 51.Huang da W, Sherman BT, Lempicki RA. Systematic and integrative analysis of large gene lists using DAVID bioinformatics resources. Nat. Protoc. 2009; 4:44-57; PMID:19131956; http://dx.doi.org/ 10.1038/nprot.2008.211 [DOI] [PubMed] [Google Scholar]
Associated Data
This section collects any data citations, data availability statements, or supplementary materials included in this article.