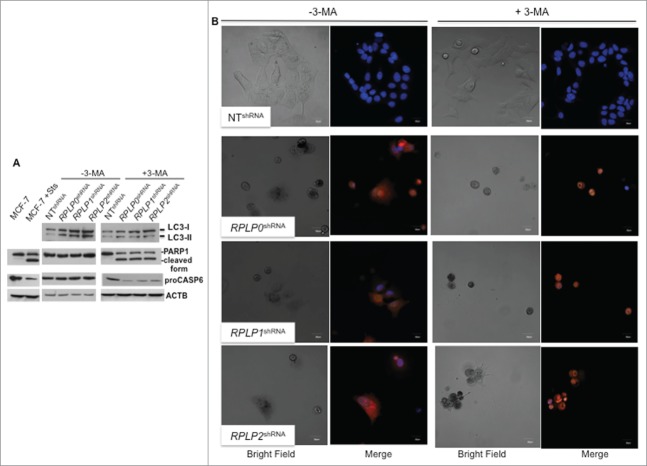
Figure 4.
Inhibition of autophagy in cells with downregulated RPLP protein expression induces apoptosis. (A) Representative immunoblot of LC3, PARP1 cleavage, and proCASP6 in MCF-7 cells expressing RPLP0 shRNA, RPLP1 shRNA, RPLP2 shRNA, or NT shRNA vector, in the absence (DMSO) or presence of 10 mM 3-MA for 48 h. ACTB was used as a loading control. Note the presence of PARP1 cleavage and the decrease in proCASP6 in MCF-7 cells treated with Sts and also in MCF-7 cells expressing RPLP0 shRNA, RPLP1 shRNA, and RPLP2 shRNA compared with control cells (NT shRNA) following treatment with 3-MA (as in A), indicative of apoptosis. (B) Acridine orange staining counterstained with Hoechst in MCF-7 cells expressing RPLP0 shRNA, RPLP1 shRNA, RPLP2 shRNA, or NT shRNA vector, in the absence or presence of 10 mM 3-MA (as in A). Representative confocal microscopy images of control (DMSO) RPLP protein-deficient cells with punctate staining of autophagosomes (left part). The acridine orange cytoplasmic pattern is blocked by the autophagy inhibitor 3-MA (on the right), resulting in acridine orange-positive nuclear staining and morphological changes that are characteristic of apoptosis. Scale bar: 20 μm.

