Abstract
Little is known about the association between autophagy and diabetic cardiomyopathy. Also unknown are possible distinguishing features of cardiac autophagy in type 1 and type 2 diabetes. In hearts from streptozotocin-induced type 1 diabetic mice, diastolic function was impaired, though autophagic activity was significantly increased, as evidenced by increases in microtubule-associated protein 1 light chain 3/LC3 and LC3-II/-I ratios, SQSTM1/p62 (sequestosome 1) and CTSD (cathepsin D), and by the abundance of autophagic vacuoles and lysosomes detected electron-microscopically. AMP-activated protein kinase (AMPK) was activated and ATP content was reduced in type 1 diabetic hearts. Treatment with chloroquine, an autophagy inhibitor, worsened cardiac performance in type 1 diabetes. In addition, hearts from db/db type 2 diabetic model mice exhibited poorer diastolic function than control hearts from db/+ mice. However, levels of LC3-II, SQSTM1 and phosphorylated MTOR (mechanistic target of rapamycin) were increased, but CTSD was decreased and very few lysosomes were detected ultrastructurally, despite the abundance of autophagic vacuoles. AMPK activity was suppressed and ATP content was reduced in type 2 diabetic hearts. These findings suggest the autophagic process is suppressed at the final digestion step in type 2 diabetic hearts. Resveratrol, an autophagy enhancer, mitigated diastolic dysfunction, while chloroquine had the opposite effects in type 2 diabetic hearts. Autophagy in the heart is enhanced in type 1 diabetes, but is suppressed in type 2 diabetes. This difference provides important insight into the pathophysiology of diabetic cardiomyopathy, which is essential for the development of new treatment strategies.
Keywords: AMP-activated protein kinase, autophagy, cardiomyopathy, chloroquine, diabetes mellitus, insulin, resveratrol, type 1 diabetes, type 2 diabetes, ultrastructure
Abbreviations
- AMPK
AMP-activated protein kinase
- CTSD
cathepsin D
- DM
diabetes mellitus
- GFP
green fluorescent protein
- HBA1c
glycated hemoglobin α 1
- MAP1LC3/LC3
microtubule-associated protein 1 light chain 3
- LV
left ventricular
- MTOR
mechanistic target of rapamycin
- SIRT1
sirtuin 1
- Mn-SOD
superoxide dismutase 2, mitochondrial
- STZ
streptozotocin
- SQSTM1/p62
sequestosome 1
Introduction
Diabetes mellitus (DM) is strongly associated with increased morbidity and mortality from cardiovascular ailments such as coronary artery disease, stroke, peripheral arterial disease, cardiomyopathy, and congestive heart failure.1,2 Although the cardiovascular complications of DM are mainly associated with ischemic disease due to progressive atherosclerosis, many people suffer from DM-related cardiomyopathy, which develops in diabetic patients in the absence of coronary artery disease or hypertension, and is a major cause of heart failure in these patients.3,4 However, the precise pathogenesis of diabetic cardiomyopathy remains unclear.5 Etiological differences between type 1 and type 2 diabetes also complicate the pathogenesis of the respective associated cardiomyopathies.
Autophagy is a major protein degradation system that targets primarily long-lived cytoplasmic proteins, and is known to include 3 main forms: chaperone-mediated autophagy, microautophagy, and macroautophagy. Macroautophagy (hereafter referred to as autophagy) is a physiological self-degradation and recycling process that proceeds within double-membrane organelles via the lysosomal digestive pathway and functions to maintain the intracellular environment.6 Autophagy occurs not only in healthy hearts under basal conditions, but is also activated under pathological conditions, including heart failure,7,8 cardiac hypertrophy,9 ischemic cardiomyopathy,10 acute myocardial infarction,11 postinfarction remodeling,12,13 and cardiac senescence.14 This suggests that autophagy plays a key role in maintaining cardiac function but may also contribute to the pathogenesis of heart disease. Furthermore, one would expect autophagy to be centrally involved in diabetic cardiomyopathy, where apparent metabolic disorder and obvious impairment of contractile function coexist. We therefore hypothesize that distinctly different autophagic processes are ongoing in type 1 and type 2 diabetic cardiomyopathies. In the present study, we tested that hypothesis by examining type 1 and type 2 diabetic hearts using model animals. Our aims were to elucidate possible differences in the autophagic process between the 2 ailments and to then manipulate the autophagy pathway in an effort to develop a novel therapeutic strategy for utilizing autophagy against diabetic cardiomyopathy.
Results
Functional and structural profiles of hearts from diabetic mice
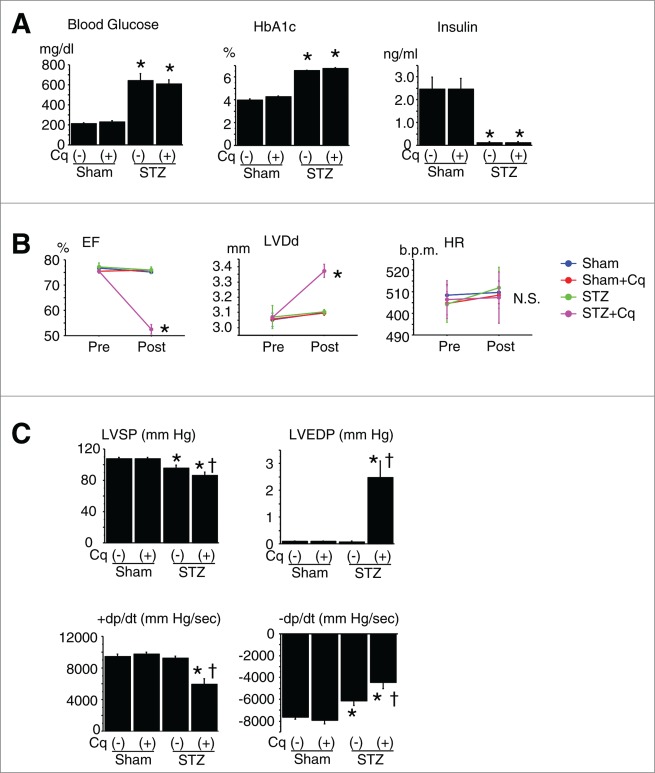
A type 1 DM model was generated in mice by treatment with streptozotocin (STZ). This treatment made mice lean and significantly increased plasma levels of casual glucose and glycated HBA1 (hemoglobin, α 1; HBA1c) and markedly suppressed insulin secretion, as compared to nondiabetic control mice (Fig. 1A). Echocardiography and cardiac catheterization revealed that diastolic cardiac function was significantly impaired in the diabetic mice, although systolic cardiac function and left ventricular (LV) diameter were similar to those in nondiabetic mice (Fig. 1B and C). Pathological examination revealed that heart weights were reduced in the diabetic mice, though cardiomyocyte size was unchanged, and cardiac fibrosis developed in parallel with the changes in cardiac diastolic function (Table 1).
Figure 1.
Diabetic profile and cardiac function of type 1 diabetic mice. (A) Diabetic profile in nondiabetic (Sham) and streptozotocin (STZ)-induced type 1 diabetic mice (n = 12 each). *P < 0.05 vs. nondiabetic control group. (B) Cardiac geometry and function assessed by echocardiography. Cq, chloroquine; pre- and post-treatment with Cq; EF, LV ejection fraction; LVDd, LV diastolic diameter; HR, heart rate. *P < 0.05 vs. pretreatment. (C) Cardiac function assessed by cardiac catheterization. LVSP, LV peak systolic pressure; LVEDP, LV end-diastolic pressure; +dP/dt and –dP/dt, maximal and minimal first derivative of LV pressure. *P < 0.05 vs. saline-treated sham; †P < 0.05 vs. saline-treated STZ.
Table 1.
Cardiac pathology and morphometry in GFP-LC3 mice
| Sham |
STZ |
|||
|---|---|---|---|---|
| Saline | Chloroquine | Saline | Chloroquine | |
| n = 12 | n = 12 | n = 12 | n = 12 | |
| Body weight, g | 25.3 ± 0.36 | 26.2 ± 0.34 | 19.6 ± 0.35* | 20.6 ± 0.51* |
| Heart weight, mg | 94.6 ± 2.7 | 96.7 ± 2.6 | 69.2 ± 1.5* | 83.3 ± 2.9*,† |
| Heart/Body ratio, mg/g | 3.74 ± 0.10 | 3.69 ± 0.10 | 3.54 ± 0.08 | 4.06 ± 0.13*,† |
| Myocyte size, μm | 12.1 ± 0.2 | 11.7 ± 0.2 | 11.7 ± 0.3 | 12.3 ± 0.4 |
| %Fibrosis | 1.69 ± 0.09 | 1.59 ± 0.05 | 2.91 ± 0.11* | 4.25 ± 0.26*,† |
P < 0.05 vs. the saline-treated sham group;
P < 0.05 vs. the saline-treated STZ group.
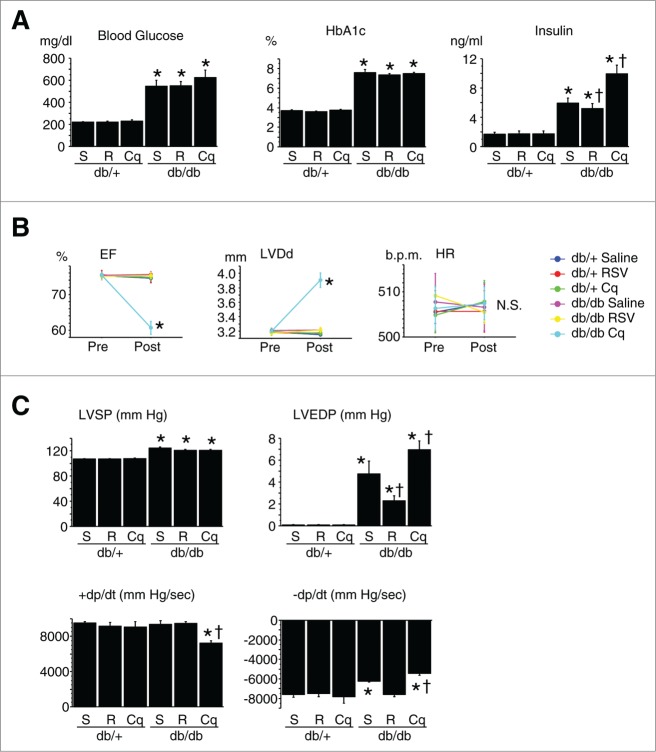
db/db type 2 DM model mice had significantly greater body and heart weights and plasma glucose, HBA1c, and insulin levels than nondiabetic db/+ mice (Fig. 2A). Echocardiography and catheterization revealed that although cardiac systolic function and LV diameter in db/db mice were similar to those in db/+ mice, diastolic function was impaired (Fig. 2B and C). LV systolic and end-diastolic pressures were significantly increased, and pathological examination revealed hypertrophied cardiomyocytes and increased myocardial fibrosis in db/db diabetic mice (Table 2).
Figure 2.
Diabetic profile and cardiac function of type 2 diabetic mice. (A) Diabetic profile of db/+ nondiabetic and db/db type 2 diabetic mice (n = 12 each). *P < 0.05 vs. the db/+ nondiabetic control group; †P < 0.05 vs. db/db diabetic group. (B) Cardiac geometry and function assessed by echocardiography. Cq, chloroquine; RSV, resveratrol; pre- and post-treatment with Cq or RSV; EF, LV ejection fraction; LVDd, LV diastolic diameter; HR, heart rate. *P < 0.05 vs. pretreatment. (C) Cardiac function assessed by cardiac catheterization. LVSP, LV peak systolic pressure; LVEDP, LV end-diastolic pressure; +dP/dt and –dP/dt, maximal and minimal first derivative of LV pressure. *P < 0.05 vs. saline-treated db/+; †P < 0.05 vs. saline-treated db/db.
Table 2.
Cardiac pathology and morphometry in db/+ and db/db mice
| db/+ |
db/db |
|||||
|---|---|---|---|---|---|---|
| Saline | Resveratrol | Chloroquine | Saline | Resveratrol | Chloroquine | |
| N = 6 | n = 6 | n = 6 | n = 12 | n = 12 | n = 12 | |
| Body weight, g | 29.5 ± 0.98 | 29.1 ± 0.39 | 29.8 ± 0.56 | 51.8 ± 1.12* | 53.0 ± 0.34* | 52.7 ± 0.97* |
| Heart weight, mg | 107.5 ± 3.7 | 115 ± 3.4 | 111.4 ± 3.4 | 118.5 ± 2.2* | 110.0 ± 1.8† | 121.5 ± 3.0* |
| Heart/Body ratio, mg/g | 3.67 ± 0.15 | 3.94 ± 0.08 | 3.74 ± 0.10 | 2.30 ± 0.06* | 2.08 ± 0.04*,† | 2.32 ± 0.08* |
| Myocyte size, μm | 11.7 ± 0.3 | 11.9 ± 0.1 | 11.9 ± 0.1 | 12.9 ± 0.4* | 12.2 ± 0.09 | 12.8 ± 0.5* |
| %Fibrosis | 1.63 ± 0.08 | 1.67 ± 0.12 | 1.68 ± 0.14 | 3.92 ± 0.15* | 2.88 ± 0.10*,† | 6.03 ± 0.50*,† |
P < 0.05 vs. the saline-treated db/+ group;
P < 0.05 vs. the saline-treated db/db group.
Autophagic profiles differ between type 1 and type 2 diabetic hearts
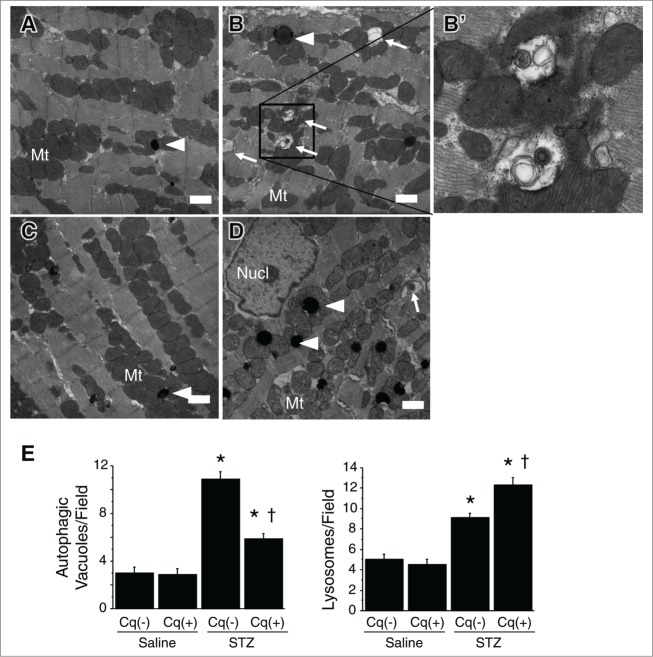
Because insulin inhibits autophagy via mechanistic target of rapamycin (MTOR) activation, we anticipated that autophagy would be enhanced in STZ-induced type 1 DM, reflecting the insulin deficiency. Consistent with idea, abundant green fluorescent protein (GFP) puncta were observed in the hearts of type 1 diabetic mice (Fig. 3A). Western blot analysis showed that expression of microtubule-associated protein 1 light chain 3 (LC3)-II was upregulated in type 1 diabetic mice, significantly increasing LC3-II/-I ratios (Fig. 3B). Using both immunohistochemistry and western blotting, we found that SQSTM1 levels were significantly increased in type 1 diabetic hearts (Fig. 3B), as was the expression level of CTSD, a lysosomal protein (Fig. 3C). Moreover, electron microscopy revealed that both autophagic vacuoles and lysosomes were abundant within cardiomyocytes from type 1 diabetic hearts (Fig. 4). Quantitative analysis under an electron microscope confirmed this observation (Fig. 4E). These ultrastructual findings are consistent with the results of immunohistochemistry and western blotting analysis. Overall, these findings indicate that autophagic activity is augmented in hearts from type 1 DM model mice.
Figure 3.

Autophagic profile in type 1 diabetic mice. (A) Accumulation of autophagic vacuoles. Immunofluorescent labeling of GFP-LC3 (green dots) and MB/myoglobin (red) within cardiomyocytes. Scale bars: 20 μm. The graph shows the numbers of GFP-LC3 dots per high-power field (HPF) (600×) (n = 6 each). (B) Western blotting with densitometric analysis of the autophagy-related proteins LC3 and SQSTM1 in hearts (n = 6 each). (C) Lysosomal activity in nondiabetic and STZ-induced diabetic hearts assessed by immunohistochemistry for CTSD and western blotting with densitometric analysis of CTSD (n = 6). Bars in photographs: 20 μm. *P < 0.05 vs. the nondiabetic control group; †P < 0.05 vs. STZ-treated diabetic group. STZ, streptozotocin; Cq, chloroquine.
Figure 4.
Electron micrographs of autophagic vacuoles in cardiomyocytes. (A) Nondiabetic control heart. ((B) and B') STZ-treated diabetic heart; B' is an enlargement of the boxed area in B. (C) Nondiabetic heart with chloroquine intervention. (D) STZ-treated diabetic heart with chloroquine intervention. Arrowheads and arrows indicate lysosomes (electron-dense spherical bodies) and autophagic vacuoles, respectively. Scale bars: 1 μm. Nucl, nucleus; Mt, mitochondria. (E) Quantification of autophagic vacuoles and lysosomes within cardiomyocytes under an electron microscope. Y-axis indicates the number of autophagic vacuoles (left panel) or lysosomes (right panel) per printed field (289 μm2) within a cardiomyocyte. *P < 0.05 vs. the nondiabetic control group; †P < 0.05 vs. STZ-treated diabetic group.
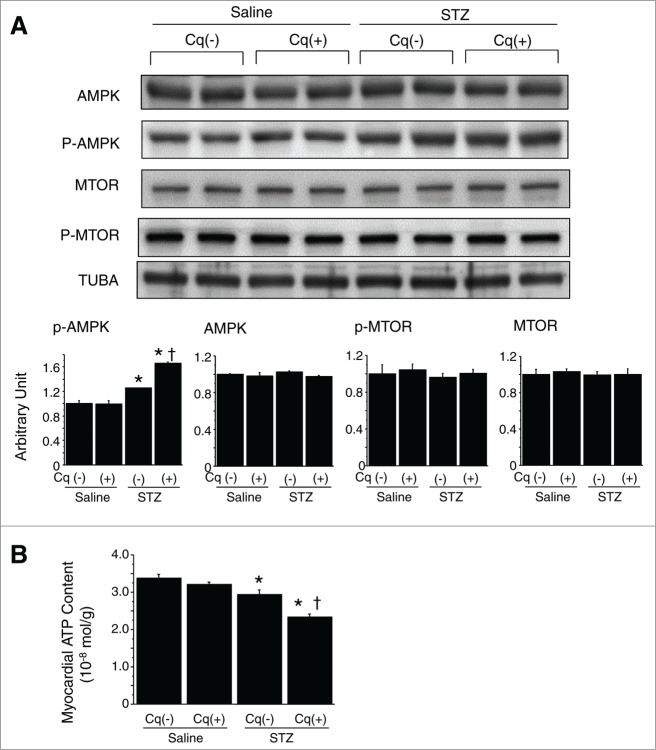
We observed a significant increase in the level of activated AMP-activated protein kinase (phosphorylated AMPK; p-AMPK) in STZ-treated diabetic hearts (Fig. 5A). Somewhat unexpectedly, expression of active MTOR (p-MTOR) was unchanged (Fig. 5A), which should theoretically be decreased by insulin deficiency and AMPK activation, but it can be influenced also by several other factors. Autophagy in the present setting thus seems not to be dependent on MTOR activity. Direct measurement revealed that the myocardial ATP content was reduced (Fig. 5B). Thus, hearts from mice with STZ-induced type 1 DM are energy-deficient with AMPK activation, despite the enhanced autophagy.
Figure 5.
Assessment of myocardial energy status and autophagy-related signals. (A) Western blotting with densitometric analysis of AMPK, p-AMPK, MTOR and p-MTOR (n = 6 each). (B) Myocardial ATP content in nondiabetic and STZ-induced diabetic hearts (n = 6 each). *P < 0.05 vs. the nondiabetic control group; †P < 0.05 vs. STZ-treated diabetic group. STZ, streptozotocin; Cq, chloroquine.
It is difficult to predict the level of autophagic activity in type 2 DM because it is affected by numerous confounding factors other than hyperglycemia. Double immunofluorescent labeling revealed that the number of LC3-positive autophagic vacuoles was significantly higher in db/db diabetic hearts than db/+ nondiabetic hearts. In addition, western blot analysis showed that LC3-II and SQSTM1 were more abundant in db/db than db/+ hearts (Fig. 6A and B). As a result, the LC3-II/-I ratio was significantly increased. On the other hand, CTSD abundance was smaller in db/db than db/+ hearts (Fig. 6C). Electron microscopy examination of the hearts of db/db mice revealed that autophagic vacuoles were abundant, but that late phase autophagosomes, i.e., autolysosomes, were strikingly rare, as were lysosomes (electron-dense vesicles) (Fig. 7). Quantitative analysis at the ultrastructural level revealed a significantly more abundant autophagic vacuoles while a significantly fewer lysosomes within cardiomyocytes of db/db type 2 diabetic mice compared with nondiabetic controls (Fig. 8). Instead, numerous degenerated mitochondria were seen, which were swollen with obviously disintegrated crista. In addition, we also found large numbers of homogenously electron-lucent spherical bodies that appeared to be lipid droplets.15
Figure 6.
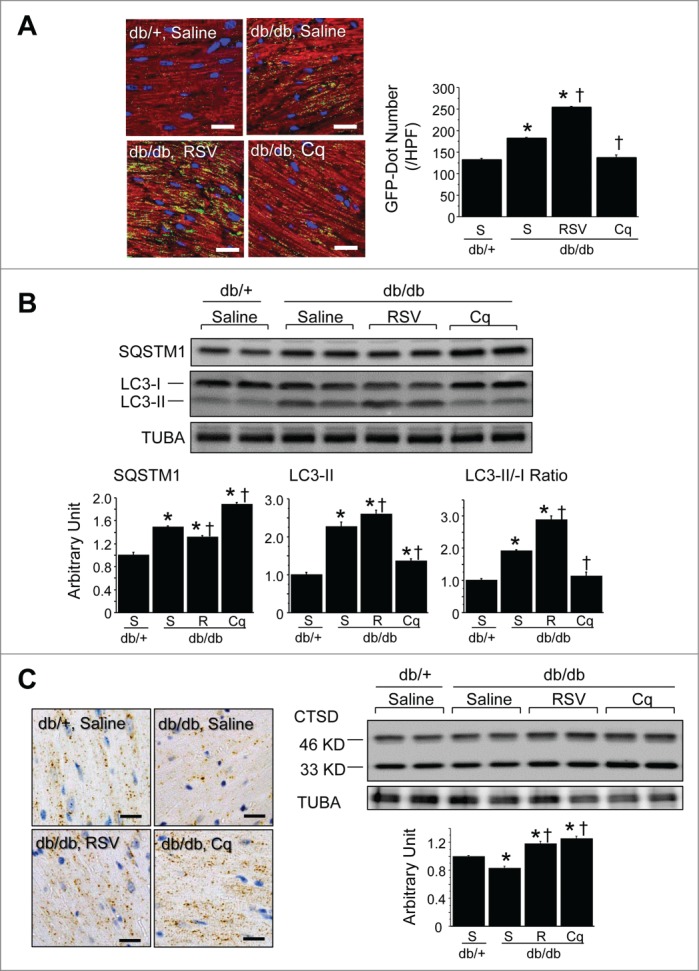
Autophagic profile of type 2 diabetic mice. (A) Accumulation of autophagic vacuoles. Immunofluorescent labeling of LC3 (green) and MB/myoglobin (red) within cardiomyocytes. Nuclei were stained blue with Hoechst 33342. Scale bars: 20 μm. The graph shows the numbers of LC3-positive (green) dots per high-power field (HPF) (600×) (n = 6 each). (B) Western blotting with densitometric analysis of the autophagy-related proteins LC3 and SQSTM1 in hearts. Graphs show the intensity of each band in arbitrary units and the LC3-II/LC3-I ratios (n = 6 each). (C) Lysosomal activity in db/+ nondiabetic and db/db diabetic hearts assessed by immunohistochemistry for CTSD and western blotting with densitometric analysis of CTSD (n = 6 each). Scale bar in micrographs: 20 μm. *P < 0.05 vs. the db/+ nondiabetic control group; †P < 0.05 vs. db/db diabetic group. S, saline; RSV, resveratrol; Cq, chloroquine.
Figure 7.
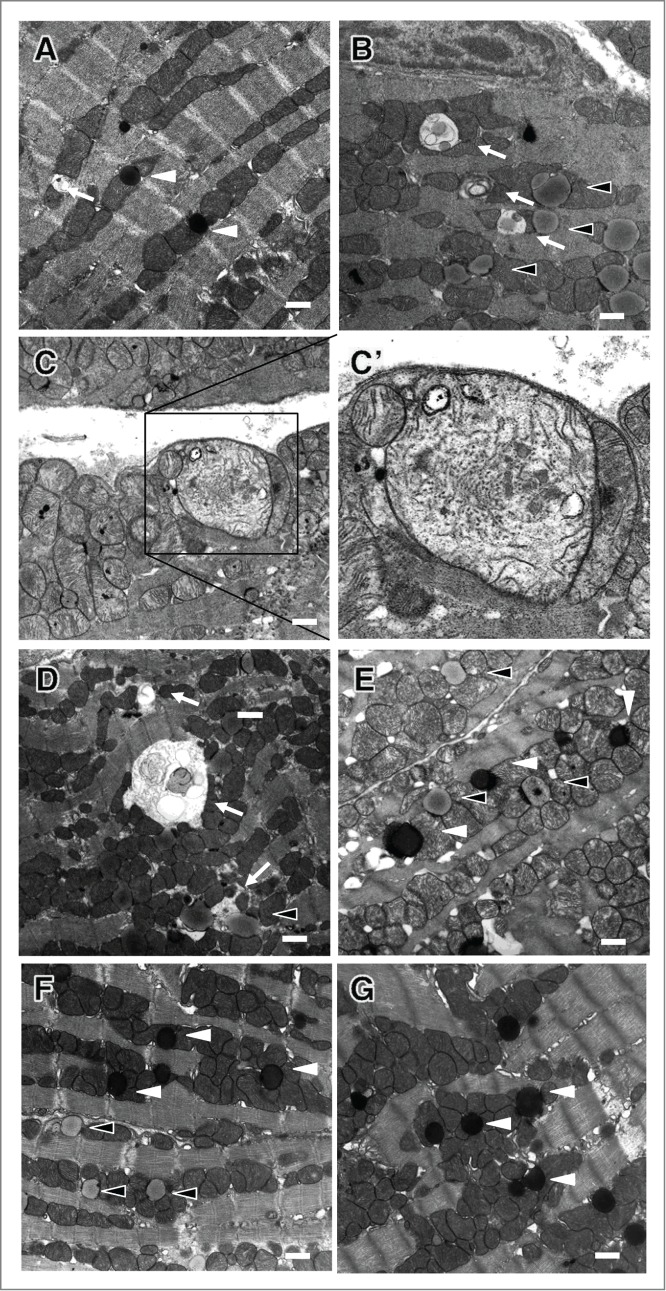
Electron micrographs of autophagic vacuoles in cardiomyocytes. (A) db/+ nondiabetic control heart. (B, C and C') db/db diabetic control hearts; C' is an enlargement of the boxed area in (C). (D and E) db/db hearts after resveratrol intervention. (F and G) db/db hearts after chloroquine intervention. Black arrowheads, white arrowheads and arrows indicate lysosomes (electron dense spherical bodies), lipids (homogenously electron-transparent light gray spherical bodies) and autophagic vacuoles, respectively. Scale bars: 1 μm.
Figure 8.
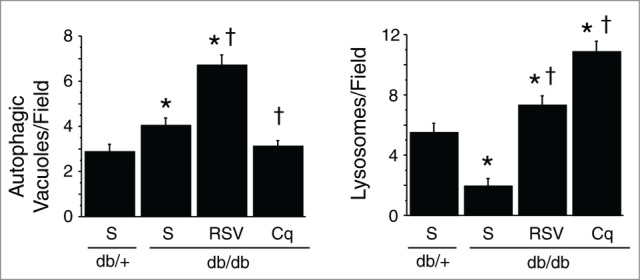
Quantification of autophagic vacuoles and lysosomes within cardiomyocytes under an electron microscope. Y-axis indicates the number of autophagic vacuoles (left panel) or lysosomes (right panel) per printed field (289 μm2) within a cardiomyocyte. *P < 0.05 vs. the db/+ nondiabetic control group; †P < 0.05 vs. db/db diabetic group.
To confirm whether the observed increase in LC3 dots was due to increased autophagosome formation or impairment of their degradation, we measured in vivo autophagic flux in db/db hearts.16,17 Under a short-term (4 h) intervention with chloroquine, greater numbers of LC3 dots were immunohistochemically evident in db/+ than db/db hearts, and western blot analysis confirmed increased expression of LC3-II in db/+ hearts, but not in db/db hearts (Fig. 9). Overall, these findings clearly indicate that autophagic flux was suppressed at the final digestion step in the hearts of db/db type 2 diabetic mice.
Figure 9.
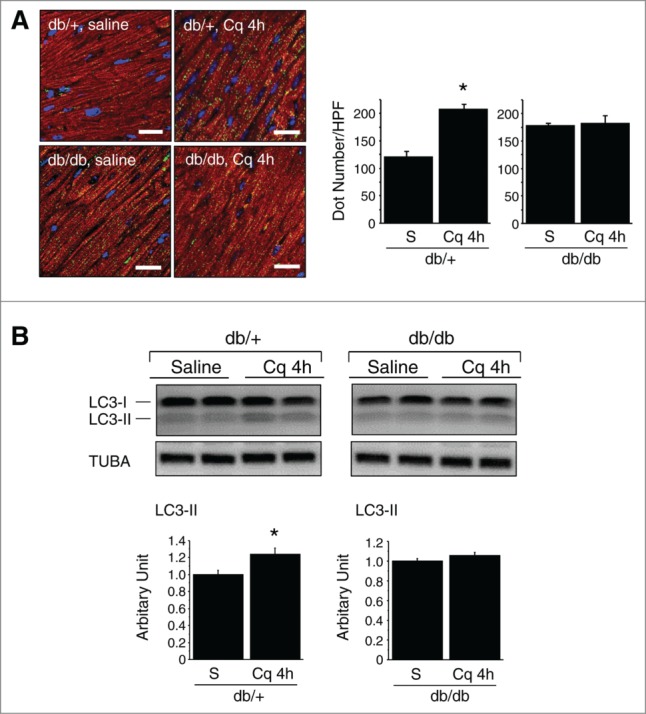
In vivo autophagic flux assay in db/+ nondiabetic and db/db type 2 diabetic mice. (A) Immunofluorescent labeling of LC3 (green) and myoglobin/MB (red) within cardiomyocytes. Nuclei were stained blue with Hoechst 33342. Scale bars: 20 μm. The graphs show the relative number of LC3 dots per HPF (600×) (n = 6 each). (B) Western blotting of LC3. The graphs show the relative levels of LC3-II expression determined using densitometry (n = 6 each). Sal, saline; Cq, chloroquine.
We observed a significant reduction in the level of p-AMPK in db/db hearts, as compared to db/+ hearts (Fig. 10A). Direct ATP measurement revealed that the myocardial ATP content was lower in db/db than db/+ hearts (Fig. 10B). We therefore suggest that in type 2 DM, the heart is energy deficient, despite a lack of AMPK activation.
Figure 10.
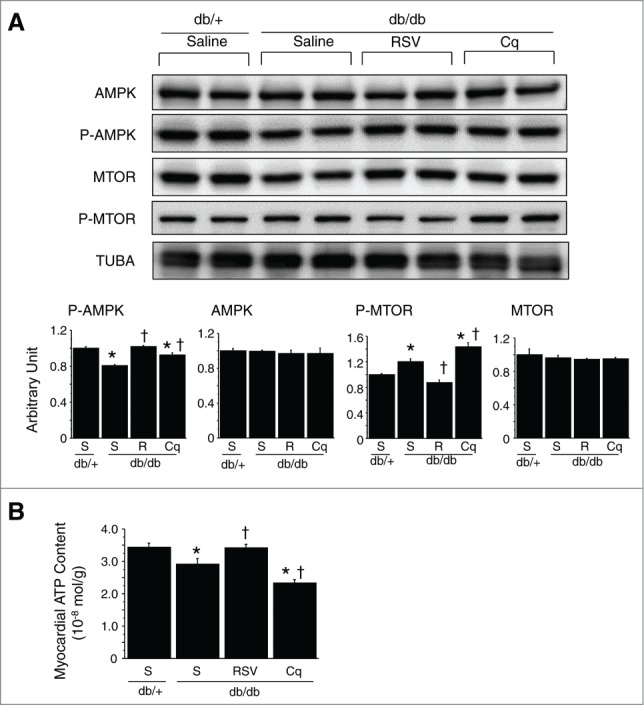
Assessment of myocardial energy status and autophagy-related signals. (A) Western blotting with densitometric analysis of AMPK, p-AMPK, MTOR and p-MTOR. Graphs show the intensity of each band in arbitrary units (n = 6 each). (B) Myocardial ATP content (n = 6 each). *P < 0.05 vs. the db/+ nondiabetic control group; †P < 0.05 vs. db/db diabetic group. S, saline; RSV/R, resveratrol; Cq, Chloroquine.
Effect of autophagy intervention on diabetic hearts
Treatment with chloroquine to inhibit autophagy did not affect the levels of casual glucose, HBA1c, or insulin secretion in either nondiabetic or STZ-induced type 1 diabetic mice (Fig. 1A). In the diabetic mice, however, chloroquine caused LV dilatation and worsened cardiac function (both systolic and diastolic), leading to an increase in heart-to-body weight ratios (Fig. 1B and C and Table 1). In addition, it significantly reduced numbers of GFP puncta and suppressed LC3-II expression, while enhancing SQSTM1 and CTSD expression (Fig. 3). Marked accumulation of lysosomes and incompletely digested mitochondria and membrane structures while inconspicuous mature autophagosomes within cardiomyocytes were characteristic features seen in the hearts from chloroquine-treated diabetic mice (Fig. 4). Levels of p-AMPK, which were already upregulated in diabetic hearts, were further increased by chloroquine, whereas MTOR activity was unaffected (Fig. 5A)—i.e., chloroquine brought about a further reduction in the myocardial ATP content, which was already reduced in the diabetic mice (Fig. 5B). Taken together, these findings indicate that hearts from mice with STZ-induced type 1 DM are energy-deficient with AMPK activation, despite increased autophagy, and inhibition of the autophagy pathway by chloroquine exacerbates the energy deficiency.
Resveratrol treatment reduced insulin resistance—i.e., resveratrol suppressed insulin secretion without changing HBA1c levels (Fig. 2A)—and mitigated the cardiac dysfunction and remodeling; diastolic function was improved, fibrosis was suppressed and hypertrophy, including both myocyte size and the heart-to-body weight ratio, was suppressed without a change in body weight (Fig. 2B and C and Table 2). Conversely, chloroquine treatment had the opposite effects on db/db diabetic hearts; it exacerbated insulin resistance, increased LV end diastolic pressure, dilated LV dimension, worsened both systolic and diastolic dysfunction, and increased fibrosis. In db/+ nondiabetic mice, in contrast, neither resveratrol nor chloroquine significantly affected the diabetic profile, cardiac function or pathological findings (Fig. 2B and C and Table 2).
Among db/db diabetic mice, the numbers of LC3-positive dots were significantly increased by resveratrol treatment and decreased by chloroquine treatment (Fig. 6A). LC3-II expression and the LC3-II/-I ratio were further increased by resveratrol but decreased by chloroquine. In contrast, SQSTM1 expression was decreased by resveratrol but increased by chloroquine (Fig. 6B), and both resveratrol and chloroquine increased CTSD expression (Fig. 6C). These findings suggest that the digestion step during autophagy was suppressed at the basal level in db/db diabetes heart, and that resveratrol restored lysosomal activity, while chloroquine inhibited lysosome fusion with autophagosomes. Consistent with those results, resveratrol treatment increased numbers of both autophagosomes and lysosomes, while chloroquine treatment caused accumulation of lysosomes, but not autophagic vacuoles including autolysosomes (Fig. 7).
We observed a significant reduction in the level of p-AMPK in db/db diabetic hearts, as compared with db/+ nondiabetic hearts, and the level was increased by both resveratrol and chloroquine (Fig. 10A). Direct ATP measurement revealed that the myocardial ATP content was lower in db/db than db/+ hearts. Resveratrol treatment significantly increased the myocardial ATP content, whereas chloroquine treatment reduced it (Fig. 10B). We found that levels of p-MTOR (a key regulator of autophagy) were elevated in db/db hearts, and that resveratrol treatment significantly reduced p-MTOR to levels similar to those seen in db/+ hearts. Conversely, chloroquine further increased p-MTOR levels (Fig. 10A). Western blotting for manganese superoxide dismutase (Mn-SOD) for assessment of antioxidant property revealed that the expression level of Mn-SOD was not affected by resveratrol treatment (data not shown).
Discussion
The present study demonstrates that the autophagic responses to diabetic cardiomyopathy are distinctly different in type 1 and type 2 DM: whereas cardiac autophagic activity is enhanced in type 1 DM, it is suppressed in type 2 DM. The difference between the cardiac ultrastructural features in the 2 types of DM was particularly impressive: lysosomes and autophagosomes accumulated within cardiomyocytes from type 1 diabetic mice, while abundant lipid droplets and autophagosomes, but no mature autolysosomes and rarely lysosomes were seen in type 2 DM. Several related studies have indeed been published. However, the findings are still controversial in each type of DM and it would thus be beneficial to compare type 1 and type 2 diabetes models in the same study using careful autophagy flux assays—i.e., not only biochemically but also ultrastructurally because the resultant difference could provide important insights into the pathophysiology of diabetic cardiomyopathies, which is essential for the development of new treatment strategies. Our findings actually suggest that resveratrol, an autophagy enhancer, may be a useful therapeutic agent for the treatment of diabetic cardiomyopathy in type 2 DM.
Role of autophagy in type 1 diabetic cardiomyopathy
Under normal physiological conditions, glucose, lactate, and fatty acids are the main energy substrates that maintain cardiac performance. Carbohydrate and fatty acid metabolism is important source of ATP, which is mainly produced in the tricarboxylic acid cycle and the electron transport chain. However, in a loaded heart, i.e. ischemic heart, mitochondrial oxidative metabolism decreases in proportion to the decrease in oxygen supply and as a result, fatty acid, glucose and lactate oxidation rates decrease. Although glycolysis becomes a significant source of energy in anaerobic conditions, insufficient ATP provision leads to a decrease in contractile function.18,19 In type 1 DM, SLC2A4 (solute carrier family 2 [facilitated glucose transporter, member 4]) and CD36/FAT (CD36 molecule [thrombospondin receptor]) cannot be translocated to the membrane due to the absence of insulin.20 Consequently, glucose and fatty acids cannot be effectively taken up through the membrane, which puts the affected cells in a state of starvation. ATP depletion or AMP accumulation activates AMPK to initiate autophagy. Thus, ATP deficiency may be one of the contributors to cardiac dysfunction in the type 1 diabetic heart. In addition, insulin acting via MTOR is known to inhibit autophagy,21,22 so that in cardiac insulin receptor knockout mice, there is a constitutively activated level of autophagy.23 It was thus easy to anticipate that autophagy would be enhanced in type 1 DM. Collectively these findings indicate that autophagy compensates (incompletely) for the lack of energy in an effort to maintain cardiac function in type 1 DM. Our findings in the type 1 DM model as well as those of Eguchi et al.24 are consistent with this idea. However, diametrically opposite reports do exist. Xie et al. report suppressed autophagy in hearts of STZ-treated mice and OVE26 type 1 diabetic model mice, which is restored by treatment with metformin to improve cardiac function.25 Conversely, Xu et al. report diminished autophagy in the same models and using genetically engineered mice, propose it as an adaptive response that limits cardiac dysfunction in type 1 DM.26 It is very difficult to reconcile those contradictory results but we would suggest that the difference might be related to the autophagy flux assay criteria between the studies (only biochemical vs. biochemical and ultrastructural). Further investigation is warranted regarding this issue.
Chloroquine is thought to raise lysosomal pH, thereby inhibiting lysosomal activity, and is used in assays of short-term (several hours) autophagic flux.16 LC3-II protein and undigested autophagosomes would thus be expected to accumulate in hearts treated with chloroquine. Somewhat curiously, however, we did not observe such accumulation when chloroquin was used for a long interval (14 d); instead, we found that numbers of LC3-immunopositive dots and the level of LC3-II were significantly reduced. In addition, we confirmed that autophagosome formation was suppressed, as assessed by electron microscopy examination. We repeatedly experienced the same phenomenon in a postmyocardial infarction model under administration of chloroquine for a long interval.13,27 The same phenomenon was also observed upon a long-term administration of bafilomycin A1, one of the other lysosomal inhibitors,28 to mice that had been starved or subjected to myocardial infarction.12,29 Thus, both chloroquine and bafilomycin A1 seem to inhibit autophagy when chronically administered through unknown mechanisms that downregulate the initial step of the autophagic process.
Role of autophagy in type 2 diabetic cardiomyopathy
Type 2 diabetic hearts display 2 opposing conditions regarding autophagy: 1) overeating and obesity lead to suppression of autophagy due to the high intracellular nutrient energy status; and 2) insulin resistance would cause downregulation of the insulin signal, as in type 1 DM, thereby enhancing autophagy. db/db diabetic mice suffer from a leptin receptor mutation that results in an inability to regulate metabolism and hyperphagia.30,31 Cardiac diastolic dysfunction was also observed in these mice. Although the increased cardiac expression of LC3-II appeared to upregulate autophagy, the ultrastructural changes (reduced numbers of autolysosomes and lysosomes), delayed autophagic flux, and reduced lysosomal activity showed that, in fact, LC3-II was simply accumulating due to suppression of autophagy at the final digestion step. Importantly we observed degenerated mitochondria and incomplete autolyososomes, which were regarded as immature autophagosomes, in hearts of db/db type 2 DM mice under an electron microscope. This finding is consistent with the findings of Xu et al. who show that autophagosome maturation is inhibited in high-fat-diet-induced obesity mice, which they report leads to cardiac dysfunction.32
Pharmacological manipulation demonstrated that autophagy influenced cardiac performance without affecting HBA1c levels in db/db mice; enhancement of autophagy using resveratrol restored cardiac diastolic function, while inhibition of autophagy using chloroquine worsened both cardiac diastolic and systolic function. In addition, the pathological changes (e.g., cardiac hypertrophy and fibrosis) nearly paralleled the cardiac performance.
Autophagy is upregulated in failing hearts depending on the degree of myocardial overload, but such upregulation is reversible; e.g., a left ventricular assist device can decrease markers of autophagy through mechanical unloading of the failing human heart.33 Such a change in autophagic markers would be related to energy requirements of the myocardium. Energy-sensing key molecules such as AMPK or MTOR connect the cellular energy levels with the autophagic machinery to result in increased ATP availability and improved energy efficiency and respiration. Thus autophagy culminates in control of cellular metabolic robustness and maximizes cell viability.34 Although some controversies exist, most reports in the literature show reduced p-AMPK levels in genetic models of rodent DM.35,36 Suppressing AMPK signaling reduces cardiac glucose transport, glycolysis, and fatty acid oxidation, and thus the energy supply needed for cardiac performance.37 Collectively then, it appears suppression of AMPK signaling and autophagy are essential components of the etiology of diabetic cardiomyopathy. Notably, however, the autophagy enhancer, resveratrol, was an effective counter-agent. Resveratrol activates autophagy via the AMPK-MTOR pathway to improve cardiac performance. We have previously detected similar beneficial effects of resveratrol involving autophagic activation in postinfarction heart failure.13 In addition, although resveratrol reduced insulin resistance and suppressed insulin secretion, body weights, casual blood glucose, and HBA1c levels were all unaffected. It remains unclear whether resveratrol activates autophagy directly through its reduction of insulin resistance, or whether resveratrol restores autophagy, which in turn reduces insulin resistance as a consequence.
Limitations of the study
The agents we used in the present study do not specifically target autophagy or the heart; both chloroquine and resveratrol have several actions other than modulation of autophagy, and both affect systemic metabolism. Thus, we cannot say that the profound alterations in cardiac function we observed resulted solely from manipulation of cardiomyocyte autophagy because of possible actions of the reagents independent of modulating autophagy. However, we confirmed that neither chloroquine nor resveratrol affected the structure or function of normal hearts. Since a completely inverse correlation was noted between autophagic findings in the heart and diabetic cardiac dysfunction and fibrosis, it would be allowed to conclude that the altered cardiac function and structure is most likely through modulating cardiomyocyte autophagy, but less possibly through the other chloroquine- or resveratrol-specific actions. A dose-escalating study with each reagent may bring about more convincing results. Another effective means of resolving the issue may be through the use of conditional knockout or transgenic mice expressing an autophagy-related gene. However, such approaches may also lack specificity, as it was recently reported that there is an alternative autophagic pathway that is independent of Atg5 and Atg7, which had been considered essential for mammalian autophagy.38,39 Conversely, our pharmacological approach has a merit in this problem—e.g., chloroquine inhibits autophagosome-lysosome fusion to prevent final step of both classic and alternative pathways of autophagy.
Resveratrol exerts multiple effects to regulate a variety of key molecules.40,41 SIRT1 (sirtuin 1), an NAD+ dependent protein/histone deacetylase, is a mammalian ortholog of yeast Sir2, and deacetylates histone polypeptides with a preference for histone H3 lysine 9.42 We previously confirmed that resveratrol activates SIRT1 in postinfarction hearts but we also showed dissociation between SIRT1 activity and autophagy-induced cardioprotection in postinfarction heart failure.13 It remains unclear whether SIRT1 has a direct effect on autophagy in type 2 DM hearts. The present study showed that in the type 2 DM model myocardial Mn-SOD expression levels were similar between the nondiabetic and diabetic groups and between sham, resveratrol-treated, and chloroquine-treated groups. We would not deny the antioxidant property of resveratrol, of which role for cardioprotection as well as that of SIRT1 we speculate may not be so strong in the type 2 DM heart model.
Materials and Methods
This study conforms to the Guide for the Care and Use of Laboratory Animals published by the US National Institutes of Health (NIH Publication, 8th Edition, 2011) and was approved by the institutional animal research committee of Gifu University.
Type 1 DM model mice
We used GFP-LC3B transgenic mice to monitor autophagic vacuoles. Pathogen-free heterozygous GFP-LC3B transgenic mice (strain GFP-LC3#53) (Riken BioResource Center) harbored a rat GFP-LC3B fusion construct under the control of the chicken ACTB promoter.43 Type 1 DM was induced in mice (10-wk old) by intraperitoneal administration of 250 mg/kg of STZ (Sigma-Aldrich, S0130).44 Animals with tail vein blood glucose levels greater than 300 mg/dl 7 d after STZ injection were deemed diabetic. Saline-treated, age-matched GFP-LC3B mice served as nondiabetic controls. To evaluate the role of autophagy, we treated mice with chloroquine (Sigma-Aldrich, C6628), an autophagy inhibitor, long term (14 d).13,14,16 Diabetic and control mice were each assigned to 2 groups: saline (n = 17 each) or chloroquine (10 mg/kg/day, n = 17 each). The reagents were administered for 14 d using subcutaneously embedded osmotic minipumps (ALZET, 1002; DURECT, Cupertino, CA).
Type 2 DM model mice
We used C57BLKS/J Iar −+leprdb/leprdb (db/db) mice as the model of type 2 DM, and used age-matched C57BLKS/J Iar −m+/+leprdb (db/+) mice as the nondiabetic control.30,31 These mice were purchased from SLC Japan Inc.. Ten-wk-old db/db and db/+ mice were assigned to 3 groups treated for 2 wk with vehicle (saline, n = 12, each), resveratrol (Sigma-Aldrich, R5010, 50 mg/kg/d, n = 12 each) or chloroquine (10 mg/kg/d, n = 12 each). Chloroquine was used as an autophagy inhibitor, as mentioned, while resveratrol served as an autophagy enhancer.40,45 These reagents were administered to the mice for 14 d using subcutaneously embedded osmotic minipumps (ALZET, 1002; DURECT, Cupertino, CA).
Physiological studies
Echocardiography and cardiac catheterization were performed before sacrifice, as described previously.12,13
Histology
Once the physiological measurements were complete, the mice were sacrificed and the hearts were removed, weighed and cut into 2 transverse slices through the middle of the ventricles, between the atrioventricular groove and the apex. The specimens derived from basal portion of hearts were fixed in 10% buffered formalin, embedded in paraffin or cryomold, cut into 4-μm-thick sections and stained with hematoxylin-eosin, Masson trichrome, or Sirius red. Quantitative assessments and morphometric analyses were carried out in randomly chosen high-power fields (400×) in each section as previously described.11-13 In brief, morphometric analysis of fibrosis was carried out using a multipurpose color image processor (Win ROOF, Mitani Corporation, Tokyo, Japan). Cardiomyocyte size was measured as the transverse diameter of the cardiomyocyte cut at the level of the nucleus.46
Immunohistochemistry and immunofluorescence
After deparaffinization, the 4-μm-thick sections were incubated with a primary antibody against GFP (Molecular Probes, A11122), LC3 (MBL International, M115–3) or CTSD (Santa Cruz Biotechnology, sc-6486). To observe autophagic activity in cardiomyocytes, sections immunostained with anti-GFP or anti-LC3 followed by Alexa Fluor 488 (green; Molecular Probes, A-11008) were also labeled with anti-MB/myoglobin antibody (DAKO Japan, A0324) followed by Alexa Fluor 568 (red; Molecular Probes, A-11036). These sections were then counterstained with Hoechst 33342 (Setareh Biotech, 23491–52–3) and observed under a confocal microscope (C2, Nikon, Tokyo, Japan). A Vectastain Elite ABC system (Vector Laboratories, PK-6105) was used for immunostaining CTSD; diaminobenzidine served as the chromogen, and the nuclei were counterstained with hematoxylin. Quantitative assessments, including numbers of immunopositive dots within cells, were performed in 20 randomly chosen high-power fields (600×) using a multipurpose color image processor (BZ-Analyzer, KEYENCE, Osaka, Japan).
Electron microscopy
Cardiac ultrastructure was examined under a transmission electron microscope (H-800; Hitachi, Tokyo, Japan) using conventional methods as previously described.11–13 We performed a morphometric analysis with an electron microscope using the method previously described with modification.47 In brief, a uniform sampling of 10 electron micrographs was utilized for the morphometric assay of each group. Five random fields, micrographed at 6,000× from each of 5 blocks were printed at a final magnification of 9,000× and analyzed to calculate the number of autophagic vacuoles (including autophagosomes and autolysosomes) and that of lysosomes per printed field (289 μm2) within a cardiomyocyte. Since it is sometimes difficult to distinguish between an autophagosome and autolysosome even under an electron microscope, we evaluated them not separately but in sum as an autophagic vacuole.
Western blot analysis
Proteins (50 μg) extracted from hearts were subjected to 7.5%, 10%, or 15% polyacrylamide gel electrophoresis and then transferred onto polyvinylidene difluoride membranes. The membranes were then probed using antibodies against LC3B (MBL International, PM036), SQSTM1 (MBL International, PM045), CTSD (Santa Cruz Biotechnology, sc-6486), AMPK, phosphorylated AMPK (p-AMPK), MTOR and phosphorylated MTOR (p-MTOR; all from Cell Signaling technology, 2532, 2535, 2972 and 2974) and Mn-SOD (Millipore, 06–984), after which the blots were visualized using enhanced chemiluminescence (Amersham/GE Healthcare, RPN2232). TUBA (analyzed using an antibody from Santa Cruz Biotechnology, sc-5546) served as the loading control. The protein content was expressed as ratio (arbitrary unit) relative to that of loading control.
Blood glucose levels
Blood was collected from the tail veins of diabetic and nondiabetic mice, and blood glucose levels were measured using a glucometer (GR-102, Terumo, Tokyo, Japan).
Serum insulin levels
Whole blood was collected from the carotid artery after catheter examination. Serum insulin levels were then assessed using a commercially available mouse insulin ELISA Kit (AKRIN-011T, Shibayagi, Gunma, Japan).
HBA1c
After collecting whole blood from the carotid artery, plasma was isolated and HBA1c levels were measured by a clinical laboratory (SRL, Tokyo, Japan).
Measurement of myocardial ATP content
The myocardial ATP content was measured using an ATP bioluminescent assay kit (TA100, TOYO Ink, Tokyo, Japan) according to the manufacturer's instructions.
Autophagic flux assay
We investigated autophagic flux in 10-week-old db/db and db/+ mice using the previously described method.16,17
Statistical analysis
Data are expressed as means ± SEM. The significance of differences in variances was evaluated using the Barlett test. When the variances were significantly different, the significance of differences was tested using the Kruskal-Wallis test. All data were tested for normal distribution using the Kolmogorov-Simonov test. The significance of differences between groups was evaluated using one-way ANOVA or repeated-measures ANOVA with the post-hoc Newman-Keul multiple comparison test. Values of P < 0.05 were considered significant.
Disclosure of Potential Conflicts of Interest
No potential conflicts of interest were disclosed.
Acknowledgments
We thank Natsuko Ishigami, Chika Ogawa, and Megumi Minagawa at Gifu University and Rieko Hori and Norie Soga at Asahi University for their assistance.
Funding
This study was supported in part by research grant from Kanae Foundation for the promotion of medical science.
References
- 1.King H, Aubert RE, Herman WH. Global burden of diabetes. 1995–2025: prevalence, numerical estimates, and projection. Diabetes Care 1998; 21:1414-31; PMID:9727886; http://dx.doi.org/ 10.2337/diacare.21.9.1414 [DOI] [PubMed] [Google Scholar]
- 2.Plutzky J. Macrovascular effects and safety issues of therapies for type 2 diabetes. Am J Cardiol 2011; 108:25B-32B; PMID:21802578; http://dx.doi.org/ 10.1016/j.amjcard.2011.03.014 [DOI] [PubMed] [Google Scholar]
- 3.Picano E. Diabetic cardiomyopathy: the importance of being earliest. J Am Coll Cardiol 2003; 42:454-7; PMID:12906971; http://dx.doi.org/ 10.1016/S0735-1097(03)00647-8 [DOI] [PubMed] [Google Scholar]
- 4.Avogaro A, Vigili de Kreutzenberg S, Negut C, Tiengo A, Scognamiglio R. Diabetic cardiomyopathy : a metabolic perspective. Am J Cardiol 2004; 93:13A-16A; PMID:15094099; http://dx.doi.org/ 10.1016/j.amjcard.2003.11.003 [DOI] [PubMed] [Google Scholar]
- 5.Boudina S, Abel ED. Diabetic cardiomyopathy revisited. Circulation 2007; 115:3213-23; PMID:17592090; http://dx.doi.org/ 10.1161/CIRCULATIONAHA.106.679597 [DOI] [PubMed] [Google Scholar]
- 6.Levine B, Klionsky DJ. Development by self-digestion: molecular mechanisms and biological functions of autophagy. Dev Cell 2004; 6:463-77; PMID:15068787; http://dx.doi.org/ 10.1016/S1534-5807(04)00099-1 [DOI] [PubMed] [Google Scholar]
- 7.Takemura G, Miyata S, Kawase Y, Okada H, Maruyama R, Fujiwra H. Autophagic degeneration and death of cardiomyocytes in heart failure. Autophagy 2006; 2:212-4; PMID:16874110; http://dx.doi.org/ 10.4161/auto.2608 [DOI] [PubMed] [Google Scholar]
- 8.Hein S, Arnon E, Kostin S, Schönburg M, Elsässer A, Polyakova V, Bauer EP, Klövekorn WP, Schaper J. Progression from compensated hypertrophy to failure in the pressure-overloaded human heart: structural deterioration and compensatory mechanisms. Circulation 2003; 107:984-91; PMID:12600911; http://dx.doi.org/ 10.1161/01.CIR.0000051865.66123.B7 [DOI] [PubMed] [Google Scholar]
- 9.Nakai A, Yamaguchi O, Takeda T, Higuchi Y, Hikoso S, Taniike M, Omiya S, Mizote I, Matsumura Y, Asahi M, et al.. The role of autophagy in cardiomyocytes in the basal state and in response to hemodynamic stress. Nat Med 2007; 13:619-24; PMID:17450150; http://dx.doi.org/ 10.1038/nm1574 [DOI] [PubMed] [Google Scholar]
- 10.Yan L, Vatner DE, Kim SJ, Ge H, Masurekar M, Massover WH, Yang G, Matsui Y, Sadoshima J, Vatner SF. Autophagy in chronically ischemic myocardium. Proc Natl Acad Sci USA 2005; 102:13807-12; PMID:16174725; http://dx.doi.org/ 10.1073/pnas.0506843102 [DOI] [PMC free article] [PubMed] [Google Scholar]
- 11.Kanamori H, Takemura G, Goto K, Maruyama R, Ono K, Nagano K, Tsujimoto A, Ogino A, Takeyama T, Kawaguchi T, et al.. Autophagy limits acute myocardial infarction induced by permanent coronary occlusion. Am J Physiol Heart Circ Physiol 2011; 300:H2261-71; PMID:21421825; http://dx.doi.org/ 10.1152/ajpheart.01056.2010 [DOI] [PubMed] [Google Scholar]
- 12.Kanamori H, Takemura G, Goto K, Maruyama R, Tsujimoto A, Ogino A, Takeyama T, Kawaguchi T, Watanabe T, Fujiwara T, et al.. The role of autophagy emerging in post infarction cardiac remodeling. Cardiovasc Res 2011; 91:330-9; PMID:21406597; http://dx.doi.org/ 10.1093/cvr/cvr073 [DOI] [PubMed] [Google Scholar]
- 13.Kanamori H, Takemura G, Goto K, Tsujimoto A, Ogino A, Takeyama T, Kawaguchi T, Watanabe T, Morishita K, Kawasaki M, et al.. Resveratrol reverses remodeling in hearts with large, old myocardial infarctions through enhanced autophagy-activating AMP Kinase pathway. Am J Pathol 2013; 182:701-13; PMID:23274061; http://dx.doi.org/ 10.1016/j.ajpath.2012.11.009 [DOI] [PubMed] [Google Scholar]
- 14.Shinmura K, Tamaki K, Sano M, Murata M, Yamakawa H, Ishida H, Fukuda K. Impact of long-term caloric restriction on cardiac senescence: Caloric restriction ameliorates cardiac diastolic dysfunction associated with aging. J Mol Cell Cardiol 2011; 50:117-27; PMID:20977912; http://dx.doi.org/ 10.1016/j.yjmcc.2010.10.018 [DOI] [PubMed] [Google Scholar]
- 15.Singh R, Kaushik S, Wang Y, Xiang Y, Novak I, Komatsu M, Tanaka K, Cuervo AM, Czaja MJ. Autophagy regulates lipid metabolism. Nature 2009; 458:1131-5; PMID:19339967; http://dx.doi.org/ 10.1038/nature07976 [DOI] [PMC free article] [PubMed] [Google Scholar]
- 16.Iwai-Kanai E, Yuan H, Huang C, Sayen MR, Perry-Garza CN, Kim L, Gottlieb RA. A method to measure cardiac autophagic flux in vivo. Autophagy 2008; 4:322-9; PMID:18216495; http://dx.doi.org/ 10.4161/auto.5603 [DOI] [PMC free article] [PubMed] [Google Scholar]
- 17.Kawaguchi T, Takemura G, Kanamori H, Takeyama T, Watanabe T, Morishita K, Ogino A, Tsujimoto A, Goto K, Maruyama R, et al.. Prior starvation mitigates acute doxorubicin cardiotoxity through restoration of autophagy in affected cardiomyocytes. Cardiovasc Res 2012; 96:456-65; PMID:22952253; http://dx.doi.org/ 10.1093/cvr/cvs282 [DOI] [PubMed] [Google Scholar]
- 18.Jennings RB, Steenbergen C Jr. Nucleotide metabolism and cellular damage in myocardial ischemia. Annu Rev Physiol 1985; 47:727-49; PMID:2581508; http://dx.doi.org/ 10.1146/annurev.ph.47.030185.003455 [DOI] [PubMed] [Google Scholar]
- 19.Lam A, Lopaschuk GD. Anti-anginal effects of partial fatty acid oxidation inhibitors. Curr Opin Pharmacol 2007; 7:179-85; PMID:17307396; http://dx.doi.org/ 10.1016/j.coph.2006.10.008 [DOI] [PubMed] [Google Scholar]
- 20.Bertrand L, Homan S, Beauloye C, Vanoverschelde JL. Insulin signaling in the heart. Cardiovasc Res 2008; 79:238-48; PMID:18390897; http://dx.doi.org/ 10.1093/cvr/cvn093 [DOI] [PubMed] [Google Scholar]
- 21.Levine B, Kroemer G. Autophagy in the pathogenesis of disease. Cell 2008; 132:27-42; PMID:18191218; http://dx.doi.org/ 10.1016/j.cell.2007.12.018 [DOI] [PMC free article] [PubMed] [Google Scholar]
- 22.Salih DA, Brunet A. FoxO transcription factors in the maintenance of cellular homeostasis during aging. Curr Opin Cell Biol 2008; 20:126-36; PMID:18394876; http://dx.doi.org/ 10.1016/j.ceb.2008.02.005 [DOI] [PMC free article] [PubMed] [Google Scholar]
- 23.Boudina S, Bugger H, Sena S, O'Neill BT, Zaha VG, IIkun O, Wright JJ, Mazumder PK, Palfreyman E, Tidwell TJ, et al.. Contribution of impaired myocardial insulin signaling to mitochondrial dysfunction and oxidative stress in the heart. Circulation 2009; 119:1272-83; PMID:19237663; http://dx.doi.org/ 10.1161/CIRCULATIONAHA.108.792101 [DOI] [PMC free article] [PubMed] [Google Scholar]
- 24.Eguchi M, Kim YH, Kang KW, Shim CY, Jang Y, Dorval T, Kim KJ, Sweeney G. Ischemia-reperfusion injury leads to distinct temporal cardiac remodeling in normal versus diabetic mice. PLoS One 2012; 7:e30450; PMID:22347376; http://dx.doi.org/ 10.1371/journal.pone.0030450 [DOI] [PMC free article] [PubMed] [Google Scholar]
- 25.Xie Z, Lau K, Eby B, Lozano P, He C, Pennington B, Li H, Rathi S, Dong Y, Tian R, et al.. Improvement of cardiac functions by chronic metformin treatment is associated with enhanced cardiac autophagy in diabetic OVE26 mice. Diabetes 2011; 60:1770-8; PMID:21562078; http://dx.doi.org/ 10.2337/db10-0351 [DOI] [PMC free article] [PubMed] [Google Scholar]
- 26.Xu X, Kobayashi S, Chen K, Timm D, Volden P, Huang Y, Gulick J, Yue Z, Robbin J, Epstein PN, et al.. Diminished autophagy limits cardiac injury in mice models of type 1 diabetes. J Biol Chem 2013; 288:18077-92; PMID:23658055; http://dx.doi.org/ 10.1074/jbc.M113.474650 [DOI] [PMC free article] [PubMed] [Google Scholar]
- 27.Watanabe T, Takemura G, Kanamori H, Goto K, Tsujimoto A, Okada H, Kawamura I, Ogino A, Takeyama T, Kawaguchi T, et al.. Restriction of food intake prevents postinfarction heart failure by enhancing autophagy in the surviving cardiomyocytes. Am J Pathol 2014; 184:1384-94; PMID:24641899; http://dx.doi.org/ 10.1016/j.ajpath.2014.01.011 [DOI] [PubMed] [Google Scholar]
- 28.Yamamoto A, Tagawa Y, Yoshimori T, Moriyama Y, Masaki R, Tashiro Y: Bafilomycin A1 prevents maturation of autophagic vacuoles by inhibiting fusion between autophagosomes and lysosomes in rat hepatoma cell line, H-4-II-E cells. Cell Struct Funct 1998; 23:33-42; PMID:9639028; http://dx.doi.org/ 10.1247/csf.23.33 [DOI] [PubMed] [Google Scholar]
- 29.Kanamori H, Takemura G, Maruyama R, Goto K, Tsujimoto A, Ogino A, Li L, Kawamura I, Takeyama T, Kawaguchi T, et al.. Functional significance and morphological characterization of starvation-induced autophagy in the adult heart. Am J Pathol 2009; 174:1705-14; PMID:19342365; http://dx.doi.org/ 10.2353/ajpath.2009.080875 [DOI] [PMC free article] [PubMed] [Google Scholar]
- 30.Chen H, Charlat O, Tartaglia LA, Woolf EA, Weng X, Ellis SJ, Lakey ND, Culpepper J, Moore KJ, Breitbart RE, et al.. Evidence that the diabetes gene encodes the leptin receptor: identification of a mutation in the leptin receptor gene in db/db mice. Cell 1996; 84:491-5; PMID:8608603; http://dx.doi.org/ 10.1016/S0092-8674(00)81294-5 [DOI] [PubMed] [Google Scholar]
- 31.Greer JJ, Ware DP, Lefer DJ. Myocardial infarction and heart failure in the db/db diabetic mouse. Am J Physiol Heart Circ Physiol 2006; 290:H146-53; PMID:16113078; http://dx.doi.org/ 10.1152/ajpheart.00583.2005 [DOI] [PubMed] [Google Scholar]
- 32.Xu X, Hua Y, Nair S, Zhang Y, Ren J. Akt2 knockout preserves cardiac function in high-fat diet-induced obesity by rescuing cardiac autophagosome maturation. J Mol Cell Biol 2013; 5:61-3; PMID:23258696; http://dx.doi.org/ 10.1093/jmcb/mjs055 [DOI] [PMC free article] [PubMed] [Google Scholar]
- 33.Kassiotis C, Ballal K, Wellnitz K, Vela D, Gong M, Salazar R, Frazier OH, Taegtmeyer H. Markers of autophagy are downregulared in failing human heart after mechanical unloading. Circulation 2009; 120:S191-7; PMID:19752367; http://dx.doi.org/ 10.1161/CIRCULATIONAHA.108.842252 [DOI] [PMC free article] [PubMed] [Google Scholar]
- 34.Loos B, Engelbrecht AM, Lockshin RA, Klionsky DJ, Zakeri Z. The variability of autophagy and cell death susceptibility: Unanswered questions. Autophagy 2013; 9:1270-85; PMID:23846383; http://dx.doi.org/ 10.4161/auto.25560 [DOI] [PMC free article] [PubMed] [Google Scholar]
- 35.Stenberg GR, Kemp B.E.. AMPK in Health and disease. Physiol Rev 2009; 89; 1025-78; PMID:19584320; http://dx.doi.org/ 10.1152/physrev.00011.2008 [DOI] [PubMed] [Google Scholar]
- 36.Daniels A, van Bilsen M, Jansssen BJ, Brouns AE, Cleutjens JP, Roemen TH, Schaart G, van der Velden J, van der Vusse GJ, van Nieuwenhoven FA. Impaired cardiac functional reserve in type 2 diabetic db/db mice is associated with metabolic, but not structural, remodeling. Acta Physiol (Oxf) 2010; 200; 11-22; PMID:20175764 [DOI] [PubMed] [Google Scholar]
- 37.Kim AS, Miller EJ, Young LH. AMP-activated protein kinase: a core signaling pathway in the heart. Acta Physiol (Oxf) 2009; 196:37-53; PMID:19239414; http://dx.doi.org/ 10.1111/j.1748-1716.2009.01978.x [DOI] [PubMed] [Google Scholar]
- 38.Nishida Y, Arakawa S, Fujitani K, Yamaguchi H, Mizuta T, Kanaseki T, Komatsu M, Otsu K, Tsujimoto Y, Shimizu S. Discovery of Atg5/Atg7-independent alternative macroautophagy. Nature 2009; 461:654-8; PMID:19794493; http://dx.doi.org/ 10.1038/nature08455 [DOI] [PubMed] [Google Scholar]
- 39.Codogno P, Mehrpour M, Proikas-Cezanne T. Canonical and non-canonical autophagy: Variations on a common theme of self-eating? Nat Rev Mol Biol Cell 2011; 13:7-12; http://dx.doi.org/ 10.1038/nrn3125 [DOI] [PubMed] [Google Scholar]
- 40.Baur JA, Sinclair DA. Therapeutic potential of resveratrol: the in vivo evidence. Nat Rev Drug Discov 2006; 5:493-506; http://dx.doi.org/ 10.1038/nrd2060 [DOI] [PubMed] [Google Scholar]
- 41.Dolinsky VW, Dyck JR. Calorie restriction and resveratrol in cardiovascular health and disease. Biochim Biophys Acta 2011; 1812:1477-89; http://dx.doi.org/ 10.1016/j.bbadis.2011.06.010 [DOI] [PubMed] [Google Scholar]
- 42.Vaquero A, Scher M, Lee D, Erdjument-Bromage H, Tempst P, Reinberg D. Human Sirt1 interacts with histone H1 and promotes formation of facultative heterochromatin. Mol Cell 2004; 16:93-105 [DOI] [PubMed] [Google Scholar]
- 43.Mizushima N, Yamamoto A, Matsui M, Yoshimori T, Ohsumi Y. In vivo analysis of autophagy in response to nutrient starvation using transgenic mice expressing a fluorescent autophagosome marker. Mol Biol Cell 2004; 15:1101-11; PMID:14699058; http://dx.doi.org/ 10.1091/mbc.E03-09-0704 [DOI] [PMC free article] [PubMed] [Google Scholar]
- 44.Chen N, Chen WY, Bellush L, Yang CW, Striker LJ, Striker GE, Kopchick JJ. Effects of STZ treatment in growth hormone (GH) and GH antagonist transgenic mice. Endocrinology 1995; 136:660-7; PMID:7835300 [DOI] [PubMed] [Google Scholar]
- 45.Morselli E, Mariño G, Bennetzen MV, Eisenberg T, Megalou E, Schroeder S, Cabrera S, Bénit P, Rustin P, Criollo A, et al.. Spermidine and resveratrol induce autophagy by distinct pathways converging on the acetylproteome. J Cell Biol 2011; 192:615-29; PMID:21339330; http://dx.doi.org/ 10.1083/jcb.201008167 [DOI] [PMC free article] [PubMed] [Google Scholar]
- 46.Uegaito T, Fujiwara H, Ishida M, Kawamura A, Takemura G, Kida M, Tanaka M, Kawai C. Hypertrophy of surviving myocytes overlying the infarct in human old myocardial infarctions with abnormal Q waves. Int J Cardiol 1991; 32:93-101; PMID:1864674; http://dx.doi.org/ 10.1016/0167-5273(91)90048-T [DOI] [PubMed] [Google Scholar]
- 47.Nakagawa M, Takemura G, Kanamori H, Goto K, Maruyama R, Tsujimoto A, Ohno T, Okada H, Ogino A, Esaki M, et al.. Mechanisms by which late coronary reperfusion mitigates postinfarction cardiac remodeling. Circ Res 2008; 103:98-106; PMID:18519944; http://dx.doi.org/ 10.1161/CIRCRESAHA.108.177568 [DOI] [PubMed] [Google Scholar]


