

Abstract
Systemic lupus erythematosus (SLE) is a heterogeneous autoimmune disease, defined by loss of B cell self-tolerance that results in production of antinuclear antibodies (ANA) and chronic inflammation. While the initiating events in lupus development are not well defined, overexpression of the RNA-recognizing toll-like receptor (TLR)7 has been linked to SLE in humans and mice. We postulated that autophagy plays an essential role in TLR7 activation of B cells for the induction of SLE by delivering RNA ligands to the endosomes, where this innate immune receptor resides. To test this hypothesis, we compared SLE development in Tlr7 transgenic (Tg) mice with or without B cell-specific ablation of autophagy (Cd19-Cre Atg5f/f). We observed that in the absence of B cell autophagy the 2 hallmarks of SLE, ANA and inflammation, were eliminated, thus curing these mice of lupus. This was also evident in the significantly extended survival of the autophagy-deficient mice compared to Tlr7.1 Tg mice. Furthermore, glomerulonephritis was ameliorated, and the serum levels of inflammatory cytokines in the knockout (KO) mice were indistinguishable from those of control mice. These data provide direct evidence that B cells require TLR7-dependent priming through an autophagy-dependent mechanism before autoimmunity is induced, thereafter involving many cell types. Surprisingly, hyper-IgM production persisted in Tlr7.1 Tg mice in the absence of autophagy, likely involving a different activation pathway than the production of autoantibodies. Furthermore, these mice still presented with anemia, but responded with a striking increase in extramedullary hematopoiesis (EMH), possibly due to the absence of pro-inflammatory cytokines.
Keywords: Atg5 KO, autoimmunity, B cells, inflammation, lupus, TLR7
Abbreviations
- Ab
antibody
- ANA
anti-nuclear Ab
- B6
C57BL/6J
- BM
bone marrow
- BMD
BM derived
- BMDM
BMD macrophages
- BMDmDCs
BMD myeloid dendritic cells
- BMDpDCs
BMD plasmacytoid dendritic cells
- DC
dendritic cell
- ds
double stranded
- ELISA
enzyme-linked immunosorbent assay
- ELISpot
enzyme-linked immunospot assay
- EMH
extramedullary hematopoiesis
- FOB
follicular B cells
- CSF2
colony stimulating factor 2 (granulocyte-macrophage)
- CFS3
colony stimulating factor 3 (granulocyte)
- GMP
granulocyte-macrophage progenitor
- H&E
hematoxylin and eosin stain
- IFN
interferon
- Irf7
interferon regulatory factor 7
- IHC
immunohistochemistry
- IL
interleukin
- KO
knockout
- LAP
LC3-associated phagocytosis
- LPS
lipopolysaccharide
- mDC
myeloid DC
- MZB
marginal zone B cells
- MZP
marginal zone precursor B cells
- NEAA
nonessential amino acids
- O/N
overnight
- PAS
periodic acid-Schiff
- PC
phosphocholine
- PCV
packed cell volume
- pDC
plasmacytoid DC
- PEMs
peritoneal macrophages
- RBC
red blood cell
- RT
room temperature
- SLE
systemic lupus erythematosus
- ss
single stranded
- T1B
transitional 1 B cells
- Tg
transgenic
- TLR
toll-like receptor
- WT
wild type
- YAA
Y-linked autoimmune accelerator
Introduction
Autoimmune disease occurs upon breakdown of self-tolerance, when the immune system is unable to distinguish self from nonself and consequently an immune response is mounted against the body's own cells and tissues. This disease encompasses more than 80 disorders that either affect a specific organ, such as in multiple sclerosis, or have a broader range over multiple organ systems, such as in systemic lupus erythematosus (SLE).1 SLE has strong genetic components, based on the concordance rates of monozygotic (24%) vs. dizygotic (2%) twins.2,3 Thus far, numerous SLE-susceptibility genes have been identified with the use of genome-wide association studies.4-6 Many of these robustly associated genes involve the innate immune system, e.g., type 1 interferon (IFN) production and toll-like receptor (TLR) signaling.7-11
TLRs are types of innate immune receptors that act as a critical line of defense against invading microbes. They recognize pathogen-associated molecular patterns and mount inflammatory responses that directly combat pathogen invasion, while also priming the adaptive immune system. Tight regulation of these signaling pathways is crucial for preventing a hyperactive cellular phenotype that can result in autoimmunity. In particular, nucleic acid-sensing TLRs 3, 7, and 9, which recognize double-stranded (ds) RNA, single-stranded (ss) RNA and dsDNA, respectively, are compartmentalized to the endosomes, thereby restricting the recognition of self nucleic acids. In addition, the trafficking of these TLRs from the endoplasmic reticulum to their destination in acidic endosomes is tightly controlled.12-14
The use of mouse model systems has provided functional evidence to complement human genome wide association studies, showing that nucleic acid-sensing TLRs, especially TLR7, can play a direct role in the induction of SLE. Both dysregulation of TLR trafficking to endosomes, favoring TLR7 transport over TLR9,14 and Tlr7 gene overexpression are sufficient for the development of SLE. The spontaneous mutant mouse Y-linked autoimmune accelerator (YAA) is susceptible to lupus nephritis due to the duplication of Tlr7.15,16 In Tlr7 transgenic (Tg) mouse strains, a dose-dependent increase in Tlr7 expression correlates with a progressively severe lupus-like disease phenotype in nonautoimmune prone mouse strains. Moderately increased Tlr7 gene dosage recapitulates the YAA phenotype, whereas high Tlr7 gene dosage results in a rapid and severe disease.17 In particular, the Tlr7.1 Tg strain, which has an 8–16 fold copy number increase in Tlr7 mRNA compared to wild-type (WT) mice, possesses many characteristics of human lupus, including ANA, chronic inflammation, and glomerular nephritis.17,18 The use of this well-defined model provides an excellent means to elucidate mechanisms of SLE progression and facilitate the search for therapeutics.
We hypothesized that autophagosomes in B cells enable initiation of SLE by facilitating delivery of autoantigen, i.e., cytosolic RNA from endogenous retroviral elements19 and internalized RNA immune complexes, to TLR7 in the endosomes. This prediction is based on observations made in dendritic cells (DCs) that macroautophagy delivers viral transcripts to TLR7 during infection.20,21 In the case of Tlr7 overexpression, this signal would lead to general B cell activation, facilitating stimulation of autoreactive B cells. Macroautophagy (referred to as autophagy in this paper) is a multiprotein process in which cellular contents are sequestered in a double membrane-bound vesicle, known as the autophagosome. These vesicles fuse with lysosomes to create autolysosomes in which the cellular contents are broken down. Mice lacking functional autophagic machinery die within the first day of life,22 emphasizing the overall importance of autophagy. In the immune system autophagy affects T cell proliferation and survival,23 as well as development and maintenance of the B1a subset of B cells.24,25 More recently, it has been shown that autophagy is important for plasma cell differentiation in mice and humans25,26 and the survival of long-lived plasma cells in the bone marrow (BM).27 Given the role of autophagy in innate and adaptive immunity, modulators of autophagy have been implicated as potential therapeutics for the treatment of SLE.28,29 To further support this, it has been shown that both B and T cells from SLE patients exhibit high levels of autophagy, which correlates with disease activity.26
In this paper we have tested our hypothesis by comparing SLE disease progression in Tlr7.1 Tg mice with or without functional autophagy. We show that B cell autophagy is essential for induction of SLE symptoms in this model system, providing credence for our postulate.
Results
B cell autophagy is required for SLE induction in Tlr7.1 Tg mice
To study the role of autophagy in TLR7-mediated autoimmunity, we generated cohorts of WT and Tlr7.1 Tg mice with either intact or B cell-specific loss of autophagy (Cd19-Cre Atg5f/f, referred to as Atg5 knockout [KO])24 (Table 1). For the majority of parameters tested in this paper Atg5 KO mice were indistinguishable from WT mice and were accordingly grouped as controls. Our model mice, Tlr7.1 Tg Atg5 KO, had a strikingly different phenotype from that of Tlr7.1 Tg mice with functional autophagy; namely, these mice showed a significant increase in survival, with 55% living beyond one y, compared to a median survival of only 25 wk for Tlr7.1 Tg mice (Fig. 1A). Importantly, the Tlr7.1 Tg Atg5 KO mice lacked IgG antinuclear autoantibodies (Abs) (ANA), as revealed by staining of HEP-2 slides (Fig. 1B, right panel; Fig. S1A; Table S1). In contrast, sera from Tlr7.1 Tg mice produced a strong nucleolar pattern of ANA staining, indicating the presence of anti-RNA Abs (Fig. 1B, middle panel), as previously described.17,18 In addition, the Tlr7.1 Tg Atg5 KO mice maintained normal serum IgG (Fig. 1C; Fig. S1B). Furthermore, their kidneys had lower lesion severity scores for glomerulonephritis (Fig. 1D, right panel, see Table S1 for summary of kidney pathology), as well as significantly reduced IgG1 and IgG2b deposits (Fig. 1E, right panel). In agreement with these data, both the kidneys and livers of these mice showed a reduction in perivascular mononuclear cell infiltrates (Fig. 1F, upper and lower far right panels), compared to Tlr7.1 Tg mice (Fig. 1F, middle panels). These data clearly demonstrate that B cell autophagy is required for induction of SLE in Tlr7.1 Tg mice, as we had predicted.
Table 1.
Breeding strategy and genotypes produced to test the role of B cell autophagy on TLR7-mediated SLE
| Tlr7.1 Tg : Atg5f/+ ♂ × Cd19-cre+/+ : Atg5f/f ♀ | ||
|---|---|---|
| Genotype | Group | |
| Cd19-cre+/− : Atg5f/+ | WT | Controls |
| Cd19-cre+/− : Atg5f/f | Atg5 KO | Ref. 24 |
| Tlr7.1 Tg : Cd19-cre+/− : Atg5f/+ | Tlr7.1 Tg | Ref. 27 |
| Tlr7.1 Tg : Cd19-cre+/− : Atg5f/f | Tlr7.1 Tg Atg5 KO | |
Figure 1.

B cell autophagy is required for SLE induction in Tlr7.1 Tg mice. (A) Tlr7.1 Tg Ag5 KO mice live significantly longer than Tlr7.1 Tg littermates with functional autophagy. Survival curves of mice measured over 57 wk. Tlr7.1 Tg Ag5 KO (n = 11), Tlr7.1 Tg (n = 10). *, p <0.05, Mantel-Cox test. (B) Detection of ANA using HEP-2 slides. Sera were tested for IgG-ANA. Data are representative (mice 5 mo, n = 8 per genotype). (C) Total serum IgG was determined by ELISA. Results are based on at least 6 mice per group. (D) Representative image of PAS staining of glomeruli, revealing severity of lesions (40x). (E) IgG deposits detected by IHC (upper panels). FITC anti-IgG1 (green), RITC anti-IgG2b (red). A = Control, B = Tlr7.1 Tg, C = Tlr7.1 Tg Atg5 KO, Bar: 20μm. Lower panels = phase contrast pictures. (F) Representative H&E images of kidney (upper panels), and liver (lower panels), showing mononuclear cell infiltrates (10X). Controls (n = 7), Tlr7.1 Tg (n = 8), and Tlr7.1 Tg Ag5 KO (n = 8). Mice were nonmoribund and between 3–5 mo old. White bar: 200 µm. **, p < 0.01; ***, p < 0.005, Kruskal-Wallis test with Dunn's post-test.
Lack of B cell autophagy moderates the production of inflammatory cytokines in Tlr7.1 Tg mice
A hallmark of SLE is chronic inflammation, with a signature pro-inflammatory cytokine response centered on the IFNA (interferon, α) family.30,31 Because Tlr7.1 Tg Atg5 KO mice lacked disease criteria for SLE, we hypothesized that B cell autophagy might also be required for initiating the production of inflammatory cytokines by other cell types. Increased TNF (tumor necrosis factor) serum levels had been previously reported in moribund Tlr7.1 Tg mice.17 We expanded these data by testing our cohort of mice at a nonmoribund state, using a highly sensitive multiplex immunoassay for the signature pro-inflammatory interleukins (ILs), and other cytokines observed in human lupus, in addition to cytokines indicative of T cell activation and myeloid cell production and recruitment. As can be seen in Fig. 2A and B, IFNA, IFNG (interferon, gamma), IL12B subunit p70, IL5, and CSF2 (colony stimulating factor 2 [granulocyte-macrophage]), as well as CFS3 (colony stimulating factor 3 [granulocyte]), were significantly elevated in Tlr7.1 Tg mice. Remarkably, however, none of these pro-inflammatory cytokines, produced mainly by macrophages and DCs, were significantly different in Tlr7.1 Tg Atg5 KO compared to control mice (Figs. 2A, B). Similarly, Tlr7.1 Tg Atg5 KO mice had normal levels of the T cell cytokines IL2, IL4, and IL13, in contrast to Tlr7.1 Tg mice, where these cytokines were increased (Fig. S2A). Conversely, both Tlr7.1 Tg and Tlr7.1 Tg Atg5 KO mice had elevated levels of the prototype anti-inflammatory cytokine IL10 (Fig. 2C), along with IL6 and, sporadically, TNF (Fig. 2D). There was no significant difference in IL18, IL1B, IL1A, or IL17A in any of the groups (Fig. S2B; data not shown). Overall, these data confirm and expand our conclusion that autophagy in B cells is essential for initiating lupus, as it is a prerequisite for the production of proinflammatory cytokines by other cell types that have intact autophagy.
Figure 2.

Lack of B cell autophagy moderates the production of inflammatory cytokines in Tlr7.1 Tg mice. Sera from nonmoribund mice between 3–5 mo old were tested for cytokines using multiplex immunoassay. Pro-inflammatory cytokines were elevated in Tlr7.1 Tg mice. (A) IFNA, IFNG, IL12 p70 subunit, and IL5. (B) CSF3, CSF2. (C) IL6 and anti-inflammatory IL10 were elevated in both Tlr7.1 Tg and Tlr7.1 Tg Atg5 KO mice. (D) TNF was elevated sporadically in both Tlr7.1 Tg and Tlr7.1 Tg Atg5 KO mice. Results are based on at least 10 mice per group. #, p < 0.05, Kruskal-Wallis test; *, p < 0.05; **, p < 0.01; ***, p < 0.005, Kruskal-Wallis with Dunn's post-test.
Macrophages and DCs from Tlr7.1 Tg Atg5 KO mice make normal inflammatory responses to TLR agonists
To confirm that the macrophages and DCs from Tlr7.1 Tg Atg5 KO mice were capable of mounting inflammatory responses, we stimulated these cells in vitro with a panel of TLR agonists and measured their cytokine production by enzyme-linked immunosorbent assay (ELISA) and qRT-PCR, respectively. As can be seen from the ELISA data presented in Fig. 3A, peritoneal macrophages (PEMs) had similar TNF and IL6 production in response to CL097 and lipopolysaccharide (LPS), TLR7 and TLR4 agonists, respectively. These cells also secreted comparable levels of IFNB1 (interferon, β 1, fibroblast) in response to LPS (Fig. 3B). Likewise, BM-derived macrophages (BMDMs) responded similarly to CL097, LPS, and CpG 2395, a TLR9 agonist (Fig. 3C).
Figure 3.

Macrophages and DCs from Tlr7.1 Tg Atg5 KO mice make normal inflammatory responses when stimulated in vitro. PEMs were activated with LPS (100 ng/ml), or CLO97 (5 µg/ml) for 6 h (A) IL6, TNF and (B) IFNB1 was measured by ELISA. BMDMs were activated with LPS (100 ng/ml), CLO97 (5 µg/ml), or CpG 2395 (250 nM) for 24 h. (C) TNF and IFNB1 were measured by ELISA. Significance is in comparison to unstimulated controls. BMDmDCs and BMDpDCs were stimulated with LPS (10 µg/ml), or CLO97 (1 µg/ml) (D) Il12b and (E) Irf7 mRNA transcripts were measured by qRT-PCR and compared to unstimulated cells using the ΔΔ CT method. Results are based on 3 mice per group. #, p < 0.05, one-way ANOVA; *, p < 0.05; **, p < 0.01; ***, p < 0.005, one-way ANOVA with Tukey's post-test.
Furthermore, BMD myeloid (m) and plasmacytoid (p) DCs from Tlr7.1 Tg Atg5 KO mice showed normal production of TNF (Fig. S3A), as well as a similar upregulation of Il12b transcripts (Fig. 3D; Fig. S3B), when stimulated with a panel of TLR agonists. To determine if type 1 IFN signaling was intact in Tlr7.1 Tg Atg5 KO mice, we compared the expression of interferon regulatory factor 7 (Irf7), a transcription factor that is phosphorylated and upregulated through a positive feedback loop upon TLR activation.32 As can be seen in Fig. 3E (upper right panel), expression of Irf7 was significantly increased in Tlr7.1 Tg Atg5 KO BMDpDCs. Thus, these cells do not have an intrinsic defect in the activation of TLR7 and the production of inflammatory cytokines. Rather, in the Tlr7.1 Tg Atg5 KO mice, they are not activated in vivo, because the initial signal from B cells is lacking. These data strongly imply that B cells are the initiators of inflammation in Tlr7.1 Tg mice, as has been proposed previously.18
B cell autophagy is required for the TLR7-mediated loss of the marginal zone
Another important indicator of disease in Tlr7.1 Tg mice is loss of B cells in the marginal zone (MZB) and a concomitant increase in follicular B (FOB) cells, a phenotype that is reproduced in WT mice immunized with TLR7 agonists.17,33,34 Although the factors responsible for these changes in B cell localization and their contribution to disease pathogenesis are not well understood, it is known that they are dependent on type 1 IFN.35 Since we have shown that IFN production is reduced in Tlr7.1 Tg Atg5 KO mice, we predicted that their MZ should be restored. As can be seen in Fig. 4A and B, these mice had normal numbers of MZB cells. This was not due to increased production of these cells, as evidenced by normal numbers of MZ precursor (MZP) B cells (Fig. 4A and C). Similarly, transitional 1 B (T1B) cells were not elevated in these mice (Fig. 4A and D). On the other hand, they had decreased percentages of FOB cells, while their absolute numbers were unchanged (Fig. 4A and E). To determine if the MZB cells in Tlr7.1 Tg Atg5 KO mice were localized in the outer rim of the splenic follicle as in WT mice, we examined frozen spleen sections by immunohistochemistry (IHC). IgM+ B cells were present adjacent to MZ macrophages in Tlr7.1 Tg Atg5 KO (Fig. 4F, right panel, closed arrows) and control (left panel) mice, while MZB cells were virtually absent in Tlr7.1 Tg mice (Fig. 4F, middle panel), confirming published findings.17 These data imply that autophagy is required for the TLR7-dependent activation of MZB cells that promotes their large-scale exit from the MZ to the red pulp.
Figure 4.

B cell autophagy is required for the TLR7-mediated loss of the marginal zone. (A) Representative FACS plots of controls (upper), Tlr7.1 Tg (middle), and Tlr7.1 Tg Atg5 KO (lower) mice, showing the gating for FOB, MZB, and MZP cells (left), as well as T1B cells (right). (B) Percentages (left) and absolute numbers (right) of MZB cells (PTPRC+ CR2mid CD23-). (C) Absolute numbers of MZP cells (PTPRC+ CR2hi CD23hi). (D) T1B cells (PTPRC+ CR2− CD23− CD24+ IgM+). (E) Percentages (left) and absolute numbers (right) of FOB cells (PTPRC+ CR2mid CD23mid). Each point represents an individual animal. Data were obtained from 5 independent experiments. Mice were nonmoribund and between 3–5 months old (*, p < 0.05; **, p < 0.01, Kruskal-Wallis test with Dunn's post-test). (F) Fluorescent IHC of frozen spleen sections. B cells (IgM red), T cell zone (CD4/CD8 green), MZ macrophages (MOMA-1 blue). IgM+ (red) MZB cells are intermixed with (blue) MZ macrophages (white arrows). IgMhi cells (bright red) are visible in the red pulp (open arrows) of Tlr7.1 Tg and Tlr7.1 Tg Atg5 KO mice. White bar: 100 µm.
TLR7.1 Tg Atg5 KO mice secrete hyper-IgM
It has been reported that Atg5 KO mice, immunized with conventional protein antigen, have decreased IgM and IgG plasmablasts.25,26 However, we found that on a Tlr7.1 Tg background these mice had vastly increased levels of IgMhi plasmablasts in the red pulp of the spleen, similar to Tlr7.1 Tg mice (Fig. 4F, middle and right panels, open arrows). These data were confirmed by flow cytometry (Fig. 5A), as well as by enzyme-linked immunospot (ELISpot) assay. As can be seen in Fig. 5B, Tlr7.1 Tg Atg5 KO mice had significantly higher numbers of IgM-secreting plasmablasts than Atg5 KO and Tlr7.1 Tg mice. A selective accumulation of unrecombined Atg5 plasma cells has been reported in the bone marrow of Atg5 KO mice following immunization.27 To determine if the increase in IgM plasmablasts was a result of selective pressure, we compared Atg5 recombination in the DNA of splenic B cells and plasmablasts measured by qPCR. No increase in unrecombined Atg5 was detected in the plasmablasts of Tlr7.1 Tg Atg5 KO mice (Fig. 5C). Thus, our data imply that the presence of the Tlr7 transgene rescues Atg5 KO B cells from death during differentiation into plasma cells. No difference in IgM mean spot size was seen by ELISpot between Tlr7.1 Tg Atg5 KO and Tlr7.1 Tg mice (Fig. S4A), indicating similar secretion rates by the plasmablasts of the 2 strains. Consistent with these observations, the serum IgM levels of Tlr7.1 Tg Atg5 KO mice were significantly increased compared to WT mice, similar toTlr7.1 Tg mice (Fig. 5D), whereas no difference in IgA or IgG3 levels was seen (Fig. S4B).
Figure 5.
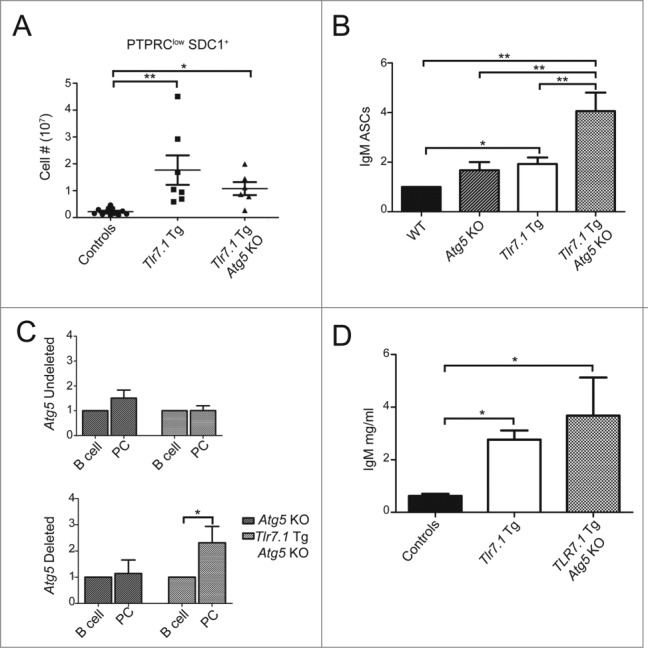
Tlr7.1 Tg Atg5 KO mice have hyper-IgM levels. (A) Absolute numbers of PTPRClow SDC1+ plasma cells in the spleen were determined by FACS. (B) ELISpot of isolated splenic B cells secreting IgM. Ab-secreting cell numbers are shown relative to controls. *, p<0.05, one sample t test; **, p < 0.01, Kruskal-Wallis test with Dunn's post-test. (C) qPCR for recombined and unrecombined Atg5 was performed on isolated splenic pan-B cells and SDC1+ cells. Results are based on 4 mice per genotype. (D) Sera from age-matched nonmoribund mice between 3–5 mo old were tested for total IgM by ELISA. *, p < 0.05; **, p < 0.01; ***, p < 0.005, Kruskal-Wallis test with Dunn's post-test).
B cells do not make IgM autoAbs, but respond normally to TLR signals in vitro
Because Tlr7.1 Tg Atg5 KO mice produced hyper-IgM serum levels, it was important to determine the level of anti-RNA IgM. As presented in Fig. 6A, anti-RNA-specific IgM ELISA revealed a low concentration of these autoAbs in the serum of Tlr7.1 Tg Atg5 KO mice as in WT controls, although the former had 3- to 5-fold higher total IgM. In contrast, sera from Tlr7.1 Tg mice showed a significant increase in anti-RNA IgM compared to the control mice. Taken together with the ANA analyses described above (Fig. 1B), these data unambiguously show that autoAbs against nuclear antigens are not produced in the absence of B cell autophagy.
Figure 6.
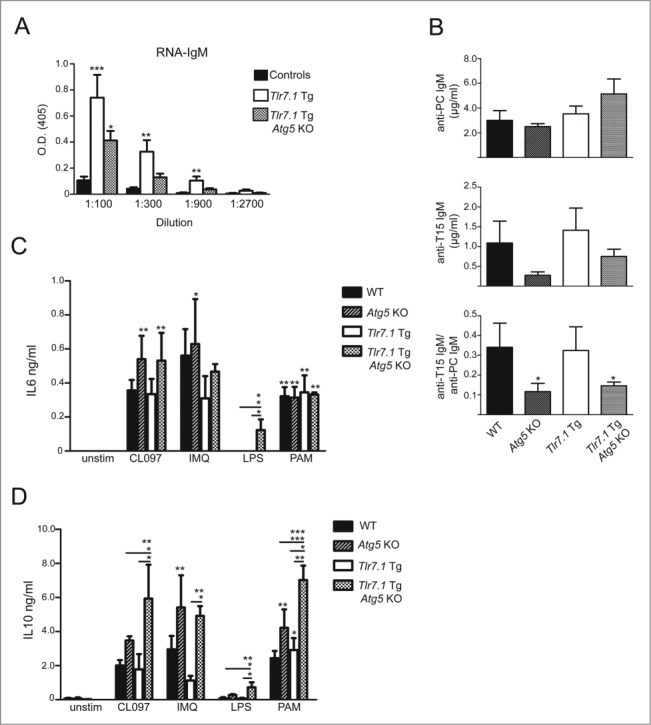
B cells do not make IgM autoAbs, but respond normally to TLR signals in vitro. (A) Anti-RNA IgM ELISA; results are based on at least 5 mice per genotype. *, p < 0.05; **, p < 0.01; ***, p < 0.005, Kruskal-Wallis test with Dunn's post-test. (B) ELISA for anti-PC IgM (top), anti-T15 IgM (middle), and the ratio of T-15 to PC IgM (bottom). Isolated B cells were stimulated for 72 h with CLO97 (1 µg/ml), imiquimod (IMQ; 1 µg/ml), LPS (10 µg/ml), or PAM3CSK4 (1 µg/ml). Cytokine readouts for (C) IL6 and (D) IL10 were determined by ELISA. Results are based on 3 mice per genotype. Unless indicated, significance was determined relative to unstimulated controls (*, p < 0.05; **, p < 0.01; ***, p < 0.005, One-way ANOVA with Tukey's post-test).
The substantial IgM response in the Tlr7.1 Tg Atg5 KO mice was particularly surprising, because a large fraction of serum IgM is produced by B1a cells, a B cell subset that has been reported to be deficient in Atg5 KO mice.24,25 We show here that these cells were also low in Tlr7.1 Tg Atg5 KO mice (Fig. 5A). To define the hyper-IgM response of these mice in more detail, we measured the antiphosphocholine (PC) Ab levels, bearing the T15 idiotype, a prototype germline IgM secreted by B1a cells.36 As can be seen in Fig. 6B, mice lacking B cell autophagy had normal levels of anti-PC IgM, but significantly reduced T15+ Abs, resulting in lower ratios of the T15 over the total anti-PC response, which is consistent with their lower level of B1a cells.
As a final analysis, we compared the level of IL6 and IL10 production of B cells from Tlr7.1 Tg Atg5 KO and Tlr7.1 Tg mice in vitro in response to TLR signals. As can be seen from the ELISA data presented in Fig. 6C, no defect in responsiveness was seen in the production of IL6 from B cells of Tlr7.1 Tg Atg5 KO mice. Similarly, these B cells were able to produce IL10 in response to stimulation (Fig. 6D, Fig. S5B). In fact, B cells from Tlr7.1 Tg Atg5 KO mice showed a significant increase in IL10 production compared to Tlr7.1 Tg B cells stimulated similarly. Thus, the defect in the former cells is seen only in vivo, confirming our working hypothesis that delivery of TLR7 ligands requires intact autophagy machinery.
Tlr7.1 Tg Atg5 KO mice present with anemia, but compensate through development of EMH
It has been reported that Tlr7.1 Tg mice have anemia,17 and it is known that type 1 and 2 IFNs, as well as TNF, play causative roles in autoimmune-mediated hemolytic anemia and inhibition of erythropoiesis.37-39 Since Tlr7.1 Tg Atg5 KO mice do not mount an inflammatory response, we would expect them to be cured of anemia. However, as can be seen in Fig. 7A, Tlr7.1 Tg mice had anti-erythrocyte (red blood cell, RBC) autoAbs (Fig. 7A) and developed anemia in the presence or absence of B cell autophagy (Fig. 7B). We also established that the BM of Tlr7.1 Tg Atg5 KO mice contained normal numbers of megakaryoctyes and erythroid precursors, suggesting that anemia was not caused by a deficiency in production of these cell types (Fig. 7C and D). Furthermore, flow cytometry analysis revealed normal numbers of BM monocytes and macrophages (Fig. 7D, right panel). This is in contrast to what had been described in Tlr7.1 Tg mice, which have IFNA-dependent expansion of BM granulocyte-macrophage progenitors (GMPs).
Figure 7.

Tlr7.1 Tg Atg5 KO mice present with anemia, but compensate through development of EMH. (A) Indirect Coomb's assay for IgM; the presence or absence of agglutination was determined. (B) RBC percentages shown by PCV (packed cell volume). (C) Representative H&E images of megakaryocytes in the BM of control (top panel), Tlr7.1 Tg (center panel) and Tlr7.1 Tg Atg5 KO mice (bottom panel), all 3–5 mo old. White bar: 100 µm. (D) Flow cytometry showing percentages of BM erythroid lineage cells (LY76+ ITGAM-) and macrophages/monocytes (ITGAM+ ITGAX- LY6Glow/−). (E) Spleens were weighed and normalized as a percentage of body weight. Each point is representative of an individual animal. Results are based on at least 6 mice per group. *, p < 0.05; **, p < 0.01; ***, p < 0.005, Kruskal-Wallis test with Dunn's post-test.
Because the Tlr7.1 Tg Atg5 KO mice presented with early signs of anemia similar to the Tlr7.1 Tg mice, but differed from those mice in the cellular composition of BM, as well as overall survival, we looked for compensatory mechanisms in organs other than the BM. We had observed that Tlr7.1 Tg Atg5 KO mice presented with splenomegaly as Tlr7.1 Tg littermates (Fig. 7E). Histological analysis of the spleens revealed that Tlr7.1 Tg Atg5 KO mice had a marked expansion of the red pulp (Fig. 8A, right panel) that was more pronounced than in Tlr7.1 Tg (Fig. 8A, center panel) and control mice (Fig. 8A, left panel). Within the red pulp of Tlr7.1 Tg Atg5 KO mice, increased erythropoiesis was present (Fig. 8B), as well as an increase in megakaryocytes (megakaryocyte hyperplasia) (Fig. 8C). Spleen sections of Tlr7.1 Tg Atg5 KO mice had more megakaryocytes (5–11/400x field) than Tlr7.1 Tg mice (1–10/400x field). In addition to the spleen, Tlr7.1 Tg Atg5 KO mice had increased EMH in the liver (Fig. 8D).
Figure 8.
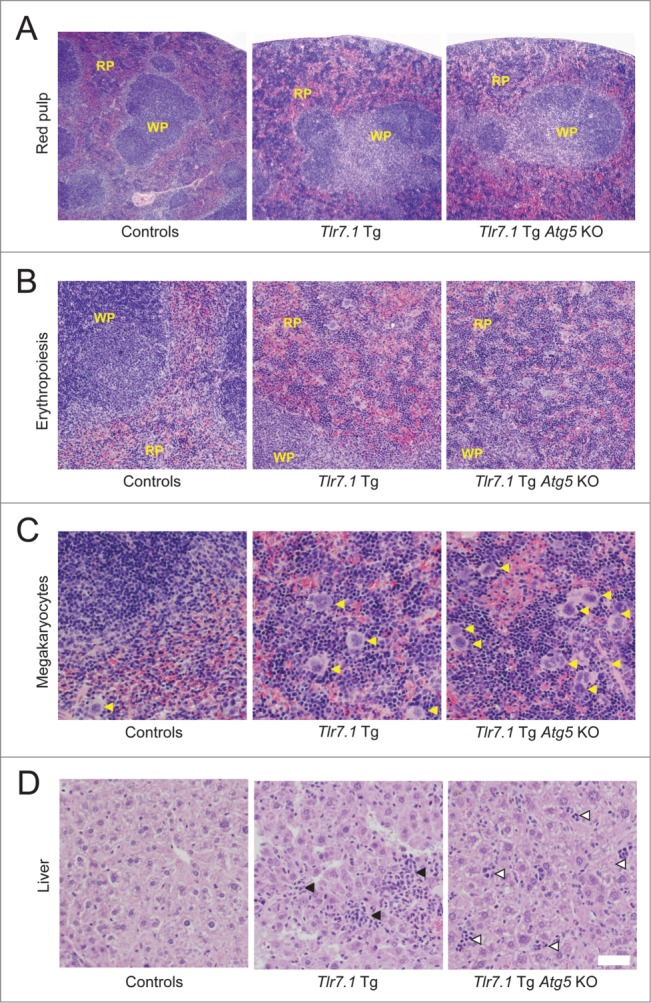
Tlr7.1 Tg Atg5 KO mice possess robust EMH in the spleen and liver. Representative H&E analyses of spleen (A-C) and liver (D) sections reveal elevated EMH in Tlr7.1 Tg and Tlr7.1 Tg Atg5 KO mice. Control (left panel), Tlr7.1 Tg (center panel) and Tlr7.1 Tg Atg5 KO (right panel), all 3–5 mo old. (A) Red pulp expansion (4X). (B) Increased numbers of immature red blood cells (erythropoiesis) (10X); (WP, white pulp; RP, red pulp). (C) Increased numbers of megakaryocytes (yellow arrows) (20X). (D) Cellular infiltrates (black arrows) in the liver of Tlr7.1 Tg mice vs. EMH foci (open arrows) in the liver of Tlr7.1 Tg Atg5 KO mice. Results are based on at least 6 mice per group. White bar: 100 µm.
Taken together, these data demonstrate that while Tlr7.1 Tg Atg5 KO mice still have anemia comparable to Tlr7.1 Tg mice, they compensate for it more effectively through increased EMH. The persistence of anemic disease in these mice is interesting, because it suggests that autophagy is important for the formation of anti-nuclear autoAbs, but is dispensable for the production of Abs against platelets and RBCs.
Discussion
The data presented in this paper demonstrate that B cell autophagy is required for the development of TLR7-mediated SLE; namely, we observed that the hallmarks of lupus, ANA, and chronic inflammation, did not develop in the absence of B cell autophagy. As a consequence, glomerulonephritis was ameliorated, and overall survival was dramatically improved. No IFNA signature was present in the serum of these mice, resulting in reduced tissue infiltration by inflammatory cells. Thus, for all intents and purposes, these mice were cured of SLE, providing validation for our working hypothesis.
Further evidence that the Tlr7.1 Tg Atg5 KO mice did not develop lupus is their restoration of MZB cells which are reduced in Tlr7.1 Tg mice. It has previously been shown that loss of MZB cells in Tlr7.1 Tg mice is dependent on type 1 IFN.35 This observation agrees well with our data that Tlr7.1 Tg Atg5 KO mice had decreased levels of this cytokine compared to Tlr7.1 Tg mice. Importantly, DCs, macrophages, and T cells, the highest producers of IFNs and other inflammatory cytokines, were not activated and were, thus, insufficient for disease initiation, although autophagy remained intact in these cell types. This is in agreement with the observation that DCs fail to expand or upregulate MHCII in Tlr7.1 Tg mice lacking B cells.18 The fact that loss of B cell autophagy results in restoration of the MZ, normal type 1 and 2 IFN levels, and an overall decrease in inflammatory cytokines in Tlr7.1 Tg mice implies that autophagosome action in B cells is essential for earliest stages of TLR7 activation in vivo and, thus, SLE inception and is required for subsequent recruitment of other cell types.
Based on the results obtained in our model mice, we propose that high levels of TLR7 in B cells leads to chronic stimulation by endogenous RNA, likely endogenous retroviral elements,19 by an autophagy-dependent mechanism. This would result in further amplification of Tlr7 expression and B cell activation. It has been reported that overexpression of RNase A in Tlr7.1 Tg mice does not mitigate anti-RNA autoAb production.40 These data suggest that endogenous RNA is the preeminent factor for TLR7 activation in the B cells of these mice. Furthermore, we observed that B cells in the blood of young Tlr7.1 Tg, but not Tlr7.1 Tg Atg5 KO mice, expressed the activation marker CD69 (Fig. S6). It is likely that this activation step is required for the preferential stimulation of autoreactive B cells, secreting autoAbs. Since these cells bear anti-RNA Ig, they deliver further ligand to TLR7 and, thus, receive additional signals, allowing them to differentiate into autoAb-secreting plasma cells.
It has recently been shown in macrophages that LC3-associated phagocytosis (LAP) is required for the delivery of large DNA immune complexes to TLR9.41 Although the presence of LAP has not been demonstrated in B cells so far, it is possible that this complex could mediate the delivery of RNA immune complexes to TLR7 as well. Since both autophagosome and LAP assembly require ATG5, our experimental system cannot formally discern which type of phagosome is responsible for the TLR7-mediated activation of autoreactive B cells.
Paradoxically, Tlr7.1 Tg Atg5 KO mice presented with very high levels of IgM-secreting plasma cells and corresponding serum IgM, even superseding those seen in Tlr7.1 Tg mice. This is particularly surprising, since a defect in plasmablast survival had been reported in Atg5 KO mice, immunized with protein antigens.25,27 Thus, it is possible that other factors, corollary to Tlr7 overexpression in the absence of B cell autophagy, such as increased apoptotic debris from dying cells, are responsible for the hyper-IgM seen in the serum of these mice. The exact mechanism leading to this phenomenon remains to be elucidated. However, the fact that these high levels of IgM did not contain anti-RNA autoAbs provides additional credibility of our working hypothesis that B cell autophagy is required for the production of ANA, resulting in autoimmunity.
Autophagy in DCs has been shown to be involved in presentation of exogenous antigen to CD4 T cells, leading to priming of these cells.20,21,23 However, soluble antigens, such as haptens, seem to be exempt of this requirement.27 This fits well with our observation that presentation of nuclear antigen is prevented in B cells from Tlr7.1 Tg Atg5 KO mice, as seen in the lack of anti-RNA autoAbs in these mice. On the other hand, these cells still receive ample signals in vivo, leading to their rescue from death and differentiation into plasmablasts, reflected in the high level of IgM-secreting cells.
Furthermore, Tlr7.1 Tg Atg5 KO mice developed anemia, similar to Tlr7.1 Tg mice.17 It has been shown that type 1 and 2 IFNs, as well as TNF, play causative roles in autoimmune-mediated hemolytic anemia and inhibition of erythropoiesis.37-39 However, these inflammatory cytokines were normal in Tlr7.1 Tg Atg5 KO mice. In contrast to the lack of antinuclear autoAbs in these mice, they had some anti-erythrocyte Abs. Thus, it is possible that erythrocyte-associated epitopes elicit a hemolytic Ab response that is not dependent on autophagy. Alternatively, the hemolytic anemia could be due to cross-reactive Abs associated with the already elevated circulating IgM in these mice. Ultimately, the cause of the pervasive hemolytic anemia, as well as the role of IgM in its initiation and progression, remain important unanswered questions, considering that anemia is one of the most common hematological malignancies associated with SLE and its etiology is poorly understood.
The lack of type 1 and 2 IFNs in Tlr7.1 Tg Atg5 KO mice suggests that these mice may be able to compensate for anemia more effectively than Tlr7.1 Tg mice. In agreement with this assumption, the spleens and the livers of these mice presented signs of a robust EMH response, such as an increase in megakaryocytes, the producers of thrombocytes, and erythrocyte precursors.
Studying the Tlr7.1 Tg Atg5 KO line provides new insights into effective treatment strategies of SLE, given that numerous SLE cases have been described with genetic predisposition to enhanced TLR7 signaling.7-11 Our data clearly indicate that at least one arm of the autoAb response, ANA, is completely dependent on autophagy. This is particularly important, because antinucleotide immune complexes are thought to be the main malefactor in lupus nephritis. Thus, targeted ablation of B cell autophagy could provide an effective treatment strategy for patients with SLE, according to the results described here. In addition it will be important to study whether disruption of autophagy in B cells ameliorates other autoimmune diseases associated with antinuclear Ab production, such as scleroderma and Sjögren syndrome.
Materials and Methods
Mice
All mice used in this study were on a C57BL/6J (B6) background and were analyzed at 3–5 mo old. B6 mice were purchased from The Jackson Laboratories (Bar Harbor, ME). Tlr7.1 Tg mice (C57BL/6-Tg(Tlr7)1Boll) were produced at NIH17 and were bred at Tufts University School of Medicine; Cd19-Cre/Atg5f/f mice (B6.129P2(C) - Cd19tm1(cre)Cgn Atg5tm1Myok) were provided by H. Virgin (Washington University, St. Louis, MO);24 at N9 backcross to B6, and were backcrossed to B6 an additional generation on site. WT and Tlr7.1 Tg mice were crossed with Cd19-Cre/Atg5f/f mice24 (see Table 1 for breeding strategy and genotypes of the various groups of mice). All animals were housed, bred, and studied at Tufts University School of Medicine under approved IACUC guidelines.
Flow cytometry
Single cell suspensions were made in 1X phosphate-buffered saline (PBS; 0.137 M NaCl, 2.7 mM KCl, 5.3 mM Na2HPO4, 1.8 mM KH2PO4) 2% fetal bovine serum (FBS; Atlanta Biologicals, S11550) from whole spleen using 70-µm nylon cell strainers (Falcon, 352350). Peritoneal cells were isolated by lavage (1X PBS, 2% FBS). BM cells were isolated by flushing femurs with 1X PBS (2% FBS). Whole blood was collected from tail veins or by cardiac puncture in BD Microtainer tubes with EDTA (BD Biosciences, 365973) and lysed with RBC lysis buffer (BD Biosciences, 4300–54). Cells were blocked for FCGR2B/CD32 (eBiosciences, 14-0161-85) and stained with the following mouse Abs from eBiosciences: IgM (48-5790-80), ITGAX/CD11c (48-0114-82), CD3 (48-003280), (eFluor 450), IGHM/IgM (11-5790-82), FCER2A/CD23 (11-0232-82), LY6G/GR1 (115931-82), CD4 (53-0041-80), (FITC), BST2/PDCA1 (46-3172-80), (PerCP-Cy5.5), KLRB1/Nk1.1 (12-5941-81) (PE), PTPRC (47-0452-82), ITGAM (47-0112-82), (eFluor 780), and BD Biosciences: LY76/TER119 (560512), CD69 (551113) (PerCP-Cy5.5), ITGAM/CD11b (01715B), CD24A (553262), SDC1/CD138 (553714), (PE), CD5 (55035), CR2/CD21 (558658), PTPRC/B220 (553092), CD8 (550281), (APC). Cells were analyzed using an LSRII, FACSDiva software (BD Biosciences). Secondary analysis was performed using FCS Express 4 Research Edition (De Novo Software).
Detection of autoAbs
HEP-2 slides (MBL Bion, AN-1012) were used to determine the presence of antinuclear IgG. Sera were diluted 1:80, and slides were treated per the manufacturer's recommendations. To identify autoreactive sera a secondary goat anti-mouse IgG FITC (Sigma, F8264) at 1:250 was used. Slides were read using a Nikon Eclipse 80i fluorescence microscope, and analyzed with NIS-Elements software (Nikon).
Multiplex immunoassay
Sera were analyzed for 17 cytokines: IL1A, IL1B, IL2, IL4, IL5, IL6, IL10, IL12 (p70), IL13, IL7A, IL18, TNF, CSF3, CSF2, CSF1, IFNA, and IFNG, using eBiosciences ProcartaPlex™ Multiplex Immunoassay, Mouse Th1/Th2 Cytokine Panel (11 plex) (EPX110-20820-901), IFNA Simplex (EPX010-26027), IL1A Simplex (EPX010-20611), IL10 Simplex (EPX010-20614), CSF3 Simplex (EPX010-26034), IL17A Simplex (EPX010-26001), and MCSF Simplex (EPX010-26039), per the manufacturer's specifications. All samples were diluted 1:1 and run in duplicate on a Luminex analyzer.
Cytokine ELISA
Cytokine levels of TNF (DY410), and IL6 (DY406), were determined using DuoSet ELISA Development Systems (R&D Systems) per the manufacturer's protocol. For myeloid cell stimulations supernatant fractions were diluted at 1:1 for TNF and were left undiluted for IL6. For IFNB1 ELISAs, plates were coated with 50 µl of rat anti-mouse IFNB1 mAb (Santa Cruz Biotechnology, sc-57201) at 1:500 in 0.1 M carbonate buffer and incubated overnight (O/N) at 4°C. Plates were blocked with IFNB1 blocking buffer (1X PBS, 10% FCS) for 2 h at 37°C. Standards were diluted 1:1 starting at 400 IU/ml (PBL, 12400-1) and samples, used undiluted, were added to the plate and incubated O/N at 4°C. Detection antibody, 50 µl of polyclonal rabbit anti-mouse IFNB1 (R&D Systems, 32400-1) was used at a 1:2000 dilution in IFNB1 blocking buffer, and incubated O/N at 4°C. Secondary antibody, goat anti-rabbit HRP (Cell Signaling Technology, 7074), was added at 1:2000 and incubated for 3 h at RT. For detection, 50 ul TMB Substrate (BD Biosciences, 555214) was added, and reactions were stopped with 50 ul 2 N H2SO4. For IL10 ELISAs, plates were coated with 3 µg/ml purified rat anti-mouse IL10 (BD Biosciences, 551215) in IL10 binding buffer (0.1 M NaHPO4, pH 9.0) and incubated O/N at 4°C. Plates were blocked with IL10 blocking buffer (1X PBS, 1% BSA [Sigma, A9647], 0.05% Tween 20 [Fisher Scientific, BP337]) for 2 h at room temperature (RT). Standards, diluted 1:2 starting at 20 ng/ml (BD Biosciences, 559076), and samples, undiluted, were added to the plate and incubated O/N at 4°C. Detection antibody, 3 µg/ml biotin rat anti-mouse IL10 (BD Biosciences, 554423) was used, and incubated 1 h at RT. Streptavidin-HRP (R&D Systems, 43-4323) was added at 1:40 and incubated for 30 min at RT. For detection, 50 µl TMB Substrate (BD Biosciences, 555214) was added and reactions were stopped with 50 µl 2 N H2SO4. For all cytokine ELISAs plates were read at 450 nm with SoftMax Pro using an EMax (Molecular Devices).
Immunoglobulin ELISA
Plates were coated with either 1 µg/ml unlabeled goat anti-mouse IgG (1030-01), IgM (1021-01), or IgA (1040-01), (Southern Biotechnology Associates). Blocking was performed with 1% BSA in borate buffer, pH 8.4. Sera were serially diluted and incubated at 4°C overnight. AP-conjugated goat anti-mouse IgG (1030-04), IgM (1021-04), IgA (1040-04), or IgG3 (1100-04) at 1 µg/ml were used (Southern Biotechnology Associates). Standard curves were prepared with purified mouse IgG, (Santa Cruz Biotechnology, sc-2025) IgM (0101-01), IgA (0106-01), or IgG3 (0105-01) (Southern Biotechnology Associates). For RNA-IgM ELISA, plates were coated with 5 mg/ml yeast RNA (Ambion, AM7120G). Blocking was performed with 5% goat serum (Sigma, 16210-072) in borate buffer, and AP-conjugated goat anti-mouse IgM (Southern Biotechnology Associates, 1021-04) was used. For development, 1 mg/ml phosphatase substrate was used (Sigma, S0942). Plates were read with SoftMax Pro using an EMax (Molecular Devices). Phosphocholine (PC)-specific IgM Ab levels were determined by ELISA using plates coated with PC-BSA (Biosearch Tech, PC-1011-10), and T15 idiotype levels were determined on ELISA plates coated with the monoclonal anti-idiotype Ab AB1-2 (Dr. J.F. Kearney, University of Alabama). Serum Ab in both assays was detected with alkaline phosphatase-conjugated goat anti-mouse IgM (Southern Biotechnology Associates,1021-04). Standard curves for both assays were prepared with known concentrations of purified T15 idiotype-bearing IgM (BH8; Dr. J.F. Kearney, University of Alabama). P-nitrophenyl phosphate was added, and color development was determined on a SPECTROstar Omega Reader (BMG Labtech) at 405 nm.
Histology
Tissue were fixed with 10% neutral buffered formalin (NBF; Sigma, HT501640) and embedded in paraffin; 5-µm sections were cut and stained with hematoxylin and eosin (H&E); 2-µm kidney sections were cut and stained with periodic acid-Schiff (PAS; Rowley Biochemical, SO-429). Femurs were fixed overnight in NBF, followed by decalcification in 5% formic acid prior to embedding for examination of bone marrow. The pathologist performed a masked evaluation of kidney sections for membrano-proliferative glomerulonephritis using the scoring system: score 1, none to focal areas of minimal segmental PAS-positive mesangial thickening; score 2, focal to generalized mild segmental PAS-positive mesangial thickening; score 3, generalized segmental to diffuse moderate to severe PAS-positive mesangial thickening with increased glomerular cellularity; score 4, generalized diffuse severe PAS-positive mesangial thickening with increased glomerular cellularity, dilation of Bowman's space, attenuation of normally cuboidal parietal epithelium of Bowman's capsule in male mice, mild thickening of Bowman's capsule, and small numbers of tubules dilated with protein casts. Liver EMH was determined as either present or absent.
Immunofluorescence tissue section analysis
Kidneys and spleens were collected from mice and frozen in OCT (Tissue-Tek, 4583). Cryostat sections were fixed in acetone, frozen, and rehydrated. Kidney sections were stained with FITC goat anti-mouse IgG1 (1070-02), and RITC anti-mouse IgG2b (1090-03) (Southern Biotechnology Associates). Spleen sections were stained with Alexa Fluor 555 goat anti-Mouse IgM (Life Technologies, A-21426), rat anti-SIGLEC1/CD169 (MOMA-1; gift from Dr. G. Kraal, Vrije University Medical Center, Amsterdam), followed by Alexa Fluor 647 (recolored in a blue channel; Life Technologies, A-21247) and anti-rat IgG and biotinylated anti-CD4 (BD Biosciences, RM4-5) and anti-CD8 (BD Biosciences, 53–6.7) plus Alexa 488-Streptavidin. Coverslips were then mounted on slides with DAPI Fluoromount (Southern Biotechnology Associates, 0100-20) and analyzed using a Leitz DMRB fluorescent microscope.
ELISpot assay
Splenic B cells were isolated by magnetic separation via negative selection, using EasySep mouse B cell isolation kits (StemCell, 19854), per the manufacturer's protocol. Purified B cells were plated at 2.5 × 10⁵ cells per well in duplicate and diluted 3 times in 4-fold serial dilutions on multiscreen filter plates (Millipore, S2EM004M99) coated with 1 μg/ml unlabeled goat anti-mouse IgM (Southern Biotechnology Associates, 1021-01). Cells were cultured in RPMI supplemented with 10% FBS (complete RPMI). After 24 h incubation at 37°C (5% CO2), plates were washed and bound Ab was detected with AP-conjugated goat anti-mouse IgM (Southern Biotechnology Associates, 1021-04). Plates were developed with 1-Step NBT/BCIP (Thermo Scientific, 34042). Ab-secreting cells were scanned and enumerated using an Immunospot Analyzer (Cellular Technology Ltd).
qPCR and qRT-PCR analyses
For qPCR analysis of Atg5 recombination, splenic pan B cells were isolated from mice between 14–16 wk old, using negative selection EasySep pan-B cell isolation kits (StemCell, 19844), per the manufacturer's protocol. SDC1+ cells were then isolated from this population, using a PE-positive selection kit (StemCell, 18554) and PE-SDC1 Ab (BD Biosciences, 553714). For DNA isolation, 5 × 10⁵ cells were washed in 1X PBS, centrifuged at 2000 rpm for 5 min, and resuspended in 350 µl RLT buffer (Qiagen, 79216). DNA and RNA were extracted using All/Prep DNA/RNA mini kits (Qiagen, 80204). qPCR was performed on 25 ng genomic DNA using Power SYBR Green (Applied Biosystems, 4367659) in duplicate 20-µl reactions. Primer sequences used were previously described.27 Results were normalized to genomic Hspa5. RNA was isolated from 5 × 10⁵ BMDmDCs and BMDpDCs using RNeasy mini kits (Qiagen, 74104), and cDNA was produced using 250 ng random primers (Invitrogen, 48190-011) with SuperScript-II reverse transcriptase (Invitrogen, 18064-014) per the manufacturer's protocol. Samples were diluted 1:5, and PCR was performed in duplicate using Taqman gene expression assay systems (Applied Biosystems); Irf7 (Mm00516791_g1), and Il12b (Mm00434174_m1) were used with FAM reporters. Mouse Actb and Gapdh were used as housekeeping controls with a VIC-MGB reporter. Data were analyzed on a 7300 Real-time PCR system (Applied Biosystems).
Production of BMD macrophages, pDCs, and mDCs
BM cells were isolated by washing femurs with cold RPMI 1640. Cells were then centrifuged for 10 min at 1000 rpm (4°C). Cell pellets were resuspended in freezing medium (90% FBS, 10% DMSO) at 5 × 10⁶ cells/ml and were frozen overnight at −80°C. For BMD cell differentiation, BM cells were thawed and diluted in 10 ml 1X PBS (37°C). Cells were then centrifuged for 5 min at 1000 rpm and resuspended in the appropriate differentiation medium. To differentiate BMDMs, cells were plated at 2 × 10⁶ cells/10-cm plate in macrophage differentiation medium (RPMI 1640 with L-glutamine, 20% FBS, 28% L1 cell conditioned medium (provided by Dr. A. Poltorak [Tufts University]), and 1% penicillin/streptomycin). Cells were fed on the 4th d of culture by exchanging 5 ml for 10 ml of media. Cells were harvested after 8 d of culture. To differentiate BMDmDCs, cells were plated at 5 × 10⁶ cells/10-cm plate in mDC differentiation medium (RPMI 1640 with, 10% FBS, 2% L-glutamine, 1% nonessential amino acids [NEAA, Gibco, 11140–050], 1% sodium pyruvate, 1% HEPES, 0.1% β-ME (50 µM), 3.3% J558 cell CSF2-conditioned medium (provided by Dr. M.J. Stadecker [Tufts University]), and 1.6% penicillin/streptomycin) Cells were fed on the 3rd d with an additional 10 ml of medium, and on the 5th d by exchanging 10 ml of medium. Cells were harvested after 8 d of culture. To differentiate BMDpDCs, cells were plated at 2.5 × 10⁶ cells/T25 flask in FLT3-L (PeproTech, 300–19) supplemented complete medium (RPMI 1640 with, 10% FBS, 2% L-glutamine, 1% NEAA, 1% sodium pyruvate, 1% HEPES, 0.1% β-ME [50 µM], and 1.6% penicillin/streptomycin) FLT3-L was supplemented at 400 ng/ml for controls and 200 ng/ml for Tlr7.1 Tg mice and replenished on the 5th day of culture, and cells were harvested after 10 d. The concentration of FLT3-L used was determined empirically based on the concentration required to generate ≥87% ITGAXlow BST2+ cells determined by flow cytometry.
Stimulation of B cells, PEMs, BMD macrophages, pDCs, and mDCs
PEMs were isolated from mice 8–9 wk old by lavage (1X PBS, 4°C). Cells were resuspended in RPMI 1640 media with 10% FBS and 1% pen/strep, and were plated in duplicate in 96-well flat-bottomed plates (Corning, 353072) at 1 × 10⁵ cells/well. Following O/N incubation at 37°C and 5% CO2, cells were washed twice (1X PBS, 37°C) to remove nonadherant cells and stimulated for 6 h with CLO97 (5 µg/ml) (Invivogen, tlrl-c95), or LPS (100 ng/ml; Salmonella minnesota Re595 [Enzo Biochem, ALX-581-017-L002]). After harvesting BMDMs, BMDmDCs, and BMDpDCs were plated in duplicate in 12-well, flat-bottomed plates (Corning, 3512) at 2.5 × 10⁵ cells/well or in 96-well, flat-bottomed plates at 1 × 10⁵ cells/well. All cells were incubated O/N at 37°C and 5% CO2. Following incubation, cells were stimulated for 24 h with the following agents: BMDM: CLO97 (5 µg/ml), LPS (100 ng/ml), or CpG 2395 (250 nM) (IDT Custom Oligos); BMDmDC: CLO97 (5 µg/ml), LPS (10 µg/ml), or CpG 2395 (1 µM); BMDpDC: CLO97 (5 µg/ml) or LPS (10 µg/ml). Following stimulation supernatant fractions were harvested and frozen at −80°C. Cells were washed with 1X PBS and lysed in RLT buffer for use in later downstream analyses. Splenic B cells were isolated by magnetic separation via negative selection, using EasySep mouse B cell isolation kits (StemCell, 19854), per the manufacturer's protocol. Purified B cells were plated at 1 × 10⁶ cells per well in complete medium (RPMI 1640, supplemented with 10% FBS, 1 mM sodium pyruvate, 10 mM HEPES, 0.1 mM NEAA, 1% pen/strep, 1 μM β-ME). Cells were stimulated with CLO97 (1 µg/ml), imiquimod (1 µg/ml; Invivogen, tlrl-imqs), LPS (10 µg/ml), CpG 2395 (1 µM), PAM3CSK4 (1 µg/ml; Invivogen, tlrl-pms), or goat F(ab')2 anti-mouse IgM (5 µg/ml; Southern Biotechnology Associates, 1023-01) and cultured at 37°C, 5% CO2 for 72 h. Supernatant fractions from each well were frozen and used to assess the production of cytokines. Cells were then harvested and lysed in RLT buffer.
Statistical analysis
Graphs were generated using Prism (GraphPad). Significance for in vivo and ex vivo assays were determined by either Kruskal-Wallis' test followed by Dunn's multiple comparisons test, a 2-tailed Mann-Whitney U test, or a one-sample t-test, where appropriate. Significance for in vitro stimulations was determined by one-way ANOVA followed by Tukey's multiple comparisons test. Survival curves were analyzed using a Mantel-Cox (log-rank) test. Error bars represent SEM.
Disclosures of Potential Conflicts of Interest
No potential conflicts of interest were disclosed.
Acknowledgments
We are grateful to Skip Virgin for supplying the CD19-cre/Atg5f/f mice, and we would like to thank Michael Cancro and Bob Woodland for interesting discussions.
Funding
This work was supported in part by NIH CTSI UL1TR001064 (BTH), NIH AI14782-36 (JFK) and by the Division of Intramural Research, NIAID, NIH (SB).
Supplemental Material
Supplemental data for this article can be accessed on the publisher's website.
References
- 1.Tsokos GC. Systemic lupus erythematosus. N Engl J Med 2011; 365:2110-21; PMID:22129255; http://dx.doi.org/ 10.1056/NEJMra1100359 [DOI] [PubMed] [Google Scholar]
- 2.Ballestar E. Epigenetics lessons from twins: prospects for autoimmune disease. Clin Rev Allergy immunol 2010; 39:30-41; PMID:19653134; http://dx.doi.org/ 10.1007/s12016-009-8168-4 [DOI] [PubMed] [Google Scholar]
- 3.Deapen D, Escalante A, Weinrib L, Horwitz D, Bachman B, Roy-Burman P, Walker A, Mack TM. A revised estimate of twin concordance in systemic lupus erythematosus. Arthritis Rheum 1992; 35:311-8; PMID:1536669; http://dx.doi.org/ 10.1002/art.1780350310 [DOI] [PubMed] [Google Scholar]
- 4.Harley JB, Alarcon-Riquelme ME, Criswell LA, Jacob CO, Kimberly RP, Moser KL, Tsao BP, Vyse TJ, Langefeld CD, Nath SK, et al.. Genome-wide association scan in women with systemic lupus erythematosus identifies susceptibility variants in ITGAM, PXK, KIAA1542 and other loci. Nature Gen 2008; 40:204-10; http://dx.doi.org/ 10.1038/ng.81 [DOI] [PMC free article] [PubMed] [Google Scholar]
- 5.Lessard CJ, Ice JA, Adrianto I, Wiley GB, Kelly JA, Gaffney PM, Montgomery CG, Moser KL. The genomics of autoimmune disease in the era of genome-wide association studies and beyond. Autoimmunity Rev 2012; 11:267-75; http://dx.doi.org/ 10.1016/j.autrev.2011.10.003 [DOI] [PMC free article] [PubMed] [Google Scholar]
- 6.Cui Y, Sheng Y, Zhang X. Genetic susceptibility to SLE: recent progress from GWAS. J Autoimmunity 2013; 41:25-33; http://dx.doi.org/ 10.1016/j.jaut.2013.01.008 [DOI] [PubMed] [Google Scholar]
- 7.Garcia-Ortiz H, Velazquez-Cruz R, Espinosa-Rosales F, Jimenez-Morales S, Baca V, Orozco L. Association of TLR7 copy number variation with susceptibility to childhood-onset systemic lupus erythematosus in Mexican population. Ann Rheum Dis 2010; 69:1861-5; PMID:20525845; http://dx.doi.org/ 10.1136/ard.2009.124313 [DOI] [PubMed] [Google Scholar]
- 8.Shen N, Fu Q, Deng Y, Qian X, Zhao J, Kaufman KM, Wu YL, Yu CY, Tang Y, Chen JY, et al.. Sex-specific association of X-linked Toll-like receptor 7 (TLR7) with male systemic lupus erythematosus. Proc Natl Acad Sci USA 2010; 107:1583-43 [DOI] [PMC free article] [PubMed] [Google Scholar]
- 9.Kawasaki M, Fujishiro M, Yamaguchi A, Nozawa K, Kaneko H, Takasaki Y, Takamori K, Ogawa H, Sekigawa I. Possible role of the JAK/STAT pathways in the regulation of T cell-interferon related genes in systemic lupus erythematosus. Lupus 2011; 20:1231-9; PMID:21980035; http://dx.doi.org/ 10.1177/0961203311409963 [DOI] [PubMed] [Google Scholar]
- 10.Lee YH, Lee HS, Choi SJ, Ji JD, Song GG. Associations between TLR polymorphisms and systemic lupus erythematosus: a systematic review and meta-analysis. Clin Exp Rheumatol 2012; 30:262-5; PMID:22325161 [PubMed] [Google Scholar]
- 11.Tian J, Ma Y, Li J, Cen H, Wang DG, Feng CC, Li RJ, Leng RX, Pan HF, Ye DQ. The TLR7 7926A>G polymorphism is associated with susceptibility to systemic lupus erythematosus. Mol Med Rep 2012; 6:105-; PMID:22505023 [DOI] [PubMed] [Google Scholar]
- 12.Brinkmann MM, Spooner E, Hoebe K, Beutler B, Ploegh HL, Kim YM. The interaction between the ER membrane protein UNC93B and TLR3, 7, and 9 is crucial for TLR signaling. J Cell Biol 2007; 177:265-75; PMID:17452530; http://dx.doi.org/ 10.1083/jcb.200612056 [DOI] [PMC free article] [PubMed] [Google Scholar]
- 13.Kim YM, Brinkmann MM, Paquet ME, Ploegh HL. UNC93B1 delivers nucleotide-sensing toll-like receptors to endolysosomes. Nature 2008; 452:234-8; PMID:18305481; http://dx.doi.org/ 10.1038/nature06726 [DOI] [PubMed] [Google Scholar]
- 14.Fukui R, Saitoh S, Kanno A, Onji M, Shibata T, Ito A, Onji M, Matsumoto M, Akira S, Yoshida N, et al.. Unc93B1 restricts systemic lethal inflammation by orchestrating Toll-like receptor 7 and 9 trafficking. Immunity 2011; 35:69-81; PMID:21683627; http://dx.doi.org/ 10.1016/j.immuni.2011.05.010 [DOI] [PubMed] [Google Scholar]
- 15.Subramanian S, Tus K, Li QZ, Wang A, Tian XH, Zhou J, Liang C, Bartov G, McDaniel LD, Zhou XJ, et al.. A Tlr7 translocation accelerates systemic autoimmunity in murine lupus. Proc Natl Acad Sci USA 2006; 103:9970-5; PMID:16777955; http://dx.doi.org/ 10.1073/pnas.0603912103 [DOI] [PMC free article] [PubMed] [Google Scholar]
- 16.Pisitkun P, Deane JA, Difilippantonio MJ, Tarasenko T, Satterthwaite AB, Bolland S. Autoreactive B cell responses to RNA-related antigens due to TLR7 gene duplication. Science 2006; 312:1669-72; PMID:16709748; http://dx.doi.org/ 10.1126/science.1124978 [DOI] [PubMed] [Google Scholar]
- 17.Deane JA, Pisitkun P, Barrett RS, Feigenbaum L, Town T, Ward JM, Flavell RA, Bolland S. Control of toll-like receptor 7 expression is essential to restrict autoimmunity and dendritic cell proliferation. Immunity 2007; 27:801-10; PMID:17997333; http://dx.doi.org/ 10.1016/j.immuni.2007.09.009 [DOI] [PMC free article] [PubMed] [Google Scholar]
- 18.Walsh ER, Pisitkun P, Voynova E, Deane JA, Scott BL, Caspi RR, Bolland S. Dual signaling by innate and adaptive immune receptors is required for TLR7-induced B-cell-mediated autoimmunity. Proc Natl Acad Sci USA 2012; 109:16276-81; PMID:22988104; http://dx.doi.org/ 10.1073/pnas.1209372109 [DOI] [PMC free article] [PubMed] [Google Scholar]
- 19.Perl A, Fernandez D, Telarico T, Phillips PE. Endogenous retroviral pathogenesis in lupus. Curr Op Rheumatol 2010; 22:483-92; http://dx.doi.org/ 10.1097/BOR.0b013e32833c6297 [DOI] [PMC free article] [PubMed] [Google Scholar]
- 20.Lee HK, Lund JM, Ramanathan B, Mizushima N, Iwasaki A. Autophagy-dependent viral recognition by plasmacytoid dendritic cells. Science 2007; 315:1398-401; PMID:17272685; http://dx.doi.org/ 10.1126/science.1136880 [DOI] [PubMed] [Google Scholar]
- 21.Iwasaki A. Role of autophagy in innate viral recognition. Autophagy 2007; 3:354-6; PMID:17404496; http://dx.doi.org/ 10.4161/auto.4114 [DOI] [PubMed] [Google Scholar]
- 22.Kuma A, Hatano M, Matsui M, Yamamoto A, Nakaya H, Yoshimori T, Ohsumi Y, Tokuhisa T, Mizushima N. The role of autophagy during the early neonatal starvation period. Nature 2004; 432:1032-6; PMID:15525940; http://dx.doi.org/ 10.1038/nature03029 [DOI] [PubMed] [Google Scholar]
- 23.Pua HH, Dzhagalov I, Chuck M, Mizushima N, He YW. A critical role for the autophagy gene Atg5 in T cell survival and proliferation. J Exp Med 2007; 204:25-31; PMID:17190837; http://dx.doi.org/ 10.1084/jem.20061303 [DOI] [PMC free article] [PubMed] [Google Scholar]
- 24.Miller BC, Zhao Z, Stephenson LM, Cadwell K, Pua HH, Lee HK, Mizushima NN, Iwasaki A, He YW, Swat W, et al.. The autophagy gene ATG5 plays an essential role in B lymphocyte development. Autophagy 2008; 4:309-14; PMID:18188005; http://dx.doi.org/ 10.4161/auto.5474 [DOI] [PubMed] [Google Scholar]
- 25.Conway KL, Kuballa P, Khor B, Zhang M, Shi HN, Virgin HW, Xavier RJ. ATG5 regulates plasma cell differentiation. Autophagy 2013; 9:528-37; PMID:23327930; http://dx.doi.org/ 10.4161/auto.23484 [DOI] [PMC free article] [PubMed] [Google Scholar]
- 26.Clarke AJ, Ellinghaus U, Cortini A, Stranks A, Simon AK, Botto M, Vyse TJ. Autophagy is activated in systemic lupus erythematosus and required for plasmablast development. Ann Rheum Dis 2014; 74:912-20. [DOI] [PMC free article] [PubMed] [Google Scholar]
- 27.Pengo N, Scolari M, Oliva L, Milan E, Mainoldi F, Raimondi A, Fagioli C, Merlini A, Mariani E, Pasqualetto E, et al.. Plasma cells require autophagy for sustainable immunoglobulin production. Nature Immunol 2013; 14:298-305; http://dx.doi.org/ 10.1038/ni.2524 [DOI] [PubMed] [Google Scholar]
- 28.Pierdominici M, Vomero M, Barbati C, Colasanti T, Maselli A, Vacirca D, Giovannetti A, Malorni W, Ortona E. Role of autophagy in immunity and autoimmunity, with a special focus on systemic lupus erythematosus. FASEB J 2012; 26:1400-12; PMID:22247332; http://dx.doi.org/ 10.1096/fj.11-194175 [DOI] [PubMed] [Google Scholar]
- 29.Crispin JC, Liossis SN, Kis-Toth K, Lieberman LA, Kyttaris VC, Juang YT, Tsokos GC. Pathogenesis of human systemic lupus erythematosus: recent advances. Trends Mol Med 2010; 16:47-57; PMID:20138006; http://dx.doi.org/ 10.1016/j.molmed.2009.12.005 [DOI] [PMC free article] [PubMed] [Google Scholar]
- 30.Obermoser G, Pascual V. The interferon-alpha signature of systemic lupus erythematosus. Lupus 2010; 19:1012-9; PMID:20693194; http://dx.doi.org/ 10.1177/0961203310371161 [DOI] [PMC free article] [PubMed] [Google Scholar]
- 31.Ohl K, Tenbrock K. Inflammatory cytokines in systemic lupus erythematosus. J Biomed Biotech 2011; 2011:432595; http://dx.doi.org/ 10.1155/2011/432595 [DOI] [PMC free article] [PubMed] [Google Scholar]
- 32.Honda K, Taniguchi T. IRFs: master regulators of signalling by Toll-like receptors and cytosolic pattern-recognition receptors. Nat Rev Immunol 2006 Sep;6(9):644-58; http://dx.doi.org/ 10.1038/nri1900 [DOI] [PubMed] [Google Scholar]
- 33.Amano H, Amano E, Santiago-Raber ML, Moll T, Martinez-Soria E, Fossati-Jimack L, Iwamoto M, Rozzo SJ, Kotzin BL, Izui S. Selective expansion of a monocyte subset expressing the CD11c dendritic cell marker in the Yaa model of systemic lupus erythematosus. Arthritis Rheum 2005; 52:2790-8; PMID:16142734; http://dx.doi.org/ 10.1002/art.21365 [DOI] [PubMed] [Google Scholar]
- 34.Rubtsov AV, Swanson CL, Troy S, Strauch P, Pelanda R, Torres RM. TLR agonists promote marginal zone B cell activation and facilitate T-dependent IgM responses. J Immunol 2008; 180:3882-8; PMID:18322196; http://dx.doi.org/ 10.4049/jimmunol.180.6.3882 [DOI] [PubMed] [Google Scholar]
- 35.Giltiay NV, Chappell CP, Sun X, Kolhatkar N, Teal TH, Wiedeman AE, Kim J, Tanaka L, Buechler MB, Hamerman JA, et al.. Overexpression of TLR7 promotes cell-intrinsic expansion and autoantibody production by transitional T1 B cells. J Exp Med 2013; 210:2773-89; PMID:24145511; http://dx.doi.org/ 10.1084/jem.20122798 [DOI] [PMC free article] [PubMed] [Google Scholar]
- 36.Masmoudi H, Mota-Santos T, Huetz F, Coutinho A, Cazenave PA. All T15 Id-positive antibodies (but not the majority of VHT15+ antibodies) are produced by peritoneal CD5+ B lymphocytes. Int Immunol 1990; 2:515-20; PMID:1707658; http://dx.doi.org/ 10.1093/intimm/2.6.515 [DOI] [PubMed] [Google Scholar]
- 37.de Bruin AM, Voermans C, Nolte MA. Impact of interferon-gamma on hematopoiesis. Blood 2014; 124:2479-86; PMID:25185711; http://dx.doi.org/ 10.1182/blood-2014-04-568451 [DOI] [PubMed] [Google Scholar]
- 38.Libregts SF, Gutierrez L, de Bruin AM, Wensveen FM, Papadopoulos P, van Ijcken W, Ozgur Z, Philipsen S, Nolte MA. Chronic IFN-gamma production in mice induces anemia by reducing erythrocyte life span and inhibiting erythropoiesis through an IRF-1/PU.1 axis. Blood 2011; 118:2578-88; PMID:21725055; http://dx.doi.org/ 10.1182/blood-2010-10-315218 [DOI] [PubMed] [Google Scholar]
- 39.Zhuang H, Han S, Xu Y, Li Y, Wang H, Yang LJ, Reeves WH. Toll-like receptor 7-stimulated tumor necrosis factor alpha causes bone marrow damage in systemic lupus erythematosus. Arthritis Rheumatol 2014; 66:140-51; PMID:24449581; http://dx.doi.org/ 10.1002/art.38189 [DOI] [PMC free article] [PubMed] [Google Scholar]
- 40.Sun X, Wiedeman A, Agrawal N, Teal TH, Tanaka L, Hudkins KL, Alpers CE, Bolland S, Buechler M, Hamerman J, et al.. Increased RNase Expression Reduces Inflammation and Prolongs Survival in TLR7 Transgenic Mice. J Immunol 2013; 190:2536-43; PMID:23382559; http://dx.doi.org/ 10.4049/jimmunol.1202689 [DOI] [PMC free article] [PubMed] [Google Scholar]
- 41.Henault J, Martinez J, Riggs JM, Tian J, Mehta P, Clarke L, Sasai M, Latz E, Brinkmann MM, Iwasaki A, et al.. Noncanonical autophagy is required for type I interferon secretion in response to DNA-immune complexes. Immunity 2012; 37:986-97; PMID:23219390; http://dx.doi.org/ 10.1016/j.immuni.2012.09.014 [DOI] [PMC free article] [PubMed] [Google Scholar]
Associated Data
This section collects any data citations, data availability statements, or supplementary materials included in this article.