

Abstract
Mechanistic target of rapamycin (serine/threonine kinase) complex 1 (MTORC1) is a protein-signaling complex at the fulcrum of anabolic and catabolic processes, which acts depending on wide-ranging environmental cues. It is generally accepted that lysosomes facilitate MTORC1 activation by generating an internal pool of amino acids. Amino acids activate MTORC1 by stimulating its translocation to the lysosomal membrane where it forms a super-complex involving the lysosomal-membrane-bound vacuolar-type H+-ATPase (v-ATPase) proton pump. This translocation and MTORC1 activation require functional lysosomes. Here we found that, in contrast to this well-accepted concept, in epiphyseal chondrocytes inhibition of lysosomal activity by v-ATPase inhibitors bafilomycin A1 or concanamycin A potently activated MTORC1 signaling. The activity of MTORC1 was visualized by phosphorylated forms of RPS6 (ribosomal protein S6) and EIF4EBP1, 2 well-known downstream targets of MTORC1. Maximal RPS6 phosphorylation was observed at 48-h treatment and reached as high as a 12-fold increase (p < 0.018). This activation of MTORC1 was further confirmed in bone organ culture and promoted potent stimulation of longitudinal growth (p < 0.001). Importantly, the same effect was observed in ATG5 (autophagy-related 5)-deficient bones suggesting a macroautophagy-independent mechanism of MTORC1 inhibition by lysosomes. Thus, our data show that in epiphyseal chondrocytes lysosomes inhibit MTORC1 in a macroautophagy-independent manner and this inhibition likely depends on v-ATPase activity.
Keywords: autophagy, bafilomycin, bone, chondrocyte, lysosome, MTOR, MTORC1
Abbreviations
- 3-MA
3-methyladenine
- ACAN
aggrecan
- ACP5/TRAP
acid phosphatase 5, tartrate-resistant
- ACTB
actin, β
- ALPL
alkaline phosphatase, liver/bone/kindey
- ATG
autophagy related
- ATG5cKO
ATG5 conditional knockout in chondrocytes
- BC
avidin-biotin complex
- Baf
bafilomycin A1
- βGP
β-glycerophosphate
- BrdU
bromodeoxyuridine
- C5.18 cells
RCJ 3.1C5.18 rat mesenchymal cell line
- COL2A1
collagen, type II, α 1
- COL10A1
collagen, type X, α 1
- CQ
chloroquine
- DAPI
4′,6-diamidino-2-phenylindole, dihydrochloride
- Dox
doxycycline
- EIF4EBP1
eukaryotic translation initiation factor 4E binding protein 1
- FBS
fetal bovine serum
- GAG
glycosaminoglycan
- IGF1
insulin-like growth factor 1 (somatomedin C)
- LAMP2
lysosomal-associated membrane protein 2
- MEFs
mouse embryonic fibroblasts
- MAP1LC3A
microtubule-associated protein 1 light chain 3 α
- MTOR
mechanistic target of rapamycin (serine/threonine kinase)
- MTORC
MTOR complex
- p-
phosphorylated-
- PFA
paraformaldehyde
- RPS6
ribosomal protein S6
- RPS6KB1/p70(S6K)-α/PS6K/S6K1
ribosomal protein S6 kinase, 70kDa, polypeptide 1
- RPTOR
regulatory associated protein of MTOR, complex 1
- SGK1
serum/glucocorticoid regulated kinase 1
- TSC
tuberous sclerosis complex
- TUNEL
terminal deoxynucleotidyl transferase dUTP nick end labeling
- v-ATPase
vacuolar-type H+-ATPase.
Introduction
MTOR (mechanistic target of rapamycin [serine/threonine kinase]) becomes active when the protein is in a complex. MTOR complex 1 (MTORC1) contains RPTOR (regulatory associated protein of MTOR, complex 1) whereas MTORC2 contains a protein called RICTOR (RPTOR independent companion of MTOR, complex 2). RPTOR and RICTOR are scaffold proteins, regulating the assembly of the MTORCs and their substrate binding.1 MTORC1 integrates many intracellular signaling cascades, which modulate cellular growth and metabolism.1 MTORC1 is at the fulcrum of anabolic and catabolic processes controlling protein synthesis pathways and macroautophagy (hereafter referred to as autophagy). MTORC1 stimulates protein synthesis by phosphorylating RPS6KB1 (ribosomal protein S6 kinase, 70kDa, polypeptide 1) and EIF4EBP1 (eukaryotic translation initiation factor 4E binding protein 1). Phosphorylated RPS6KB1 acts on RPS6 (ribosomal protein S6) to stimulate increased protein synthesis. Likewise, the phosphorylation of EIF4EBP1 prevents its binding to the cap-binding protein EIF4E (eukaryotic translation initiation factor 4E), which enables cap-dependent mRNA translation.1 At the same time, MTORC1 inhibits autophagy by directly phosphorylating components of the autophagy machinery including ATG13 (autophagy related 13) and ULK1 (unc-51 like autophagy activating kinase 1), which disrupts autophagosome formation.2,3 Hence, MTORC1 controls cellular protein levels by stimulating protein synthesis and by attenuating ULK1/2-mediated autophagy.
The regulation of MTORC1 activity is critical to a cell's ability to respond to the environment; hence, MTORC1 activity is tightly controlled. Many factors which can affect MTORC1 activity, such as growth factor stimulation, hypoxia, energy levels, and inflammation, are internally directed to MTORC1 via the tuberous sclerosis complex (TSC), which consists of TSC1/hamartin (tuberous sclerosis 1) and TSC2/tuberin. TSC inhibits the activity of a small GTPase, RHEB (Ras homolog enriched in brain), which is required for MTORC1 activation.1
Amino acids are essential for MTORC1 activity, but do not direct MTORC1 activity via TSC. The mechanism by which amino acids induce MTORC1 activation has been a hot topic in recent research.1,4 Under amino acid-deprived conditions, MTOR is diffusely distributed within the cell in an as-yet undefined location; however, in the presence of amino acids MTOR forms puncta at sites which have been identified as lysosomes.1 The translocation of MTOR to the lysosome requires a family of proteins called the Rag GTPases (RRAGs). In mammals RRAGA or RRAGB bind to RRAGC or RRAGD. In the presence of amino acids the Rag GTPases are in an active state in which RRAGA or RRAGB are bound to GTP and RRAGC or RRAGD are bound to GDP.1 The activated Rag GTPases directly interact with MTORC1 by binding to RPTOR.1 These activated Rag GTPases direct MTORC1 to the lysosome membrane where it forms a super-complex consisting of the Ragulator and the vacuolar-type H+-ATPase (v-ATPase) complexes.1 Amino acids also regulate the strength of the interaction between Ragulator and the v-ATPase complexes.1 Amino acid accumulation within the lysosome is required for MTORC1 activation, and as such the current theory of MTORC1 activation by amino acids has been coined the “inside-out” model.1
A key function of the lysosome is to degrade unwanted cellular material. Digestive enzymes within the lysosomes are specifically adapted to operate in an acidic environment. To maintain an acidic pH (pH 4.5 to 5) in lysosomes, protons are pumped into the lysosome by the lysosomal membrane-bound v-ATPase.5 Lysosomal activity can be blocked by pharmacological inhibitors such as bafilomycin A1 (Baf) which binds at the interface between transmembrane helices 1, 2, and 4 of ATP6V0C/subunit c of the V0 domain of the v-ATPase, and prevents helical swiveling and, accordingly proton accumulation in the lysosome), chloroquine (CQ, which neutralizes the lysosomal pH by an unknown mechanism), and leupeptin (which inhibits enzymatic activity within lysosomes).6-8 MTORC1 activity is reduced when lysosomal activity is disrupted, presumably by reducing the pool of intra-lysosomal amino acids, and hence disrupting the “inside-out” model.9
MTORC1 is emerging as a key player in longitudinal bone growth. Children's long bones grow from epiphyseal growth plates, narrow cartilage organs located at the ends of the long bones. Growth plates consist of chondrocytes at various differentiation stages within an avascular cartilage matrix.10 Rapamycin, an MTOR inhibitor which mainly disrupts MTORC1 activity,1 inhibits bone growth both in vitro and in vivo.11,12 Conditional ablation of RPTOR in the limb (using periaxin [Prx]-driven Cre) reduces limb size and hypertrophic chondrocyte cell size.13 Furthermore, MTORC1 was proposed to regulate the transition of chondrocytes from the proliferative to the post-mitotic stage of maturation.14 These observations suggest that MTORC1 is important in regulating chondrocyte physiology and bone growth. MTORC1 can act via multiple downstream pathways including stimulation of cell hypertrophy and blocking of autophagy.1 The role of autophagy in chondrocyte hypertrophy has been widely proposed.15 We decided to explore the role of autophagy in longitudinal bone growth using the well-known autophagy inhibitors Baf and CQ. To our surprise we found that these inhibitors activate the MTORC1 pathway in chondrocytes and stimulate bone growth in an autophagy-independent manner.
Results
Pharmacological inhibitors of lysosomal activity stimulated longitudinal bone growth
To explore the role of autophagy in longitudinal bone growth we cultured metatarsal bones ex vivo in the presence of bafilomycin A1 and chloroquine. Baf and CQ stimulated growth to the same extent as the well-established promoter of bone growth IGF1 (insulin-like growth factor 1 [somatomedin C])16 (Fig. 1A, 1B) with the effect of Baf being more potent than CQ (710 ± 18 μm versus 880 ± 28 μm growth in 5 d, p < 0.001, n = 13 animals [39 metatarsal bones] for CQ and 7 animals [21 bones] for Baf). This growth stimulation was associated with an increased chondrocyte hypertrophy as determined by cell size (Figs. 1C and 2A, lower panel), extension of the hypertrophic zone positive for chondrocyte hypertrophy marker COL10A1 (collagen, type X, α 1; 265 ± 23 μm versus 194 ± 13 μm at 3 d of culture, n = 5, p = 0.028; see also Fig. 2G and H) and the level of COL10A1 mRNA expression (Fig. 3D). The treatment was associated with an increase in SQSTM1 accumulation in the chondrocytes (Figs. 1D, E and 2C), indicating an inhibition in autophagic flux.17 Baf treatment at this dose also led to a slight increase in the number of apoptotic chondrocytes (0 ± 0% versus 1.04 ± 0.5% of TUNEL-positive cells in the proliferative zone of vehicle- and Baf-treated bones, respectively, p = 0.046, n = 5 and 2.8 ± 0.8% versus 3.8 ± 0.6% of TUNEL-positive cells in the hypertrophic zone of vehicle- and Baf-treated bones, respectively, p = 0.4, n = 5: see also Fig. 2E) and a decrease in cell proliferation (10.6±1.3% of bromodeoxyuridine [BrdU]-positive cells in control [n = 7] versus 6.0 ± 0.3% in Baf-treated bones [n = 4], p = 0.024, Fig. 2F). No changes in the organization of different zones of the growth plate (Fig. 2A), proteoglycan turnover (as visualized by Safranin O staining, Fig. 2D) and glycosaminoglycan (GAG) release (1.86±0.14 μg/ml in Baf [n = 6] versus 1.74 ± 0.10 in control [n = 10], p = 0.53), underlying mineralization (Von Kossa staining, Fig. 2I) and osteoclast number (ACP5/TRAP [acid phosphatase 5, tartrate resistant]) staining, Fig. 2J; 5.7 ± 1.2 versus 4.1 ± 0.7 of ACP5-positive cells per bone section in vehicle and Baf-treated bones, respectively; n=12 and 11, p=0.24) were observed upon Baf exposure.
Figure 1.
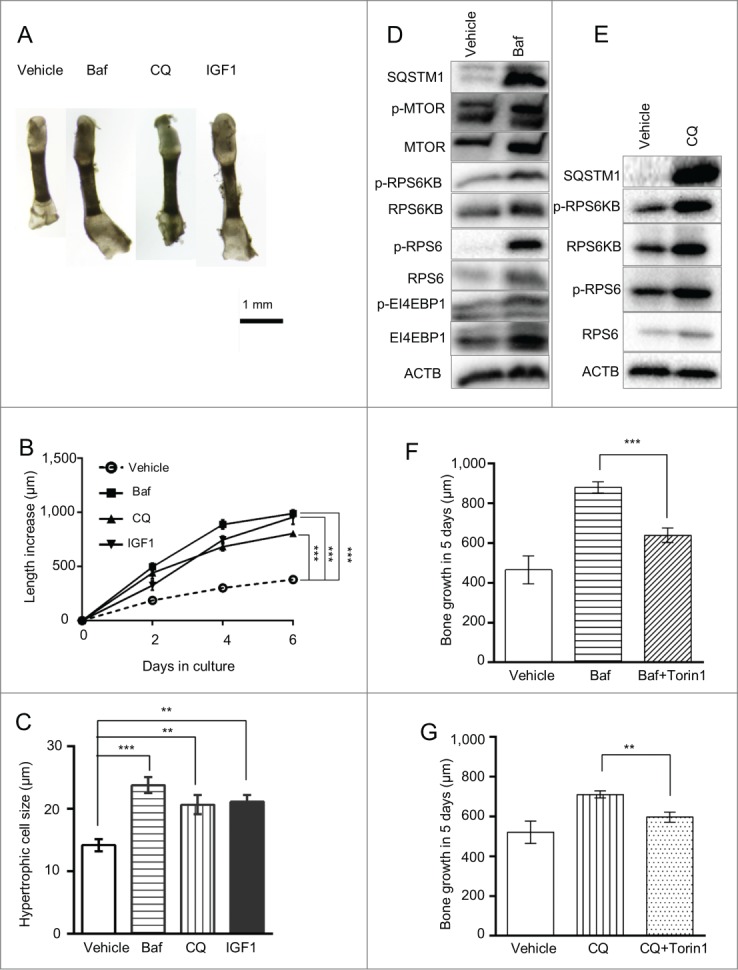
Bafilomycin A1 treatment increases longitudinal bone growth, chondrocyte hypertrophy and RPS6 phosphorylation. (A, B) Metatarsals isolated from post-natal mice were cultured ex vivo in the presence of 8 nM Baf, 30 µM CQ or 100 ng/ml IGF1. Bone length was measured at the indicated time points as described in Materials and Methods. ***, p < 0.001; n = 6 animals (18 bones) for control, Baf and IGF1 groups, and n = 4 animals (12 bones) for the CQ group. (C) Size of terminal hypertrophic chondrocytes was analyzed after 6 days in culture (**, p < 0.01; n = 5). Baf (D) and CQ (E) elevated phosphorylation levels of members of the MTORC1-signaling pathway as detected by western blotting. Phosphorylation was analyzed after 3 d exposure. Statistical values are incorporated in the text. The MTORC1 inhibitor Torin1 attenuated the growth-promoting effect of Baf or CQ (F and G, respectively). (n = 5–11 animals).
Figure 2.
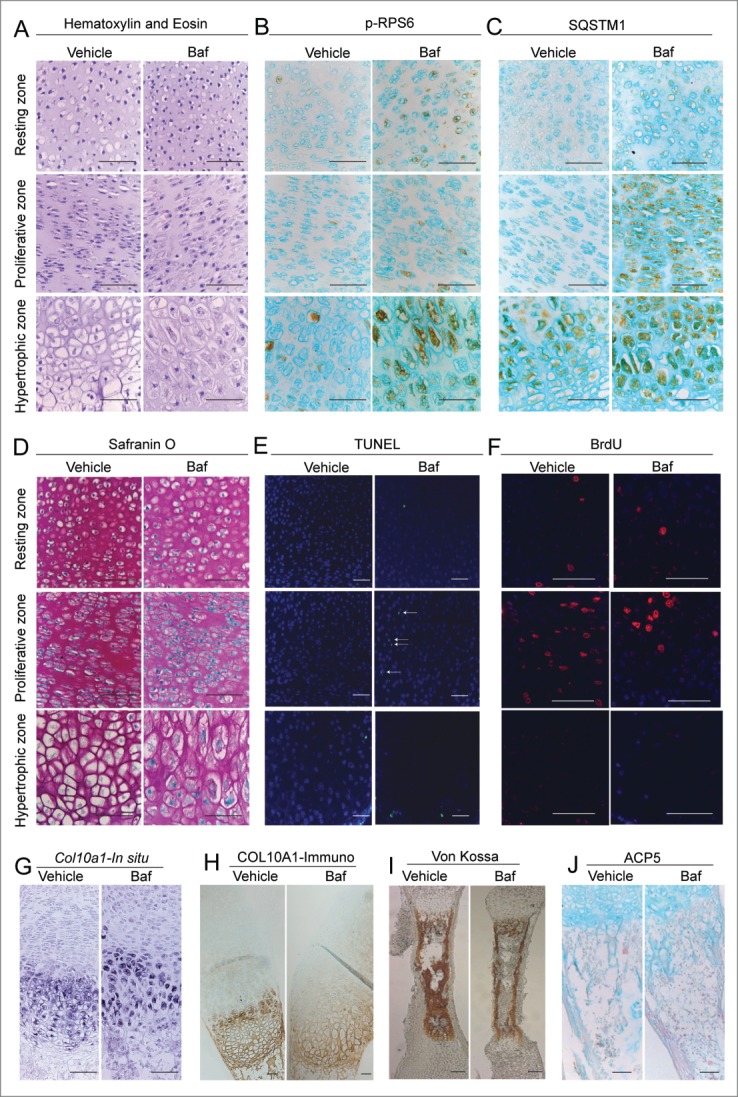
(See previous page). Bafilomycin A1 promotes differentiation, elevates cell death and decreases chondrocyte proliferation in cultured metatarsal bones. Histological appearance of different zones of the growth plate of cultured bones showed increased hypertrophy upon Baf exposure (A). Baf caused an increase in phosphorylated RPS6 (B) and SQSTM1 accumulation (C) in chondrocytes when assessed by immunohistochemistry. Visualization of proteoglycan levels by Safranin O staining did not reveal any changes (D). Treatment with Baf elevated cell death as assessed by TUNEL labeling (E) and decreased cell proliferation as assessed by BrdU incorporation (F). Baf stimulated an increase in Col10a1 levels as assessed by in situ hybridization (G) and immunohistochemistry (H). Levels of mineralization were assessed by Von Kossa staining and showed no obvious differences (I). Osteoclasts were visualized by ACP5 staining and no changes were observed (J). All bones were exposed to Baf for 3 d. Scale bar: 100 μm. Statistical analysis is incorporated in the text.
Figure 3.
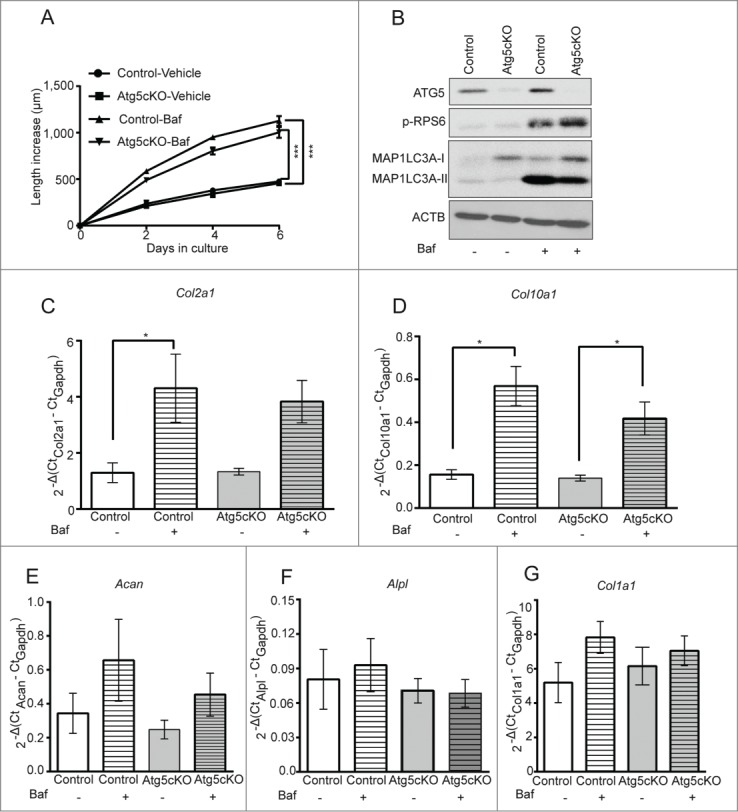
Bafilomycin A1 stimulates bone growth in an autophagy-independent manner. (A) Metatarsal bones isolated from post-natal mice with and without conditional Atg5 deletion were cultured ex vivo in the presence of 8 nM Baf; bone length was measured over a time course of 6 d (n = 7 animals [21 bones] for control and 6 animals [18 bones] for Atg5cKO). (B) Cartilage was isolated from the bones described above, following 2 d of culture, by micro-dissection and levels of ATG5, SQSTM1, MAP1LC3A and p-RPS6 were analyzed by western blot. RNA was extracted from bones cultured for 2 d and levels of Col2a1 (C), Col10a1 (D), Acan (E), Alpl (F) and Col1a1 (G) were analyzed by qRT-PCR. (*p < 0.05, ***p < 0.001, n = 5 repeats from 6 bones each).
Growth is stimulated via activation of the MTORC1 signaling pathway
Thus, the observed growth stimulation was entirely attributed to the promoted chondrocyte hypertrophy without any contribution from cell proliferation or survival. One of the principal factors regulating cell size control is MTORC1. To determine if cell size was influenced by MTORC1 signaling in Baf-treated metatarsals, we determined the phosphorylation state of a key MTORC1 readout, phosphorylated (p)- RPS6. Much to our surprise we noted that RPS6 phosphorylation was markedly increased in the chondrocytes following Baf or CQ treatment (10.1 ± 2.0 fold [n = 3, p = 0.011] and 2.2 ± 0.16 fold [n = 3, p = 0.016] above control by Baf and CQ, respectively; see also Figs. 1D, E and 2B). This finding is at odds with the general concept of MTORC1 activation by lysosomes, and hence we sought to study this finding in more detail. We explored other components of the MTORC1 pathway and found a significant increase in phosphorylation of RPS6KB1/S6 kinase (ribosomal protein S6 kinase, 70kDa, polypeptide 1) by Baf (p-RPS6KB1; 3.0 ± 0.3 fold above control [n = 3 repeats (with 18 bones in each), p = 0.027, Fig. 1D] and a nonsignificant increase by CQ [2.0 ± 0.4 fold above control, p = 0.23, n = 2 repeats with 6 bones in each; see also Fig. 1E]). Levels of phosphorylated and total MTOR were slightly, but not significantly, elevated by Baf treatment (2.0 ± 1.2-fold increase for p-MTOR, p=0.49 and 1.3 ± 0.3-fold increase for total MTOR, p = 0.49, see also Fig. 1D). Finally, we employed the MTORC1 inhibitor Torin1 and found that it significantly diminished the growth-promoting effect of both Baf and CQ (Fig. 1F and G). No changes in the phosphorylation of the MTORC2 target SGK1 (serum/glucocorticoid regulated kinase 1) were observed upon Baf-treatment (21±35% increase above control, p = 0.63, n = 3 repeats with 18 bones in each repeat)
Thus, the data suggest that inhibition of lysosomes in chondrocytes activates the MTORC1-signaling pathway, which in turn leads to increased bone growth.
Bafilomycin A1 stimulates longitudinal bone growth independently of autophagy
Our initial findings with the lysosomal inhibitors Baf and CQ led us to hypothesize that inhibited autophagic flux was stimulating longitudinal bone growth. To test this hypothesis we obtained metatarsal bones from conditional knockout mice in which the Atg5 gene, which is essential for autophagy, was specifically deleted in chondrocytes (ATG5cKO) using the Cre-lox approach. However, Baf stimulated the growth of ATG5cKO mice and control metatarsals similarly, indicating that Baf-stimulated growth was independent of autophagy (Fig. 3A). Western blot analysis of total protein isolated from the cartilage of these metatarsals confirmed that there was deletion of Atg5, an inhibition of autophagy in ATG5cKO metatarsals (based on MAP1LC3A [microtubule-associated protein 1 light chain 3 α] accumulation), and that Baf stimulated RPS6 phosphorylation similarly in both ATG5-deficient and control chondrocytes (Fig. 3B). Furthermore, Baf elevated expression of both Col2a1 (collagen, type II, α 1) and Col10a1 (collagen, type X, α 1) genes similarly in control and ATG5-deficient bones (Fig. 3C and D) whereas expression of Acan (aggrecan), Alpl (alkaline phosphatase, liver/bone/kindey) and Col1a1 (collagen, type I, α 1) was not affected in any genotype (Fig. 3E–G).
Bafilomycin A1 activates the MTORC1 signaling pathway in chondrocytes
To further study the role of Baf in chondrocytes, we developed a cell culture model using RCJ 3.1C5.18 rat mesenchymal cell line (C5.18 cells). Baf downregulated RPS6 phosphorylation in undifferentiated C5.18 cells (Fig. 4A). However, following differentiation into chondrocytes (referred to as C5.18 chondrocytes), Baf stimulated RPS6 phosphorylation in these cells (Fig. 4A–D). We then differentiated C5.18 cells for an extended time course toward terminally differentiated hypertrophic-like chondrocytes.18 Differentiation of these cells was confirmed by increased gene expression of chondrocyte markers Acan, Col2a1, Col10a1, and Alpl as well as nodule formation and glycosaminoglycan production (Fig. S1A–H). Regardless as to whether the cells were differentiated for a total of 4, 9 or 11 d, Baf treatment similarly increased RPS6 phosphorylation (Fig. 4B), suggesting that this effect can be attributed to chondrocytes generally. Supporting this, RPS6 phosphorylation was also observed in all zones of Baf-treated metatarsal bones (Fig. 2B), albeit most vividly in the hypertrophic zone. We also conducted a dose response, and 40 nM of Baf was found to be the lowest dose required for RPS6 activation in the C5.18 cell line (8 nM in metatarsals), whereas phosphorylation of EIF4EBP1, another well-known target of MTORC1 was observed at as low as 8 nM of Baf (Fig. 4C). However, no significant changes were observed in the levels of p-MTOR (55 ± 30% increase above control when normalized to total MTOR, p = 0.38, n=3) or p-RPS6KB1 (14 ± 44% decrease below control when normalized to total RPS6KB1, p = 0.78, n = 3). To further prove activation of MTOR we cultured differentiated C5.18 cells in the presence of Baf and the MTOR inhibitor Torin1. Torin1 dose-dependently decreased both RPS6 and EIF4EBP1 phosphorylation, supporting MTORC1 activation by Baf (Fig. 4C). Next, we did time-response experiments, which revealed that RPS6 activity occurred as early as 16 h and was sustained over at least 48 h (Fig. 4D). Here we also observed a downregulation in phosphorylated AKT at serine residue 473, a well-known readout for MTORC2 (Fig. 4D).19 However, other targets of MTORC2, phosphorylated PRKCA (protein kinase C, α) and phosphorylated SGK1 were not affected (Fig. S2A–D). Thus, we concluded that MTORC2 was not affected by Baf treatment.
Figure 4.
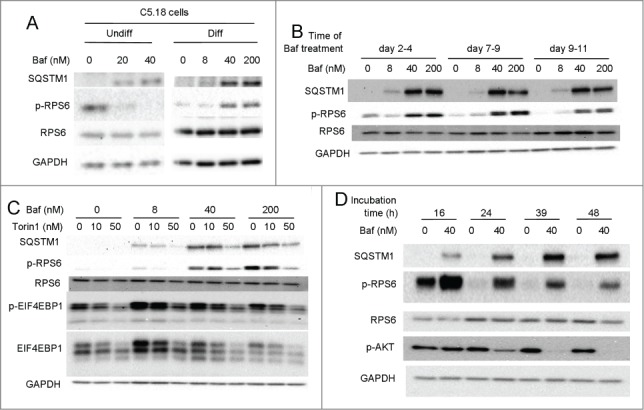
Bafilomycin A1 stimulates RPS6 phosphorylation in a cultured chondrocgenic cell-line and is MTOR dependent. (A) Mesenchymal C5.18 cells were either differentiated into chondrocytes or cultured undifferentiated. Both nondifferentiated and chondrocyte-differentiated cells were treated with a range of Baf doses and levels of SQSTM1 and phospho-RPS6 assessed by western blot. (B) C5.18 cells were further differentiated into chondrocytes of different levels of maturity (for 2, 7 or 9 d) and thereafter treated with Baf for an additional 48 h. Levels of SQSTM1 and p-RPS6 were analyzed by western blot. (C) C5.18 chondrocytes were cultured in the presence of Baf and the MTOR inhibitor Torin1 at the indicated concentrations and the levels of SQSTM1, phospho-RPS6 and phospho-EIF4EBP1 analyzed by western blot. (D) C5.18 chondrocytes were treated with 40 nM Baf for the indicated incubation times and the levels of SQSTM1, phospho-RPS6, and phospho-AKT (Ser 473) analyzed by western blot.
We then performed a series of control experiments to confirm the biological nature of the observation. First, we isolated cells from various sources and exposed them to Baf. As expected, and opposite to chondrocytes, Baf blocked RPS6 phosphorylation in mouse embryonic fibroblasts (MEFs), cells isolated from whole liver, and even a cell type closely related to growth plate chondrocytes: murine calvarial osteoblasts (Fig. 5A). Time-response and dose-response experiments with osteoblasts confirmed downregulation of RPS6 phosphorylation upon Baf exposure in this cell type (Fig. S2E–H). These results indicate a very special response by chondrocytes to Baf. Culture conditions require chondrocytes to be confluent. To determine if the response to Baf could be attributed to this specific culture condition, we treated both nonconfluent and confluent MEFs with Baf. Confluence led to a significant decrease in CCND1 (cyclin D1) levels (37 ± 12% of control, p < 0.001, n = 4), albeit proliferative activity remained (not shown). We found a similar decrease in the levels of phosphorylated RPS6 between nonconfluent and confluent MEFs upon Baf treatment (Fig. 5B). We, also employed a MEF cell line with Atg5 gene expression under the transcriptional control of the tet-off system.20 The addition of a tetracycline analog, doxycycline (dox), downregulated the expression of the essential autophagy protein ATG5; however, it inhibited RPS6 phosphorylation in MEFs regardless of the presence of ATG5 (Fig. 5B). Next we assessed the activity of lysosomal enzymes in Baf-treated C5.18 chondrocytes and MEFs. The lysosomal enzyme CTSB/cathepsin B is more efficient in an acidic environment.21 Hence inhibiting the lysosomal acidification with Baf should reduce CTSB activity, which was indeed the case for both C5.18 chondrocytes and MEFs (Fig. 5C). Finally, we controlled for differentiation medium, which is needed for the differentiation of C5.18 cells into chondrocytes. We reciprocally inverted the mediums during Baf treatment allowing chondrocytes to be treated in the medium used for MEF cultures as well as treating MEFs in the differentiation medium normally utilized for chondrocyte differentiation. Regardless of which medium was used Baf still reduced RPS6 phosphorylation in MEFs (Fig. 5D) and increased it in chondrocytes (Fig. 5E). Altogether these observations confirm that the unique response we observe is specific to the cell type and not the culture conditions.
Figure 5.

The stimulation of RPS6 phosphorylation by bafilomycin A1 is specific to chondrocytes. (A) Differentiated C5.18 chondrocytes, MEFs, cells extracted from whole liver or calvarial osteoblasts were cultured in the presence of Baf for 48 h and levels of phospho-RPS6 and SQSTM1 were analyzed by western blot. (B) Confluent or nonconfluent MEFs with regulated levels of ATG5 (tet-off system, which downregulates Atg5 transcription in the presence of dox) were treated with 8 nM Baf in combination with dox, and levels of ATG5 and p-RPS6 were analyzed by western blot. (C) C5.18 chondrocytes and MEFs were grown on cover slips, treated with Baf and analyzed for lysosomal activity (red fluorescent signal) utilizing the Cathepsin B kit. (D) MEF cells were treated at confluence with Baf present in either their regular culture medium (MEF culture medium) or medium used for differentiation of C5.18 cells (C5.18 culture medium); levels of RPS6 phosphorylation and SQSTM1 were analyzed by western blot. (E) C5.18 cells were differentiated into chondrocytes and then treated with Baf either as usual (C5.18 culture medium) or with culture medium utilized for MEFs (MEF culture medium); phosphorylation of RPS6 and levels of SQSTM1 were analyzed by western blot.
Baf activated MTORC1 independent of nutrition
Nutrition is the most potent regulator of MTORC1 activity.1 To explore the interaction between the observed Baf-mediated MTORC1 activation and nutrition status, we first modulated levels of serum in our culture conditions. Baf stimulated RPS6 phosphorylation at all serum levels tested and even without serum (Fig. 6A–C). The stimulation was observed both after 24 (Fig. 6A, B) and 48 (Fig. 6C, D) h of treatment. It is interesting to note that there was a downward trend in levels of RPS6 phosphorylation as the serum concentrations were reduced.
Figure 6.
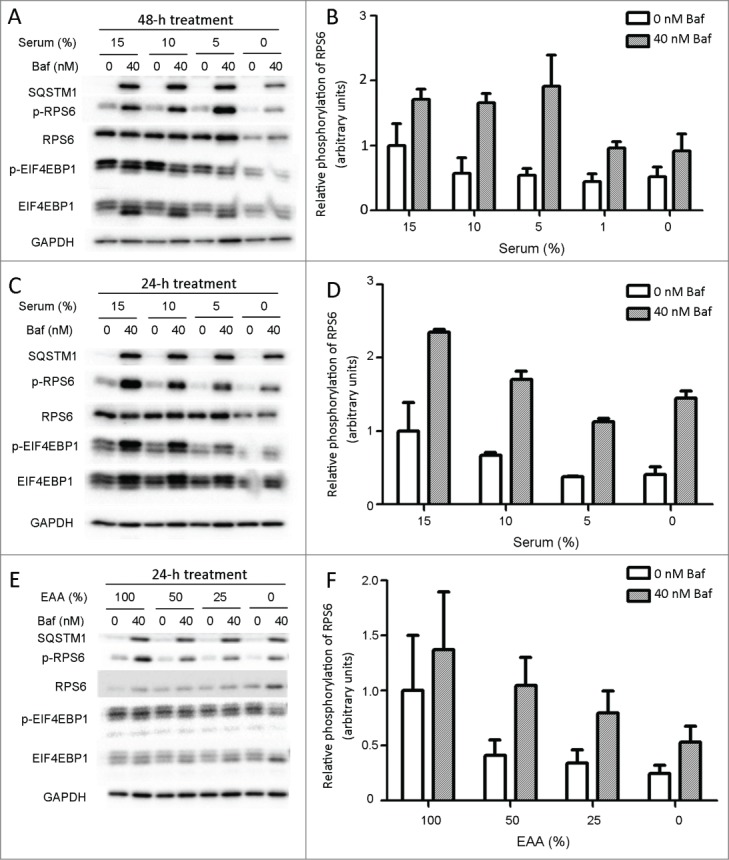
The stimulation of RPS6 phosphorylation by Baf is nutrition independent. C5.18 cells were differentiated into chondrocytes and then treated with Baf in the presence of different serum concentrations for 48 (A, B) and 24 (C, D) h. Elevation of RPS6 phosphorylation was observed independently of serum levels. (E, F) Amino acid- and glucose-free custom-made DMEM medium was supplemented with glucose (100% of standard DMEM) and nonessential amino acids (100% of standard DMEM), whereas the levels of essential amino acids (EAA) varied from 100% to 0% (of standard DMEM). Differentiated C5.18 chondrocytes were treated with Baf in serum-free conditions with varying levels of essential amino acids. Levels of SQSTM1, phospho-RPS6, total RPS6, phospho-EIF4EBP1 and total EIF4EBP1 were analyzed by western blot (*p < 0.05, n = 2–4).
Next, we employed custom DMEM medium without amino acids, supplemented it with nonessential amino acids and varied the levels of essential amino acids. Baf treatment elevated levels of both p-RPS6 and p-EI4EBP1 independently of amino acid concentrations (Fig. 6C).
Finally, we utilized FLCN (folliculin) localization to lysosomes as a measure of intracellular nutrition status.22 No changes in the colocalization between FLCN and lysosomes were observed upon Baf exposure (Fig. 7A and B). We concluded that the observed effect is nutrition-independent.
Figure 7.
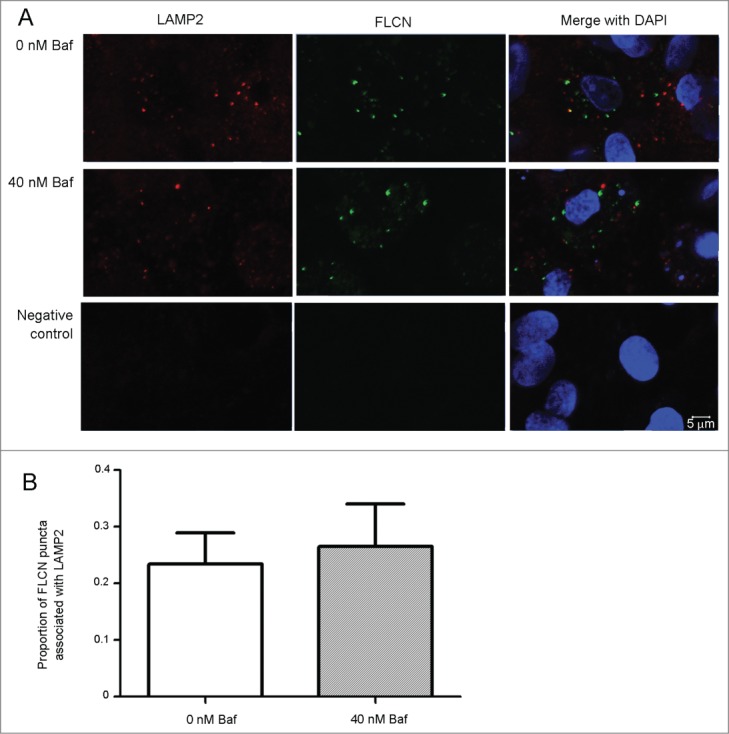
Baf does not affect localization of FLCN on lysosomes. C5.18 cells were differentiated into chondrocytes and treated with Baf for 48 h. Colocalization between lysosomes (visualized by LAMP2 antibody) and FLCN was explored by confocal microscopy (A). Quantification revealed no differences in lysosomal localization of FCLN upon Baf exposure (B). p = 0.7489, n = 3 independent experiments with approximately 400 cells analyzed in each experiment.
Inhibition of v-ATPase in chondrocytes is the most potent activator of MTOR signaling
To further explore the role of the lysosome and v-ATPase in RPS6 phosphorylation we decided to culture C5.18 chondrocytes with other inhibitors of autophagic flux. First, concanamycin A (concanamycin), another v-ATPase inhibitor, stimulated RPS6 phosphorylation in C5.18 cells and inhibited it in MEFs (Fig. 8A), suggesting that off-target effects of Baf may not be causing RPS6 phosphorylation. Whereas Baf greatly stimulated RPS6 phosphorylation (12-fold increase, p < 0.018, n = 10), CQ (v-ATPase-independent inhibitor of lysosomal acidification) stimulated RPS6 phosphorylation in chondrocytes quite modestly (2.7-fold increase, p = 0.379, n = 3). Neither 3-methyladenine (3-MA, inhibitor of autophagy11) nor leupeptin (inhibitor of lysosomal enzymes28) were capable of activating MTORC1 (Fig. 8B). Thus, these pharmacological experiments suggest a particular importance of the v-ATPase in such a specific MTOR regulation in chondrocytes.
Figure 8.
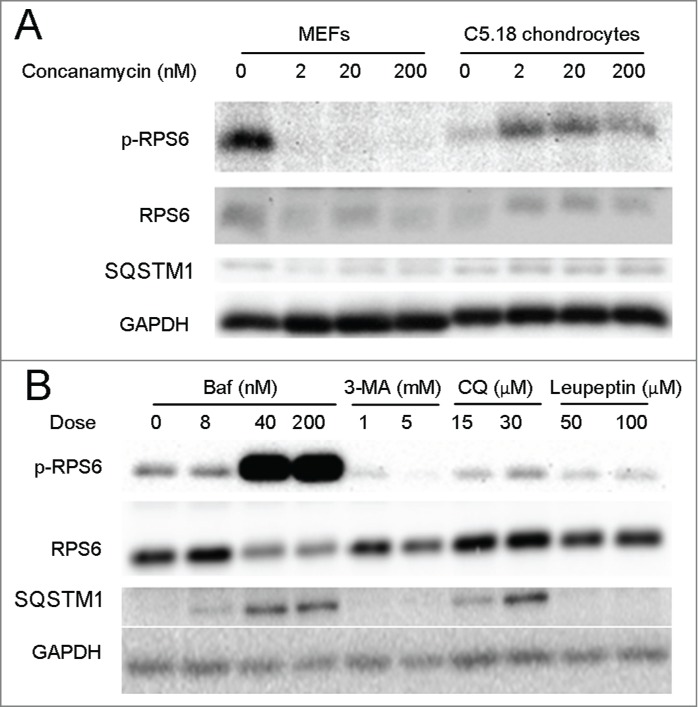
Inhibitors of v-ATPase are the most potent activators of MTORC1 in chondrocytes. (A) MEFs and C5.18 chondrocytes were treated with varying doses of concanamycin for 48 h. (B) C5.18 chondrocytes were treated with varying doses of Baf, 3-MA, CQ and leupeptin for 48 h. In all panels the levels of p-RPS6 and SQSTM1 were analyzed by western blot.
Discussion
Here we made 2 major interconnected observations. First, we found that inhibition of lysosomes with v-ATPase inhibitors and, to a lesser extent, chloroquine, promotes longitudinal bone growth and, second, that it activates the MTORC1 signaling pathway in chondrocytes.
Inhibition of lysosomes and bone growth
Both bafilomycin A1 and chloroquine potently promote longitudinal growth of metatarsal bones, with Baf being slightly more potent. Since both Baf and CQ are widely used for inhibition of autophagy we first tested the hypothesis that blocking of autophagic flux causes the observed phenotype.8 To address this hypothesis we have created chondrocyte-specific Atg5cKO mice and found that genetic ablation of autophagy leads to a slight growth retardation associated with elevated levels of apoptosis and inhibited proliferation.23 However, no changes in chondrocyte differentiation or hypertrophy could be detected in these mice.23 Similar to Atg5cKO mice, Baf and CQ elevated cell apoptosis and inhibited proliferation, but in contrast promoted chondrocyte differentiation and hypertrophy. The latest effect is observed even in metatarsal bones deficient in ATG5. Thus, we think it is plausible to conclude that the growth-promoting effect of both Baf and CQ is autophagy independent. In a search of underlying mechanisms for the observed growth-promoting effect we found potent activation of an MTORC1 signaling pathway. This is a very surprising observation, which is opposite to the current understanding of MTORC1 regulation and we discuss it in the next paragraph below.4,9,24 MTORC1 is a well-known regulator of cell size;1 however, it is not clear if MTORC1 is regulating the size of hypertrophic chondrocytes. Rapamycin, an MTOR inhibitor, decreases longitudinal bone growth and chondrocyte hypertrophy.11,12 Thus, it is plausible to assume that activation of MTORC1 leads to increased chondrocyte hypertrophy and bone growth. Supporting this we found that the MTOR inhibitor Torin1 attenuates Baf- and CQ-induced bone growth. However, we think that genetic studies are required to confirm this assumption and to extend it into a physiological setting. In addition, activation of RPS6 by Baf is 5 times stronger than by CQ whereas the growth-promoting effect is just 24 percent stronger, suggesting that different mechanisms of growth may be involved. For example, the levels of RPS6 activation by CQ are sufficient for the maximal growth stimulation via the MTORC1 pathway and the additional growth achieved by Baf involves other mechanisms. Thus, we conclude that altogether our observations are pointing toward MTORC1 having a role in bone growth stimulation, but alternative mechanisms cannot be excluded and genetic studies are needed to properly address this question.
v-ATPase inhibitors and MTORC1 signaling pathway activation
Bafilomycin A1 and CQ activate the MTORC1-signaling pathway in chondrocytes. This observation is in contrast to the generally accepted mechanism implying activation of MTORC1 by active lysosomes at the surface of the lysosomal membrane.4,9,24 We have no clear answer as to why chondrocytes behave differently in this respect. Recent observations by another research group show that another terminally differentiated cell type, osteoclasts, also activate MTORC1 upon lysosome inhibition.25 Both chondrocytes and osteoclasts are terminally differentiated cells with high lysosomal activity, albeit of different developmental origin—chondrocytes are of mesenchymal origin and osteoclasts of haematopoietic.15 In contrast, the majority of our current knowledge related to MTORC1-lysosome interaction comes from cell lines and overexpression studies.9,26-28 Thus, our data suggest that in some terminally differentiated cell types the mechanism of lysosome-dependent MTORC1 activation might be different.
One possible explanation might include degradation of MTORC1 via lysosomes, at least in some cell types. It was reported that accumulation of total MTOR is observed upon lysosome inhibition in osteoclasts.25 However, we did not see a significant increase in total levels of MTOR, in chondrocytes upon Baf exposure. Supporting this, studies by Zoncu et al.9 propose that MTORC1 is rather activated by v-ATPase and intralysosomal amino acids, but not by lysosomal activity per se.
Thus, the alternative possibility is that the interaction of v-ATPase with the MTOR-activating super-complex is particularly different in chondrocytes and osteoclasts as compared with generally used cell lines (Drosophila S2, HEK 293, HeLa, MEF, NIH3T3, etc.).9,26-32 The role of the v-ATPase in MTORC1 activation is unequivocal and well described for multiple cell lines.4 However, mutations in genes encoding GATOR1 proteins, makes MTORC1 signaling resistant to a v-ATPase inhibitor, thereby providing a possibility that v-ATPase-dependent MTORC1 regulation might differ in different cellular settings.28 Interestingly, activation of MTORC1 by CQ in osteoclasts is quite weak (about 2-fold) whereas activation of MTORC1 by v-ATPase mutation (mutation R740S in ATP6V1A/α subunit) is very strong.25 Similarly, we see very strong activation of MTORC1 in chondrocytes by Baf and concanamycin, 2 well-known inhibitors of the v-ATPase, whereas the effect of CQ is much more modest. CQ neutralizes lysosomal pH in a poorly defined, but apparently v-ATPase independent, manner.7 Furthermore, 3-MA (which inhibits both class I phosphoinositide 3-kinases and class III phosphatidylinositol 3-kinases, thereby inhibiting autophagy) and leupeptin (which inhibits enzymatic activity within lysosomes but does not affect the v-ATPase) had no capacity to activate MTORC1 in chondrocytes. It is interesting to point out that the observed activation of MTORC1 by Baf is nutrition independent. V-ATPase acts downstream of amino acids, but upstream of the Rag GTPases and mediates amino acid sensing by interacting with the Ragulator complex.4,9,24 In HEK 293 cells amino acid starvation strengthens, and re-stimulation weakens, the interaction between the v-ATPase and the Ragulator, whereas v-ATPase inhibition locks in the interaction in the amino acid-free state.9,24 Since the v-ATPase is downstream of amino acids, a nutrition-independent effect of MTORC1 activation by Baf in chondrocytes is again pointing toward a v-ATPase-dependent mechanism. We can speculate that the interaction between the v-ATPase and the Ragulator is different in chondrocytes as compared to other cell types. Thus, together the data are pointing toward a different role of the v-ATPase in MTORC1 regulation in some cell types. The mechanism of this interaction remains to be elucidated.
In summary, we have identified a novel mechanism of MTORC1 activation, which is contrary to previous reports and involves the inhibition of lysosomes in chondrocytes. Furthermore, this MTORC1 activation occurs in both an autophagy- and a nutritionally independent manner. These findings suggest the exciting possibility that the mechanisms governing MTORC1 activation may be cell-type specific and allow the cell an even tighter regulation of this crucial signaling pathway.
Materials and Methods
The following chemicals and reagents were used in the preparation of this manuscript: Phosphate buffered saline (PBS; Invitrogen, 1160381), Dulbecco's modified Eagle's medium/F-12 mixture (DMEM/F12; Invitrogen, 11330057), DMEM custom medium (made by Life Technologies and is a standard DMEM medium depleted of all amino acids, glucose and pyruvate), minimal essential medium (Invitrogen, 22571020), fetal bovine serum (FBS; Life Technologies, 16000-044), gentamycin (Invitrogen, 15750), ascorbic acid (Sigma-Aldrich, A5960), β-glycerophosphate (βGP; Sigma-Aldrich, G9422), doxycycline (dox; Sigma-Aldrich, D3447), bafilomycin A1 (LC laboratories, B-1080), concanamycin A (Sigma-Aldrich, 27689), chloroquine (Sigma-Aldrich, C6628), dexamethasone (Sigma-Aldrich, D1756), Torin1 (Tocris Biosciences, 4247), hyaluronidase (Sigma-Aldrich, H3506), leupeptin (VWR, a2183.0025),33 ECL western blotting substrate (Perkin Elmer, NEL104001EA), 2x Laemmli buffer (Sigma-Aldrich, S3401), alcian blue (Sigma-Aldrich, A5268), digoxigenin (Roche Inc., 11277073910), bovine serum albumin (Sigma-Aldrich, A8806), IGF1 (Sigma-Aldrich, I3769), Magic Cathepsin B kit (ImmunoChemistry Technologies, 937), rat-tail collagen (Invitrogen, A1048301), microscope cover glasses (VWR International, ECN 631-1578), 3-methyladenine (Sigma-Aldrich, M9281),7 Vectastatin avidin-biotin complex (ABC) kit (Vector laboratories, PK-6100), 3, 3′-diaminobenzidine kit (DAKO, K3468), and normal horse serum (DAKO, S-2000). The following antibodies were used: anti-p-RPS6 (Cell Signaling Technology, 4858), anti-AKT (Cell Signaling Technology, 9272), anti-p-AKT (Ser473; Cell Signaling Technology, 4060), anti-RPS6 (5G10; Cell Signaling Technology, 2217), anti-GAPDH (Cell Signaling Technology, 2118), anti-EIF4EBP1 (53H11; Cell Signaling Technology, 9644), anti-phospho-EIF4EBP1 (Thr37/46; Cell Signaling Technology, 2855), anti-MAP1LC3A (MBL, PM036), LAMP2 (Santa Cruz Biotechnology, sc-8100), FLCN (Cell Signaling Technology, 3697), anti-ATG5 (Cell Signaling Technology, 8540), anti-SQSTM1 (Progen Bioteknik, GP62-C), anti-COL10A1 (Quartett; GMBH, 1-CO097-05), biotin-conjugated anti-guinea pig, anti-rabbit and anti-mouse secondary antibodies (Jackson ImmunoResearch,106-065-003, 111-066-003 and 115-066-003, respectively), mouse anti-BrdU antibody (Sigma, B8434), biotinylated anti-mouse antibody (Jackson, 115-066-003), streptavidin-conjugated Alexa Fluor 546 (Life Technologies, S11225), fluorescently labeled anti-goat antibody (Jackson, 705165147) and fluorescently labeled anti-rabbit antibody (Jackson, 711545152). Additional reagents include the following: Weigerts hematoxylin (Sigma, H3136-25G), Fast Green (Sigma, F7258-25G), Safranin O solution (Sigma Aldrich, S8884-25G), sodium acetate anhydrous (Sigma S-2889), L-(+) tartaric acid (Sigma, T-6521), naphthol AS-BI phosphate (Sigma N-2125), pararosaniline chloride (Sigma, P-3750), sodium nitrite (Sigma, S-2252), 96-well micro-plates (Ibidi inc., 89626), TRIZOL (Life Technologies, 15596-026), High-Capacity RNA to cDNA kit (Life technologies, 4387406), Taqman® Fast Universal Master Mix (Life technologies, 4352042), and the StepOnePlus™ Real-Time PCR System (Life technologies, 4376600).
Cell culture
The RCJ3.1C5.18 nontransformed mesenchymal rat chondrogenic cell-line (C5.18) was obtained from Dr. Anna Spagnoli (Rush University Medical Center, Illinois, USA).18 C5.18 cells were maintained in minimal essential medium containing 15% FBS with 10−7 M dexamethasone (maintenance medium).34 Cells were seeded in maintenance medium, and once confluent were subsequently supplemented with ascorbic acid (50 µg/ml) and βGP (1 mM) to stimulate chondrogenic differentiation (C5.18 culture medium). C5.18 cells were differentiated for a minimum of 2 d (and were then referred to as C5.18 chondrocytes) prior to pharmacological treatment. For immunocytofluorescence C5.18 cells were grown on Ibidi 96-well micro-plates. Atg5-tet-off murine embryonic fibroblasts (MEFs) were provided by Prof. Boris Zhivotovsky (Karolinska Institutet) and were cultured in DMEM/F12 containing 10% FBS (MEF culture medium), and used with 10 ng/ml dox to inhibit Atg5 expression.20 Cells were treated with Baf, CQ, concanamycin, 3-MA or leupeptin (for 48 h unless otherwise stated). Single-cell suspensions from whole livers of 6-d-old mice were obtained as described.35 Cells were seeded at high density in DMEM/10% FBS and were confluent the following day when cells were treated with Baf. Cultures were maintained in 20 µg/ml or 50 µg/ml (typically for primary cells) gentamicin and were cultured at 37°C with 5% CO2, in a humidified atmosphere. Medium was changed every second or third d.
Osteoblast isolation and culture
Calvarial osteoblasts were extracted from 3-d-old mice and seeded as described.36 Briefly, calvaria were dissected from 3-d-old mice and whole calvaria cleaned of surface cells by incubating with pre-warmed 1 mg/ml collagenase type-II (Worthington Biochemical Corporation, 4174)/PBS (sterile filtered) for 10 min at 37°C (this digest was discarded). Calvaria were transferred to 1 mg/ml collagenase type-II/PBS (30 min), 4 mM EDTA (10 min) and 1 mg/ml collagenase type-II/PBS (30 min). After each digestion, cells were added to osteoblast culture medium (minimal essential medium containing 10% FBS) and stored at 37°C until all digestion steps were completed. Cells were then pelleted and plated at a density of 1.5 × 10⁴ cells/cm2 in osteoblast culture medium. Cultures were maintained in 50 µg/ml gentamicin and were cultured at 37°C with 5% CO2, in a humidified atmosphere. Medium was changed every 2–3 d. At confluence cells were treated with 2.5 mM βGP, 50 µg/ml ascorbic acid and Baf. All treatments with Baf were for 48 h, unless otherwise stated.
CTSB assay
Cells were grown on microscope cover glasses, which had been coated with rat-tail collagen. CTSB activity was assessed according to the manufacturer's instructions using the Magic Cathepsin B kit, and imaged using a 710 laser-scanning microscope (Zeiss, Jena, Germany).
Metatarsal culture
The 3 central metatarsal bones were micro-dissected from both hind-paws of 3.5 ± 0.5-d-old mice. For each comparison one paw (3 bones) was used for control and the contralateral paw (3 bones) was used for treatments; hence an average of bones from one paw was considered as one observation (one animal, one observation). Dissection was conducted aseptically in DMEM/F12 medium with 50 µg/ml gentamycin and bones were cultured for 6 d in DMEM/F12 medium supplemented with 0.2% bovine serum albumin, 1 mM βGP, 50 µg/ml ascorbic acid and 20 µg/ml gentamycin as previously described.16 Images of the cultured bones were captured using a stereo-microscope (Nikon SMZ-U) connected to a camera on d 0, 2, 4, and 6. Bone measurement was conducted using ImageJ software (NIH). IGF1 was used at a concentration of 100 ng/ml. Mice harboring a floxed Atg5 allele were obtained from Riken.37 Col2a1-driven Cre mice (Col2-Cre mice) were provided by Prof. H.M. Kronenberg (Massachusetts General Hospital).38 ATG5-deficient mice were obtained by crossing the 2 described strains, and metatarsal bones were obtained from those mice; control bones were obtained from Cre-negative littermates. For protein extracts, the middle dark zone was micro-dissected from cultured bones and discarded whereas the cartilaginous parts were lysed as described below.
In situ hybridization
Cultured metatarsal bones were fixed in 4% paraformaldehyde (PFA) overnight at 4°C, processed for dehydration, embedded in paraffin wax (Dalab, 40-0021-00) and cut into sections. In situ hybridization was performed as previously described39 using an in situ probe to Col10a1 (a generous gift from Prof. Bjorn Olsen, Harvard Medical School), labeled with digoxigenin according to the manufacturer's instructions (Roche).
Immunohistochemistry
Tissues were fixed in 4% PFA overnight at 4°C, processed for dehydration, embedded in paraffin wax and cut into sections. Dewaxed sections were rehydrated and antigen retrieval was performed by digestion with 5 mg/ml hyaluronidase in PBS for 30 min at 37°C (for COL10A1) or near-boiling citrate buffer (for SQSTM1 and p-RPS6). Endogenous peroxidase was blocked with 3% H2O2/methanol and then a blocking buffer (3% normal horse serum) was applied for one h. Slides were incubated overnight with antibodies to COL10A1 (1:100), SQSTM1 (1:1000) or p-RPS6 (1:500) applied at 4°C overnight. Visualization was made with corresponding biotinylated secondary antibodies followed by incubation with the ABC kit and 3, 3′-diaminobenzidine staining kit according to the manufacturer's instructions. Slides for direct comparison were developed side by side for the same amount of time to eliminate variation, and counterstained using a 1% alcian blue solution (in 3% acetic acid) before mounting.
Western blot
Cell monolayers were rinsed once with PBS, and lysed directly in 2x Laemmli buffer. Cartilage micro-dissected from metatarsal bones was homogenized prior to adding 2xLaemmli buffer. All samples were then sonicated, diluted with PBS, boiled, and SDS-polyacrylamide gel electrophoresis was performed. Proteins were transferred to PVDF membranes and blocked for 1 h with 5% nonfat milk. The membrane was incubated with primary antibodies for a minimum of 1 h and maximally overnight. Visualization was made by incubation with corresponding horseradish peroxidase-labeled secondary antibodies followed by chemiluminescence detection with ECL. Primary antibodies were detected by first incubating with a biotinylated secondary antibody following by the ABC kit with horseradish peroxidase-avidin or fluorochrome-avidin. Quantification was performed by densitometry using ImageJ.
Quantitative real-time, reverse-transcription PCR
RNA was extracted using the TRIZOL method according to the manufacturer's instructions. RNA was reverse transcribed using the High-Capacity RNA to cDNA kit. Quantitative PCR was performed with the Taqman® Fast Universal Master Mix and monitored with the StepOnePlus™ Real-Time PCR System. Taqman primers were obtained from Life Technologies. Expression of Acan (mouse, Mm00545794_m1; rat, Rn00573424_m1), Alpl (mouse, Mm00475834_m1; rat, Rn01516028_m1), Col1a1 (mouse, Mm00801666_g1; rat, Rn01463848), Col2a1 (mouse, Mm01309565_m1; rat, Rn01637087_m1) and Col10a1 (mouse, Mm00487041_m1; rat, Rn01408030_m1) were analyzed. Gapdh (mouse, 4352339E; rat, Rn01775763_g1) was used as a housekeeping gene. Results were normalized to Gapdh and to the control condition (ΔΔCt=((Ctgene of interest -CtGAPDH)sample- (Ctgene of interest -CtGAPDH)control). Values are reported as relative gene expression (2−ΔΔCT) or 2−ΔΔCT normalized to the control group.
Quantitative histology
Histomorphometric analysis was conducted following hematoxylin and eosin staining of sections. The size of the hypertrophic chondrocytes was calculated by taking an average of 25 measurements in the middle of the hypertrophic zone of the distal growth plate using ImageJ.16
Alcian blue staining of cultured cells
Alcian blue staining and quantification was performed as described previously.40 Quantification of colonies was performed using ImageJ by setting color and size thresholds.
Safranin O/Fast Green staining
Slides containing 5-µm paraffin-embedded sections were rehydrated and stained with Weigerts hematoxylin, dipped in a 1% HCl-70% ethanol solution and washed in distilled water. Slides were then stained with 0.02% Fast Green solution followed by a 1% acetic acid solution then, without rinsing, a 1% Safranin O solution. Slides were rinsed in 95% ethanol and dehydrated before mounting.
Immunocytofluorescence
Cultured cells were fixed in 4% PFA-PBS for 20 min at room temperature. Plates were rinsed in PBS and stored for no longer than 48 h at 4°C. All rinses and buffers were prepared in 5 mM MgCl2-PBS and incubations were for 5 min at room temperature unless otherwise stated. Wells were rinsed twice and permeabilized in 0.05% Triton X-100-PBS for 5 min. After rinsing, primary antibodies were diluted (FLCN (1/400) and LAMP2 [1/10]) in 5% normal horse serum and incubated for h. Following 4 rinses, wells incubated with the appropriate fluorescently labeled secondary antibody (1/400) in 5% normal horse serum for 40 min. Wells were rinsed and incubated with 0.5 µg/ml DAPI (4′,6-diamidino-2-phenylindole, dihydrochloride) for 12 min and finally rinsed 4 times. Cells were imaged using a Zeiss LSM710 confocal microscope within 48 h. Results were obtained from 3-4 images collected from the analysis of 3 separate experiments and images quantified using ImageJ software. Quantification of colonies was performed using ImageJ software by setting color thresholds. FLCN puncta were considered colocalized with LAMP2 if more than 1% of the identified region was positive for LAMP2.
ACP5/TRAP staining
Slides containing 5-µm paraffin-embedded sections were rehydrated and incubated at 37°C in prewarmed wash-buffer (0.92% sodium acetate solution, 1.14 % L-tartaric acid, 0.28% acetic acid, pH 5.0) containing 0.02% naphthol AS-BI phosphate, for 45 min. Slides were then placed in prewarmed (37°C) wash buffer containing 0.01% sodium nitrite and 0.01% pararosanaline chloride, and incubated at room temperature for 5 min. After rinsing twice with dH2O, sections were counterstained with 1% alcian blue in 0.1 M HCl solution. After further dH2O rinses, the slides were dehydrated and mounted. ACP5-positive cells were counted by eye per bone section.
Terminal deoxynucleotidyl transferase (TDT)-mediated deoxy-UTP nick end labeling (TUNEL) assay
A TUNEL assay was used to label apoptotic cells. Following dewaxing and rehydration, sections were treated with 10 μg/ml of proteinase K (Life technologies, AM2548) at 37°C for 30 min. Then slides were washed in PBS and the labeling reaction was performed according to the manufacturer's instructions (Fluorescein In situ cell death detection kit; Roche, 11684795910). Thereafter, nuclei were counterstained with DAPI. ImageJ was utilized to count fluorescein-labeled cells. The percentage of apoptotic cells was calculated as the number of fluorescein-labeled cells per DAPI-stained nucleus.
Bromodeoxyuridine (BrdU) labeling and detection
For BrdU labeling, culture media was supplemented with BrdU (25 µg/ml) and metatarsals bones were cultured for 4 h prior to fixation. Following dewaxing and rehydration, sections were incubated with 1.5 N HCl for 1 h and later digested with 0.1 % trypsin (Sigma, T6567) for 45 min. Then sections were blocked with normal horse serum followed by incubation with mouse anti-BrdU antibody (1:500) overnight and biotinylated anti-mouse antibody for 1 h and streptavidin-conjugated Alexa Fluor 546 for 1 h. Thereafter, nuclei were counterstained with DAPI. ImageJ was utilized to count fluorescein-labeled cells. The percentage of proliferative cells was calculated as the number of fluorescein-labeled cells per DAPI-stained nucleus.
GAG-secretion assay
A fraction of the medium was saved from undifferentiated C5.18 cells following 4 d in culture, differentiated C5.18 chondrocytes following 8 d of culture or metatarsals after 3 d in culture, and stored at −20°C until analysis. GAGs were quantified using the dimethy L-methylene blue (DMMB) technique as described.41
Statistics
For metatarsal bones each observation (n) was considered as an average of 3 bones from the same animal. At least 3 animals were analyzed for every experiment. Data were presented as mean values ± SEM. Statistical analysis was done by unpaired Student t test for 2 groups, one-way ANOVA for more than 2 groups, and 2-way ANOVA when there were 2 variables using GraphPad Prism V software (GraphPad Software Inc., *p < 0.05, **p < 0.01, ***p < 0.001). A Bonferoni post-hoc test was used to analyze individual differences following 2-way ANOVAs.
Ethical statement
All animal studies were approved by the local ethics committee (Dnr: N42/13) at Karolinska Institutet and all the animal studies were conducted according to the Swedish National Board for laboratory animals.
Disclosure of Potential Conflicts of Interest
No potential conflicts of interest were disclosed.
Acknowledgments
We thank Prof. Boris Zhivotovsky and Dr. Vitaliy Kaminskyy for valuable advice.
Funding
This study was supported by Sällskapet Barnavård, HKH Kronprinsessan Lovisas förening för Barnasjukvård, Jeanssons stiftelser, Åke-Wiberg Stiftelse, Karolinska Institutet and Swedish Research Council Grant #521-2012-1543. In addition Phillip T Newton was supported by Tore Nilsons Stiftelse for medical research (SEB stiftelser) and the Shizu Matsumura donation.
Supplemental Material
Supplemental data for this article can be accessed on the publisher's website.
References
- 1.Laplante M, Sabatini DM. mTOR Signaling in Growth Control and Disease. Cell 2012; 149:274-93; PMID:22500797; http://dx.doi.org/ 10.1016/j.cell.2012.03.017 [DOI] [PMC free article] [PubMed] [Google Scholar]
- 2.Jung CH, Jun CB, Ro S-H, Kim Y-M, Otto NM, Cao J, Kundu M, Kim D-H. ULK-Atg13-FIP200 Complexes Mediate mTOR Signaling to the Autophagy Machinery. Mol Biol Cell 2009; 20:1992-2003; PMID:19225151; http://dx.doi.org/ 10.1091/mbc.E08-12-1249 [DOI] [PMC free article] [PubMed] [Google Scholar]
- 3.Hosokawa N, Hara T, Kaizuka T, Kishi C, Takamura A, Miura Y, Iemura S, Natsume T, Takehana K, Yamada N, et al.. Nutrient-dependent mTORC1 Association with the ULK1–Atg13–FIP200 Complex Required for Autophagy. Mol Biol Cell 2009; 20:1981-91; PMID:19211835; http://dx.doi.org/ 10.1091/mbc.E08-12-1248 [DOI] [PMC free article] [PubMed] [Google Scholar]
- 4.Bar-Peled L, Sabatini DM. Regulation of mTORC1 by amino acids. Trends Cell Biol 2014; 24:400-6; PMID:24698685; http://dx.doi.org/ 10.1016/j.tcb.2014.03.003 [DOI] [PMC free article] [PubMed] [Google Scholar]
- 5.Saftig P, Klumperman J. Lysosome biogenesis and lysosomal membrane proteins: trafficking meets function. Nat Rev Mol Cell Biol 2009; 10:623-35; PMID:19672277; http://dx.doi.org/ 10.1038/nrm2745 [DOI] [PubMed] [Google Scholar]
- 6.Forgac M. Vacuolar ATPases: rotary proton pumps in physiology and pathophysiology. Nat Rev Mol Cell Biol 2007; 8:917-29; PMID:17912264; http://dx.doi.org/ 10.1038/nrm2272 [DOI] [PubMed] [Google Scholar]
- 7.Shao E, Forgac M. Involvement of the Nonhomologous Region of Subunit A of the Yeast V-ATPase in Coupling and in Vivo Dissociation. J Biol Chem 2004; 279:48663-70; PMID:15355963; http://dx.doi.org/ 10.1074/jbc.M408278200 [DOI] [PubMed] [Google Scholar]
- 8.Yang Y, Hu L, Zheng H, Mao C, Hu W, Xiong K, Wang F, Liu C. Application and interpretation of current autophagy inhibitors and activators. Acta Pharmacol Sin 2013; 34:625-35; PMID:23524572; http://dx.doi.org/ 10.1038/aps.2013.5 [DOI] [PMC free article] [PubMed] [Google Scholar]
- 9.Zoncu R, Bar-Peled L, Efeyan A, Wang S, Sancak Y, Sabatini DM. mTORC1 Senses Lysosomal Amino Acids Through an Inside-Out Mechanism That Requires the Vacuolar H+-ATPase. Sci 2011; 334:678-83; PMID:22053050; http://dx.doi.org/ 10.1126/science.1207056 [DOI] [PMC free article] [PubMed] [Google Scholar]
- 10.Mackie EJ, Tatarczuch L, Mirams M. The skeleton: a multi-functional complex organ. The growth plate chondrocyte and endochondral ossification. J Endocrinol 2011; 211:109-21; PMID:21642379; http://dx.doi.org/ 10.1530/JOE-11-0048 [DOI] [PubMed] [Google Scholar]
- 11.Phornphutkul C, Wu K-Y, Auyeung V, Chen Q, Gruppuso PA. mTOR signaling contributes to chondrocyte differentiation. Dev Dyn 2008; 237:702-12; PMID:18265001; http://dx.doi.org/ 10.1002/dvdy.21464 [DOI] [PMC free article] [PubMed] [Google Scholar]
- 12.Phornphutkul C, Lee M, Voigt C, Wu K-Y, Ehrlich MG, Gruppuso PA, Chen Q. The effect of rapamycin on bone growth in rabbits. J Orthop Res 2009; 27:1157-61; PMID:19382193; http://dx.doi.org/ 10.1002/jor.20894 [DOI] [PMC free article] [PubMed] [Google Scholar]
- 13.Chen J, Long F. mTORC1 signaling controls mammalian skeletal growth through stimulation of protein synthesis. Dev 2014; 141:2848-54; PMID:24948603; http://dx.doi.org/ 10.1242/dev.108811 [DOI] [PMC free article] [PubMed] [Google Scholar]
- 14.Lai LP, Lilley BN, Sanes JR, McMahon AP. Lkb1/Stk11 regulation of mTOR signaling controls the transition of chondrocyte fates and suppresses skeletal tumor formation. Proc Natl Acad Sci USA 2013; 110:19450-5; PMID:24218567; http://dx.doi.org/ 10.1073/pnas.1309001110 [DOI] [PMC free article] [PubMed] [Google Scholar]
- 15.Shapiro IM, Layfield R, Lotz M, Settembre C, Whitehouse C. Boning up on autophagy: The role of autophagy in skeletal biology. Autophagy 2014; 10:7-19; PMID:24225636; http://dx.doi.org/ 10.4161/auto.26679 [DOI] [PMC free article] [PubMed] [Google Scholar]
- 16.Chagin AS, Karimian E, Sundström K, Eriksson E, Sävendahl L. Catch-up growth after dexamethasone withdrawal occurs in cultured postnatal rat metatarsal bones. J Endocrinol 2010; 204:21-9; PMID:19815587; http://dx.doi.org/ 10.1677/JOE-09-0307 [DOI] [PubMed] [Google Scholar]
- 17.Bjørkøy G, Lamark T, Pankiv S, Øvervatn A, Brech A, Johansen T. Monitoring autophagic degradation of p62/SQSTM1. Methods Enzymol 2009; 452:181-97; PMID:19200883; http://dx.doi.org/ 10.1016/S0076-6879(08)03612-4 [DOI] [PubMed] [Google Scholar]
- 18.Spagnoli A, Hwa V, Horton WA, Lunstrum GP, Roberts CT, Chiarelli F, Torello M, Rosenfeld RG. Antiproliferative effects of insulin-like growth factor-binding protein-3 in mesenchymal chondrogenic cell line rcj3.1c5.18: relationship to differentiation stage. J Biol Chem 2001; 276:5533-40; PMID:11110782; http://dx.doi.org/ 10.1074/jbc.M005088200 [DOI] [PubMed] [Google Scholar]
- 19.Sarbassov DD, Guertin DA, Ali SM, Sabatini DM. Phosphorylation and regulation of akt/pkb by the Rictor-MTOR complex. Sci 2005; 307:1098-101; PMID:15718470; http://dx.doi.org/ 10.1126/science.1106148 [DOI] [PubMed] [Google Scholar]
- 20.Hosokawa N, Hara Y, Mizushima N. Generation of cell lines with tetracycline-regulated autophagy and a role for autophagy in controlling cell size. FEBS Lett 2007; 581:2623-9; PMID:17553497 [DOI] [PubMed] [Google Scholar]
- 21.Scott RP, Ninjoor V, Srivastava PN. Isolation and characterization of cathepsin B from rabbit testis. J Reprod Fertil 1987; 79:67-74; PMID:3820185; http://dx.doi.org/ 10.1530/jrf.0.0790067 [DOI] [PubMed] [Google Scholar]
- 22.Tsun Z-Y, Bar-Peled L, Chantranupong L, Zoncu R, Wang T, Kim C, Spooner E, Sabatini DM. The Folliculin Tumor Suppressor Is a GAP for the RagC/D GTPases That Signal Amino Acid Levels to mTORC1. Mol Cell 2013; 52:495-505; PMID:24095279; http://dx.doi.org/ 10.1016/j.molcel.2013.09.016 [DOI] [PMC free article] [PubMed] [Google Scholar]
- 23.Vuppalapati KK, Bouderlique T, Newton PT, Kaminskyy V, Wehtje H, Ohlsson C, Zhivotovsky B, Chagin AS. Targeted deletion of autophagy genes Atg5 or Atg7 in the chondrocytes promotes Caspase-dependent cell death and leads to mild growth retardation. J bone Miner Res 2015; PMID:26077727 [DOI] [PubMed] [Google Scholar]
- 24.Bar-Peled L, Schweitzer LD, Zoncu R, Sabatini DM. Ragulator is a GEF for the rag GTPases that signal amino acid levels to mTORC1. Cell 2012; 150:1196-208; PMID:22980980; http://dx.doi.org/ 10.1016/j.cell.2012.07.032 [DOI] [PMC free article] [PubMed] [Google Scholar]
- 25.Carraro-Lacroix L, Hu Y, Owen C, Voronov I. mTORC1 Activity in Osteoclasts is Regulated by Lysosomal pH. J Bone Min Res 2014; 29:(Suppl.1). Available from: http://www.asbmr.org/education/AbstractDetail?aid=d23f34cd-6caa-42c2-b91c-a732befc3e28 [Google Scholar]
- 26.Sancak Y, Peterson TR, Shaul YD, Lindquist RA, Thoreen CC, Bar-Peled L, Sabatini DM. The Rag GTPases Bind Raptor and Mediate Amino Acid Signaling to mTORC1. Sci 2008; 320:1496-501; PMID:18497260; http://dx.doi.org/ 10.1126/science.1157535 [DOI] [PMC free article] [PubMed] [Google Scholar]
- 27.Duran A, Amanchy R, Linares JF, Joshi J, Abu-Baker S, Porollo A, Hansen M, Moscat J, Diaz-Meco MT. p62 is a key regulator of nutrient sensing in the mTORC1 pathway. Mol Cell 2011; 44:134-46; PMID:21981924; http://dx.doi.org/ 10.1016/j.molcel.2011.06.038 [DOI] [PMC free article] [PubMed] [Google Scholar]
- 28.Bar-Peled L, Chantranupong L, Cherniack AD, Chen WW, Ottina KA, Grabiner BC, Spear ED, Carter SL, Meyerson M, Sabatini DM. A Tumor Suppressor Complex with GAP Activity for the Rag GTPases That Signal Amino Acid Sufficiency to mTORC1. Sci 2013; 340:1100-6; PMID:23723238; http://dx.doi.org/ 10.1126/science.1232044 [DOI] [PMC free article] [PubMed] [Google Scholar]
- 29.Demetriades C, Doumpas N, Teleman AA. Regulation of TORC1 in response to amino acid starvation via lysosomal recruitment of TSC2. Cell 2014; 156:786-99; PMID:24529380; http://dx.doi.org/ 10.1016/j.cell.2014.01.024 [DOI] [PMC free article] [PubMed] [Google Scholar]
- 30.Li M, Khambu B, Zhang H, Kang J-H, Chen X, Chen D, Vollmer L, Liu P-Q, Vogt A, Yin X-M. Suppression of Lysosome Function Induces Autophagy via a Feedback Down-regulation of MTOR Complex 1 (MTORC1) Activity. J Biol Chem 2013; 288:35769-80; PMID:24174532; http://dx.doi.org/ 10.1074/jbc.M113.511212 [DOI] [PMC free article] [PubMed] [Google Scholar]
- 31.Zhou J, Tan S-H, Nicolas V, Bauvy C, Yang N-D, Zhang J, Xue Y, Codogno P, Shen H-M. Activation of lysosomal function in the course of autophagy via mTORC1 suppression and autophagosome-lysosome fusion. Cell Res 2013; 23:508-23; PMID:23337583; http://dx.doi.org/ 10.1038/cr.2013.11 [DOI] [PMC free article] [PubMed] [Google Scholar]
- 32.Korolchuk VI, Saiki S, Lichtenberg M, Siddiqi FH, Roberts EA, Imarisio S, Jahreiss L, Sarkar S, Futter M, Menzies FM, et al.. Lysosomal positioning coordinates cellular nutrient responses. Nat Cell Biol 2011; 13:453-60; PMID:21394080; http://dx.doi.org/ 10.1038/ncb2204 [DOI] [PMC free article] [PubMed] [Google Scholar]
- 33.Klionsky DJ, Baehrecke EH, Brumell JH, Chu CT, Codogno P, Cuervo AM, Debnath J, Deretic V, Elazar Z, Eskelinen E-L, et al.. A comprehensive glossary of autophagy-related molecules and processes (2nd edition). Autophagy 2011; 7:1273-94; PMID:21997368; http://dx.doi.org/ 10.4161/auto.7.11.17661 [DOI] [PMC free article] [PubMed] [Google Scholar]
- 34.Lunstrum GP, Keene DR, Weksler NB, Cho Y-J, Cornwall M, Horton WA. Chondrocyte Differentiation in a Rat Mesenchymal Cell Line. J Histochem Cytochem 1999; 47:1-6; PMID:9857207; http://dx.doi.org/ 10.1177/002215549904700101 [DOI] [PubMed] [Google Scholar]
- 35.Narumi K, Ashizawa K, Takashima R, Takasawa H, Katayama S, Tsuzuki Y, Tatemoto H, Morita T, Hayashi M, Hamada S. Development of a repeated-dose liver micronucleus assay using adult rats: an investigation of diethylnitrosamine and 2,4-diaminotoluene. Mutat Res 2012; 747:234-9; PMID:22677510; http://dx.doi.org/ 10.1016/j.mrgentox.2012.05.012 [DOI] [PubMed] [Google Scholar]
- 36.Prideaux M, Loveridge N, Pitsillides AA, Farquharson C. Extracellular Matrix Mineralization Promotes E11/gp38 Glycoprotein Expression and Drives Osteocytic Differentiation. PLoS One 2012; 7:e36786; PMID:22586496; http://dx.doi.org/ 10.1371/journal.pone.0036786 [DOI] [PMC free article] [PubMed] [Google Scholar]
- 37.Hara T, Nakamura K, Matsui M, Yamamoto A, Nakahara Y, Suzuki-Migishima R, Yokoyama M, Mishima K, Saito I, Okano H, et al.. Suppression of basal autophagy in neural cells causes neurodegenerative disease in mice. Nature 2006; 441:885-9; PMID:16625204; http://dx.doi.org/ 10.1038/nature04724 [DOI] [PubMed] [Google Scholar]
- 38.Kobayashi T, Chung U, Schipani E, Starbuck M, Karsenty G, Katagiri T, Goad DL, Lanske B, Kronenberg HM. PTHrP and Indian hedgehog control differentiation of growth plate chondrocytes at multiple steps. Dev 2002; 129:2977-86; PMID:12050144 [DOI] [PubMed] [Google Scholar]
- 39.Chagin AS, Vuppalapati KK, Kobayashi T, Guo J, Hirai T, Chen M, Offermanns S, Weinstein LS, Kronenberg HM. G-protein stimulatory subunit α and Gq/11α G-proteins are both required to maintain quiescent stem-like chondrocytes. Nat Commun 2014; 5:3673; PMID:24781502; http://dx.doi.org/ 10.1038/ncomms4673 [DOI] [PMC free article] [PubMed] [Google Scholar]
- 40.Newton PT, Staines KA, Spevak L, Boskey AL, Teixeira CC, MacRae VE, Canfield AE, Farquharson C. Chondrogenic ATDC5 cells: An optimised model for rapid and physiological matrix mineralisation. Int J Mol Med 2012; 30:1187; PMID:22941229 [DOI] [PMC free article] [PubMed] [Google Scholar]
- 41.Farndale RW, Buttle DJ, Barrett AJ. Improved quantitation and discrimination of sulphated glycosaminoglycans by use of dimethylmethylene blue. Biochim Biophys Acta 1986; 883:173-7; PMID:3091074; http://dx.doi.org/ 10.1016/0304-4165(86)90306-5 [DOI] [PubMed] [Google Scholar]
Associated Data
This section collects any data citations, data availability statements, or supplementary materials included in this article.