

Abstract
Background
The immunological status, consisting of “inflammation status” and “nutritional condition,” is important for the survival of patients with various cancers, including non-small cell lung cancer (NSCLC). The neutrophil/lymphocyte ratio (NLR) reflects the inflammation status, and the prognostic nutritional index (PNI) reflects the immunological nutritional condition. In the present study, the correlation between the NLR and the PNI as well as the consistency and magnitude of the prognostic impact of the NLR and the PNI were investigated.
Methods
We conducted a retrospective review of data from 334 patients who had undergone a curative resection for NSCLC. The NLR and the PNI were calculated, which was routinely performed before surgery. The correlations between the NLR and the PNI and survival were then evaluated.
Results
A clear inverse correlation was observed between the NLR and the PNI. The NLR was associated with sex, smoking history, the CEA level, tumor size, and vascular invasion. The PNI was associated with sex, age, smoking history, tumor size, histological type, tumor differentiation, and vascular invasion. Patients with NLR ≥2.5 had a significantly poorer survival outcome, and patients with PNI <50 had a significantly poorer survival outcome. A multivariate analysis demonstrated that age, nodal metastasis, tumor differentiation, NLR, and PNI were independent predictors of disease-free and overall survival.
Conclusions
Our study demonstrated a significant inverse correlation between the NLR and the PNI, and a high NLR and a low PNI were significantly associated with a poor survival among patients who had undergone a complete resection for NSCLC.
Keywords: Non-small cell lung cancer, Neutrophil/lymphocyte ratio (NLR), Prognostic nutritional index (PNI)
Background
Lung cancer is a major cause of death in many developed countries. Surgical resection continues to play an important role in the treatment of this disease, especially during the early stages of non-small cell lung cancer (NSCLC). Over the past few decades, a number of prognostic factors for NSCLC patients following resection have been investigated. Until now, the anatomic extent of the tumor (TNM classification) has been regarded as the most powerful tool for predicting patient prognosis [1]. On the other hand, several biomarkers have been reported as predictors of survival and recurrence: (1) clinical factors (e.g., sex, age, or performance status); (2) pathological factors (e.g., histological subtype, cell differentiation, or visceral pleural invasion; and (3) many biological factors involved in cancer development and progression [2, 3].
Recently, several investigators have reported that the immunological status, consisting of the “inflammation status” and the “nutritional condition,” is important for the survival of patients with various cancers, including NSCLC. First, increasing evidence regarding the “inflammation status” has shown that the systematic inflammatory response has prognostic value for patients with various cancers [4, 5]. In particular, the neutrophil/lymphocyte ratio (NLR) has been recognized as a predictor of a poor prognosis. For NSCLC, several reports have described evidence of the prognostic value of the NLR [6–12]. Second, evidence regarding the impact of the “nutritional condition” has also been increasing. Above all, the prognostic nutritional index (PNI), which is calculated by combining the serum albumin concentration with the total peripheral blood lymphocyte count, was initially used to assess the immune-nutritional status of patients receiving gastrointestinal surgery [13]. Several reports have been shown that the PNI is a prognostic marker in patients with various cancers, including cancer of the esophagus, stomach, colorectal, pancreas, and malignant pleural mesothelioma [14–18]. Moreover, the PNI can predict the prognosis of patients with cancer regardless of the site of origin [19]. However few studies examining the PNI in patients with NSCLC have been performed [20].
To our knowledge, the clinical impacts of both the NLR and the PNI have not yet been investigated simultaneously. In the present study, we investigated the correlation between the NLR and the PNI as well as the consistency and magnitude of the prognostic impact of the NLR and the PNI among patients who had undergone a complete resection for NSCLC.
Methods
Patient population
We conducted this retrospective study in a total of 334 patients with NSCLC who underwent surgery at the Kawasaki Medical School Hospital between 2007 and 2012. All the patients included in the analysis met the following criteria: (1) curative resection (segmentectomy or lobectomy) with lymph node dissection; (2) neither radiotherapy nor chemotherapy administered prior to the surgery; and (3) preoperative NLR and PNI obtained before surgery. The histological diagnosis of the tumors was based on the criteria of the World Health Organization, and the TNM stage was determined according to the criteria established in 2009. This study was conducted with the approval of the institutional Ethics Committee of Kawasaki Medical School (No. 1803: approved on May 12, 2014).
NLR and PNI evaluation
The NLR and the PNI were calculated using data from a complete blood count that was routinely performed before surgery. The receiver operating characteristic (ROC) curves identified a NLR cutoff value of 2.5 for predicting recurrence in patients (area under the curve (AUC) = 0.63, 95 % CI: 0.56–0.69, P < 0.001). In addition, based on a previous study, the data were dichotomized using a NLR cutoff value of 2.5 [10]. The PNI was calculated as 10 × serum albumin (g/dL) + 0.005 × total lymphocyte count (per millimeter) [13]. The PNI value of at least 50 was defined as normal, while less than 50 was regarded as mild malnutrition, less than 45 was regarded as moderate to severe malnutrition, and less than 40 was regarded as serious malnutrition [15]. The cutoff value of the PNI for clinically significant malnutrition was set at below 50 in this study.
Follow-up
The follow-up examination schedule was arranged on an individual basis; most of the patients received medical check-ups and chest x-ray films or CT scans at least twice per year. The last follow-up review was performed on June 30, 2014. The median follow-up duration for the detection of disease-free survival (DFS) or overall survival (OS) was 32.0 months (range 3–72 months).
Statistical analysis
All the statistical analyses were performed using the SPSS statistical package (version 17.0; SPSS, Chicago, IL). Categorical data were examined using the χ2 test. ROC curves of the NLR and PNI for the prediction of DFS or OS were generated to determine the cutoff value that yielded an optimal sensitivity and specificity. The prognostic evaluation was performed by considering the OS and DFS, which was defined as the time until lung cancer recurrence, the occurrence of a second cancer, or non-lung cancer-related death. The survival curves were estimated using the Kaplan-Meier method, and differences among the curves were evaluated using the log-rank test. Univariate and multivariate analyses were performed using the Cox proportional hazards model. Two-sided P values of less than 0.05 were considered statistically significant.
Results
Patient characteristics
The patients ranged in age from 46 to 88 years (mean, 69.3 years). There were 219 men and 115 women. The majority of patients (231, 69.1 %) had adenocarcinoma, while 69 (20.7 %) had squamous cell carcinoma, 22 (6.6 %) had large cell carcinoma, and 12 (3.6 %) had other histological types. Pathological N0 disease was confirmed in 270 patients (80.8 %), and N1 or N2 disease was confirmed in 64 patients (19.2 %). Pathological stage I disease was confirmed in 239 patients (71.5 %), and stage II or stage III disease was confirmed in 95 patients (28.5 %).
Association between NLR/PNI value and clinicopathological findings
The NLR values of the patients ranged from 0.67 to 15.49 (mean, 2.52; median, 1.97). The mean NLR was not associated with age, smoking history, histological type, tumor differentiation, or pathological stage. On the other hand, the PNI values of the patients ranged from 28.20 to 65.25 (mean, 51.0; median, 50.80). The mean PNI was significantly lower among patients who were older, former and current smokers, and those with squamous cell carcinoma (Table 1). A significant inverse correlation was observed between the NLR and PNI values (r = −0.490, P < 0.001) (Fig. 1).
Table 1.
Association between NLR/PNI value and clinicopathological findings
| Number | NLR | PNI | |
|---|---|---|---|
| All cases | 334 | 2.52 ± 2.06 | 51.03 ± 5.72 |
| Age | |||
| ≦70 | 165 | 2.34 ± 1.91 | 52.20 ± 5.38* |
| >70 | 169 | 2.69 ± 2.18 | 49.59 ± 5.70* |
| Smoking history | |||
| Never | 122 | 2.27 ± 1.69 | 52.32 ± 5.00**, *** |
| Former | 116 | 2.69 ± 2.41 | 49.70 ± 5.65** |
| Current | 95 | 2.64 ± 1.99 | 50.97 ± 6.36*** |
| Histology | |||
| Adenocarcinoma | 231 | 2.43 + 2.07 | 51.87 + 5.17**** |
| Squamous cell carcinoma | 69 | 2.80 + 2.30 | 48.22 + 6.49**** |
| Large cell carcinoma | 22 | 2.84 + 1.42 | 49.55 + 6.38 |
| Adenosquamous carcinoma | 6 | 2.01 + 0.61 | 52.49 + 2.39 |
| Pleomorphic carcinoma | 6 | 1.90 + 0.93 | 55.07 + 6.92 |
| Tumor differentiation | |||
| Well | 118 | 2.39 + 2.12 | 51.82 + 4.70 |
| Moderate | 115 | 2.55 + 2.29 | 50.96 + 6.12 |
| Poor | 101 | 2.59 + 1.70 | 50.23 + 6.30 |
| Pathological stage | |||
| IA | 144 | 2.40 + 2.13 | 51.74 + 5.33 |
| IB | 95 | 2.54 + 1.68 | 50.30 + 6.00 |
| IIA+IIB | 55 | 2.60 + 2.21 | 50.30 + 5.50 |
| IIIA+IIIB | 40 | 2.75 + 2.37 | 51.18 + 6.58 |
NLR neutrophil/lymphocyte ratio, PNI prognostic nutritional index
*, **, ****p < 0.01
***p < 0.05
Fig. 1.
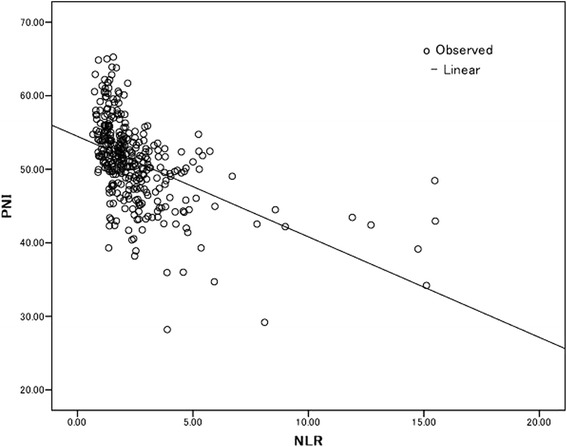
Correlation between the NLR and the PNI (r = −0.490, P < 0.001)
Clinicopathological characteristics grouped according to NLR and PNI statuses
We used an ROC curve analysis to evaluate whether the NLR and PNI could predict DFS or OS (Fig. 2). The ROC curves identified an optimal NLR cutoff value of 2.5 for predicting DFS or OS in patients (DFS; AUC = 0.63, P = 0.001, OS; AUC = 0.62, P = 0.002). The ROC curves identified an optimal PNI cutoff value of 50 for predicting DFS or OS in patients (DFS; AUC = 0.62, P = 0.001, OS; AUC = 0.64, P < 0.001). We divided the patient population based on a NLR and PNI cutoff value of 2.5 and 50 for the patients. All the clinicopathological characteristics were comparable between patients according to their NLR or PNI statuses (Table 2). Our study showed that the NLR was associated with sex, smoking history, the CEA level, tumor size, and vascular invasion. On the other hand, the PNI was associated with sex, age, smoking history, tumor size, histological type, tumor differentiation, and vascular invasion. Interestingly, nodal metastasis was not associated with either the NLR or the PNI.
Fig. 2.
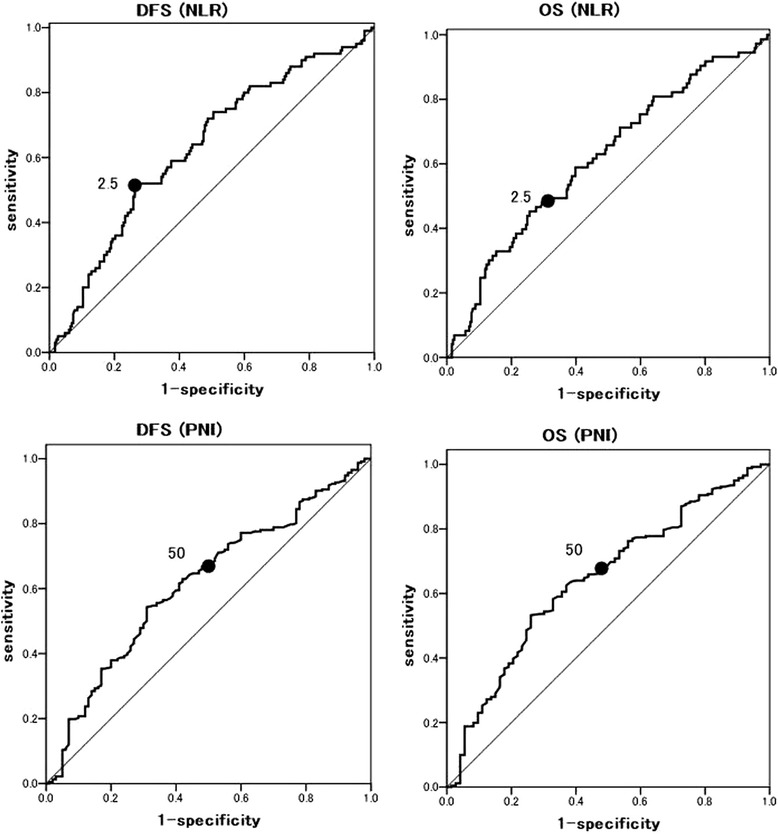
Receiver operating characteristics (ROC) curve for predicting disease-free survival (DFS) or overall survival (OS). DFS-NLR: AUC 0.63(95 % CI 0.56–0.69) P = 0.001. OS-NLR: AUC 0.62 (95 % CI 0.54–0.69) P = 0.002. DFS-PNI: AUC 0.62 (95 % CI 0.55–0.68) P = 0.001. OS-PNI: AUC 0.64 (95 % CI 0.57–0.72) P < 0.001
Table 2.
Clinicopathological characteristics grouped by NLR and PNI status
| Cases | NLR | PNI | |||||
|---|---|---|---|---|---|---|---|
| <2.5 | ≥2.5 | P value | <50 | ≥50 | P value | ||
| Sex | |||||||
| Female | 121 | 88 | 33 | 0.038 | 36 | 85 | 0.002 |
| Male | 213 | 131 | 82 | 100 | 113 | ||
| Age | |||||||
| ≦70 | 165 | 116 | 49 | 0.072 | 45 | 120 | <0.001 |
| >s70 | 169 | 103 | 66 | 91 | 78 | ||
| Smoking history | |||||||
| Never | 123 | 90 | 33 | 0.026 | 39 | 84 | 0.010 |
| Smoker | 211 | 129 | 82 | 97 | 114 | ||
| CEA | |||||||
| Normal | 231 | 165 | 66 | 0.001 | 87 | 144 | 0.089 |
| High | 103 | 54 | 49 | 49 | 54 | ||
| Tumor size | |||||||
| T1 | 161 | 116 | 45 | 0.016 | 51 | 110 | 0.001 |
| T2 + 3 | 173 | 103 | 70 | 85 | 88 | ||
| Nodal metastasis | |||||||
| Negative | 270 | 181 | 89 | 0.246 | 110 | 160 | 0.986 |
| Positive | 64 | 38 | 26 | 26 | 38 | ||
| Histological type | |||||||
| Adenoca | 231 | 159 | 72 | 0.060 | 81 | 150 | 0.002 |
| Non-adenoca | 103 | 60 | 43 | 55 | 48 | ||
| Tumor differentiation | |||||||
| Well | 118 | 85 | 33 | 0.066 | 39 | 79 | 0.035 |
| Mod + por | 216 | 134 | 82 | 97 | 119 | ||
| Vascular invasion | |||||||
| Negative | 190 | 139 | 51 | 0.001 | 68 | 122 | 0.035 |
| Positive | 144 | 80 | 64 | 68 | 76 | ||
| NLR | – | ||||||
| <2.5 | 220 | – | – | 54 | 165 | <0.001 | |
| ≥2.5 | 114 | – | – | 82 | 33 | ||
| PNI | – | ||||||
| <50 | 136 | 54 | 82 | <0.001 | – | – | |
| ≥50 | 198 | 165 | 33 | – | – | ||
NLR neutrophil/lymphocyte ratio, PNI prognostic nutritional index, adenoca adenocarcinoma, mod+por moderate+poorly
Surgical factors and recurrence grouped by NLR and PNI status
The surgical factors and recurrence were comparable between patients according to their NLR or PNI statuses (Table 3). In this study, no patient had received pneumonectomy because all patients who had gone pneumonectomy between 2007 and 2012 had received induction chemotherapy or chemoradiotherapy and excluded from this study. Significant associations of the NLR ≥2.5 or PNI <50 were observed with the rate of thoracotomy (P = 0.044) but not with the type of resection (P = 0.997). Significant associations of the NLR ≥2.5 or PNI <50 were observed with the rate of recurrence; however, significant associations were not observed with the first recurrence site (local or distant metastasis).
Table 3.
Surgical factor and recurrence grouped by NLR and PNI status
| Cases | NLR | PNI | ||||
|---|---|---|---|---|---|---|
| <2.5 | ≥2.5 | P value | <50 | ≥50 | P value | |
| Type of resection | ||||||
| Segmentectomy | 33 | 17 | 0.997 | 20 | 30 | 0.959 |
| Lobectomy | 186 | 98 | 135 | 196 | ||
| Surgical Approach | ||||||
| VATS | 142 | 64 | 0.044 | 74 | 132 | 0.005 |
| Thoracotomy | 77 | 51 | 62 | 66 | ||
| Recurrence | ||||||
| Negative | 173 | 77 | 0.016 | 90 | 160 | 0.003 |
| Positive | 46 | 38 | 46 | 38 | ||
| First recurrence site | ||||||
| Local | 15 | 12 | 0.154 | 11 | 16 | 0.193 |
| Distant | 24 | 19 | 27 | 16 | ||
| Both | 7 | 7 | 8 | 6 | ||
NLR neutrophil/lymphocyte ratio, PNI prognostic nutritional index, VATS video-assisted thoracic surgery
Prognostic analysis
The 3-year DFS was 71.5 % in this study. Patients with NLR ≥2.5 had a significantly poorer survival outcome, compared with those with NLR < 2.5 (78.7 vs. 58.0 %, P < 0.001, according to the log-rank test; Fig. 3a). On the other hand, patients with PNI <50 had a significant poorer survival outcome, compared with those with PNI ≥50 (80.4 vs. 58.3 %, P < 0.001, according to the log-rank test; Fig. 3b). A univariate analysis showed that age, tumor size, nodal metastasis, tumor differentiation, the NLR, and the PNI were predictors of the DFS. A multivariate analysis was then performed using the Cox proportional hazards model. Using this model, we demonstrated that age (P = 0.004) and nodal metastasis (P < 0.001), tumor differentiation (P = 0.047), the NLR (P = 0.039), and the PNI (P = 0.007) were independent predictors of the DFS (Table 4). Overall survival (OS) data are immature, but a multivariate analysis suggested that age, nodal metastasis, NLR, and PNI were independent predictors of OS (Table 4).
Fig. 3.
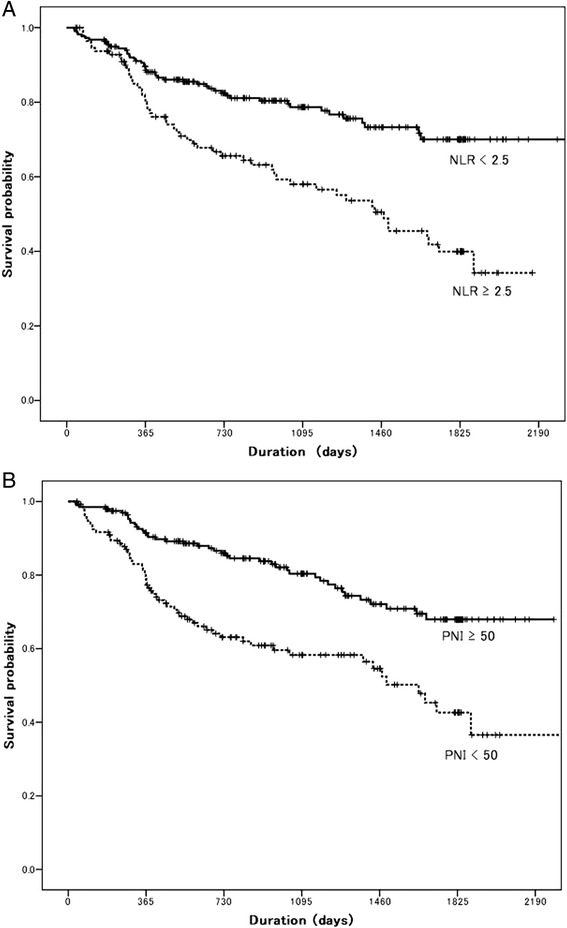
a Kaplan-Meier disease-free survival curve according to the NLR: log-rank P < 0.001. b Kaplan-Meier disease-free survival curve according to the PNI: log-rank P < 0.001
Table 4.
Multivariate analysis of factors predicting disease-free and overall survival
| Disease-free survival | ||||||
|---|---|---|---|---|---|---|
| Univariate | Multivariate | |||||
| HR | 95 % CI | P value | HR | 95 % CI | P value | |
| Sex | ||||||
| Male/female | 1.70 | 1.08–2.69 | 0.023 | 1.37 | 0.85–2.19 | 0.187 |
| Age | ||||||
| >70/≦70 | 2.42 | 1.58–3.71 | <0.001 | 1.94 | 1.24–3.04 | 0.004 |
| Tumor size | ||||||
| T2–3/T1 | 2.25 | 1.47–3.45 | <0.001 | 1.14 | 0.74–1.76 | 0.560 |
| Nodal metastasis | ||||||
| Positive/negative | 6.50 | 4.30–9.80 | <0.001 | 6.42 | 4.16–9.89 | <0.001 |
| Histological type | ||||||
| AD/non-AD | 1.45 | 0.95–2.20 | 0.083 | 0.72 | 0.46–1.13 | 0.150 |
| Tumor differentiation | ||||||
| Mod+por/well | 2.71 | 1.65–4.44 | <0.001 | 1.69 | 1.01–2.83 | 0.047 |
| NLR | ||||||
| ≥2.5/<2.5 | 2.09 | 1.40–3.12 | <0.001 | 1.58 | 1.02–2.43 | 0.039 |
| PNI | ||||||
| <50/≥50 | 2.28 | 1.52–3.42 | <0.001 | 1.88 | 1.19–2.97 | 0.007 |
| Overall survival | ||||||
| Sex | ||||||
| Male/female | 1.76 | 1.04–2.97 | 0.035 | 1.19 | 0.67–2.10 | 0.554 |
| Age | ||||||
| >70/≦70 | 3.54 | 2.07–6.05 | <0.001 | 2.31 | 1.30–4.08 | 0.004 |
| Tumor size | ||||||
| T2-3/T1 | 2.60 | 1.56–4.31 | <0.001 | 1.45 | 0.85–2.46 | 0.171 |
| Nodal metastasis | ||||||
| Positive/negative | 4.21 | 2.62-6.74 | <0.001 | 3.78 | 2.34–6.13 | <0.001 |
| Histological type | ||||||
| AD/non-AD | 1.20 | 1.05–1.36 | 0.006 | 1.07 | 0.92–1.24 | 0.373 |
| Tumor differentiation | ||||||
| Mod+por/well | 2.81 | 1.59–4.99 | <0.001 | 1.60 | 0.85–3.02 | 0.143 |
| NLR | ||||||
| ≥2.5/<2.5 | 1.81 | 1.14–2.87 | 0.012 | 1.60 | 1.04–2.54 | 0.048 |
| PNI | ||||||
| <50/≥50 | 3.37 | 2.07–5.48 | <0.001 | 2.40 | 1.39–4.14 | 0.002 |
NLR neutrophil/lymphocyte ratio, PNI prognostic nutritional index, AD adenocarcinoma, mod+por moderate+poorly
Discussion
To our knowledge, this is one of the largest studies to evaluate the value of NLR and/or PNI in predicting the outcome of patients with NSCLC. In addition, this is the first study to show a correlation between the NLR and the PNI, as well as the prognostic impact of both the NLR and the PNI among patients with NSCLC. Our study demonstrated a positive correlation between the NLR and the PNI, and a high NLR (≥2.5 vs. <2.5, P = 0.039) and a low PNI (<50 vs. ≥50, P = 0.007) were significantly associated with a poor survival in the multivariate analysis.
The NLR is an inexpensive, reproducible, and widely available blood test. The preoperative NLR reflects the inflammation status and has been found to be an important indicator of an adverse prognosis among patients with various cancers. In resected NSCLC, Sarraf et al. reported that an increased preoperative NLR was associated with a higher stage and remained an independent predictor of overall survival [8]. Accumulating evidence supports the involvement of systemic inflammation in cancer progression. Cancer-related inflammation includes the presence of inflammatory cells and mediators in the tumor microenvironment. Neutrophils are a major constituent of cancer-related inflammation as well as the host defense against bacterial infection. Tumor-associated neutrophils can function as immunosuppressive cells in the presence of tumors [21]. On the other hand, circulating neutrophils have been shown to produce cytokines that contribute to cancer progression, and an elevated number of neutrophils suppress lymphokine-activated killer cells, thereby increasing the propensity for metastasis [22, 23]. Thus, the systemic inflammatory response has been associated with a poorer prognosis among patients with various cancers including NSCLC.
Patients with an elevated NLR exhibit a relative lymphocyte ratio and may have a poorer lymphocyte-mediated immune response to tumors, thereby increasing tumor progression and worsening the prognosis [24]. In this regard, the NLR seems to be a potential indicator mirroring both host immunity and neutrophil-dependent inflammation, which is associated with the clinical outcome. Particularly, in patients who had undergone a complete resection of the main tumor, the host cell-mediated immunity continues to exert important effects on the destruction of residual tumor cells and micrometastasis. Accordingly, a higher NLR was found to be associated with a poor DFS.
Assessment and support of the nutritional status should be considered a valuable component of the overall oncological strategy [25]. The PNI was reported by Smale et al. to predict the risk of operative morbidity and mortality after gastrointestinal surgery [26]. However, their method for calculating the PNI was too difficult to use routinely. In contrast, the simplified PNI reported by Onodera et al. was based on only two laboratory parameters, the albumin level and the lymphocyte count, which can be easily measured and are routinely used in clinical practice [13]. The PNI was initially designed to assess the nutritional and immunological statuses of patients undergoing gastrointestinal surgery. In 2011, Proctor et al. reported that Onodera’s PNI could predict the outcome of cancer patients, regardless of the primary site of origin [19]. However, to our knowledge, few studies have examined the PNI in patients with NSCLC. In patients with lung cancer, a smoking habit is frequently associated with malnutrition. Chronic obstructive pulmonary disease (COPD) and aging are independent and probably concurrent conditions leading to malnutrition [27]. Shinozawa et al. reported that cigarette smoking and an advanced age were well-known risk factors for COPD, and a lower lung function was independently and linearly associated with lower blood markers for nutritional status and anemia [28]. In our study, the mean PNI was significantly lower among older patients, former and current smokers, and those with squamous cell carcinoma. In patients with lung cancer, the PNI is probably associated not only with the immunological status but also with cigarette smoking.
This study has several limitations that should be considered when interpreting the results. The retrospective study design was a major limitation of the present study. Minor limitations included insufficient evidences of the validity of the cutoff values for the NLR and the PNI. Regarding the NLR, a fixed cutoff value has not yet been established, and various values have been used in previous reports. Because many studies did not describe the method used to select the NLR cutoff, we used a cutoff value based on a previous study. Regarding the PNI, fixed cutoff value has also not yet been established, and various values have been used in previous reports.
Conclusions
In conclusion, a significant inverse correlation between the NLR and the PNI and a high NLR and a low PNI were significantly associated with a poor survival among patients who had undergone a complete resection for NSCLC. NLR and PNI may help in assessing the treatment strategy such as adjuvant therapy and the examination interval after surgery.
Acknowledgements
The author would like to thank IMIC (http://www.imic.or.jp/) for the English language review.
Abbreviations
- NLR
neutrophil/lymphocyte ratio
- NSCLC
non-small cell lung cancer
- PNI
prognostic nutritional index
Footnotes
Competing interests
The authors declare that they have no competing interests.
Authors’ contributions
KS and MN conceived and design the study. RO, SS, AM, and YN helped in the data acquisition. KS and RO analyzed and interpreted the data. KS prepared the manuscript. MN reviewed the manuscript. All the authors have read and approved the final manuscript.
Contributor Information
Katsuhiko Shimizu, Phone: +81-86-464-1124, Email: kshimizu@med.kawasaki-m.ac.jp.
Riki Okita, Email: riki0716okita@yahoo.co.jp.
Shinsuke Saisho, Email: s.saisho@med.kawasaki-m.ac.jp.
Ai Maeda, Email: amaeda@med.kawasaki-m.ac.jp.
Yuji Nojima, Email: n.yuji@med.kawasaki-m.ac.jp.
Masao Nakata, Email: mnakata@med.kawasaki-m.ac.jp.
References
- 1.Goldstraw P, Crowley J, Chansky K, Giroux DJ, Groome PA, Rami-Porta R, et al. The IASLC lung cancer staging project: proposals for the revision of the TNM stage groupings in the forthcoming (seventh) edition of the TNM classification of malignant tumours. J Thorac Oncol. 2007;2:706–714. doi: 10.1097/JTO.0b013e31812f3c1a. [DOI] [PubMed] [Google Scholar]
- 2.Thunnissen E, van der Oord K, den Bakker M. Prognostic and predictive biomarkers in lung cancer. A review. Virchows Arch. 2014;464:347–358. doi: 10.1007/s00428-014-1535-4. [DOI] [PubMed] [Google Scholar]
- 3.Shimizu K, Okita R, Nakata M. Clinical significance of the tumor microenvironment in non-small cell lung cancer. Ann Transl Med. 2013;1:20. doi: 10.3978/j.issn.2305-5839.2013.06.01. [DOI] [PMC free article] [PubMed] [Google Scholar]
- 4.Guthrie GJ, Charles KA, Roxburgh CS, Horgan PG, McMillan DC, Clarke SJ. The systemic inflammation-based neutrophil-lymphocyte ratio: experience in patients with cancer. Crit Rev Oncol Hematol. 2013;88:218–230. doi: 10.1016/j.critrevonc.2013.03.010. [DOI] [PubMed] [Google Scholar]
- 5.Templeton AJ, McNamara MG, Šeruga B, Vera-Badillo FE, Aneja P, Ocaña A, et al. Prognostic role of neutrophil-to-lymphocyte ratio in solid tumors: a systematic review and meta-analysis. J Natl Cancer Inst. 2014;106:124. doi: 10.1093/jnci/dju124. [DOI] [PubMed] [Google Scholar]
- 6.Lee Y, Kim SH, Han JY, Kim HT, Yun T, Lee JS. Early neutrophil-to-lymphocyte ratio reduction as a surrogate marker of prognosis in never smokers with advanced lung adenocarcinoma receiving gefitinib or standard chemotherapy as first-line therapy. J Cancer Res Clin Oncol. 2012;138:2009–2016. doi: 10.1007/s00432-012-1281-4. [DOI] [PMC free article] [PubMed] [Google Scholar]
- 7.Cedrés S, Torrejon D, Martínez A, Martinez P, Navarro A, Zamora E, et al. Neutrophil to lymphocyte ratio (NLR) as an indicator of poor prognosis in stage IV non-small cell lung cancer. Clin Transl Oncol. 2012;14:864–869. doi: 10.1007/s12094-012-0872-5. [DOI] [PubMed] [Google Scholar]
- 8.Sarraf KM, Belcher E, Raevsky E, Nicholson AG, Goldstraw P, Lim E. Neutrophil/lymphocyte ratio and its association with survival after complete resection in non-small cell lung cancer. J Thorac Cardiovasc Surg. 2009;137:425–428. doi: 10.1016/j.jtcvs.2008.05.046. [DOI] [PubMed] [Google Scholar]
- 9.Teramukai S, Kitano T, Kishida Y, Kawahara M, Kubota K, Komuta K, et al. Pretreatment neutrophil count as an independent prognostic factor in advanced non-small-cell lung cancer: an analysis of Japan Multinational Trial Organisation LC00-03. Eur J Cancer. 2009;45:1950–1958. doi: 10.1016/j.ejca.2009.01.023. [DOI] [PubMed] [Google Scholar]
- 10.Tomita M, Shimizu T, Ayabe T, Nakamura K, Onitsuka T. Preoperative neutrophil to lymphocyte ratio as a prognostic predictor after curative resection for non-small cell lung cancer. Anticancer Res. 2012;32:3535–3538. [PubMed] [Google Scholar]
- 11.Yao Y, Yuan D, Liu H, Gu X, Song Y. Pretreatment neutrophil to lymphocyte ratio is associated with response to therapy and prognosis of advanced non-small cell lung cancer patients treated with first-line platinum-based chemotherapy. Cancer Immunol Immunother. 2013;62:471–479. doi: 10.1007/s00262-012-1347-9. [DOI] [PMC free article] [PubMed] [Google Scholar]
- 12.Jafri SH, Shi R, Mills G. Advance lung cancer inflammation index (ALI) at diagnosis is a prognostic marker in patients with metastatic non-small cell lung cancer (NSCLC): a retrospective review. BMC Cancer. 2013;13:158. doi: 10.1186/1471-2407-13-158. [DOI] [PMC free article] [PubMed] [Google Scholar]
- 13.Onodera T, Goseki N, Kosaki G. Prognostic nutritional index in gastrointestinal surgery of malnourished cancer patients. Nihon Geka Gakkai Zasshi. 1984;85:1001–1005. [PubMed] [Google Scholar]
- 14.Nozoe T, Kimura Y, Ishida M, Saeki H, Korenaga D, Sugimachi K. Correlation of pre-operative nutritional condition with post-operative complications in surgical treatment for oesophageal carcinoma. Eur J Surg Oncol. 2002;28:396–400. doi: 10.1053/ejso.2002.1257. [DOI] [PubMed] [Google Scholar]
- 15.Migita K, Takayama T, Saeki K, Matsumoto S, Wakatsuki K, Enomoto K, et al. The prognostic nutritional index predicts long-term outcomes of gastric cancer patients independent of tumor stage. Ann Surg Oncol. 2013;20:2647–2654. doi: 10.1245/s10434-013-2926-5. [DOI] [PubMed] [Google Scholar]
- 16.Nozoe T, Kohno M, Iguchi T, Mori E, Maeda T, Matsukuma A, et al. The prognostic nutritional index can be a prognostic indicator in colorectal carcinoma. Surg Today. 2012;42:532–535. doi: 10.1007/s00595-011-0061-0. [DOI] [PubMed] [Google Scholar]
- 17.Kanda M, Fujii T, Kodera Y, Nagai S, Takeda S, Nakao A. Nutritional predictors of postoperative outcome in pancreatic cancer. Br J Surg. 2011;98:268–274. doi: 10.1002/bjs.7305. [DOI] [PubMed] [Google Scholar]
- 18.Yao ZH, Tian GY, Wan YY, Kang YM, Guo HS, Liu QH, et al. Prognostic nutritional index predicts outcomes of malignant pleural mesothelioma. J Cancer Res Clin Oncol. 2013;139:2117–2123. doi: 10.1007/s00432-013-1523-0. [DOI] [PMC free article] [PubMed] [Google Scholar]
- 19.Proctor MJ, Morrison DS, Talwar D, Balmer SM, Fletcher CD, O'Reilly DS, et al. A Glasgow inflammation outcome study. Eur J Cancer. 2011;47:2633–2641. doi: 10.1016/j.ejca.2011.03.028. [DOI] [PubMed] [Google Scholar]
- 20.Qiu C, Qu X, Shen H, Zheng C, Zhu L, Meng L, et al. Evaluation of prognostic nutritional index in patients undergoing radical surgery with nonsmall cell lung cancer. Nutr Cancer. 2015;67:741–717. doi: 10.1080/01635581.2015.1032430. [DOI] [PubMed] [Google Scholar]
- 21.B Nagaraj S, Schrum AG, Cho HI, Celis E, Gabrilovich DI. Mechanism of T cell tolerance induced by myeloid-derived suppressor cells. J Immunol. 2010;15:3106–3116. doi: 10.4049/jimmunol.0902661. [DOI] [PMC free article] [PubMed] [Google Scholar]
- 22.Shau HY, Kim A. Suppression of lymphokine-activated killer induction by neutrophils. J Immunol. 1988;141:4395–4402. [PubMed] [Google Scholar]
- 23.Kusumanto YH, Dam WA, Hospers GA, Meijer C, Mulder NH. Platelets and granulocytes, in particular the neutrophils, form important compartments for circulating vascular endothelial growth factor. Angiogenesis. 2003;6:283–287. doi: 10.1023/B:AGEN.0000029415.62384.ba. [DOI] [PubMed] [Google Scholar]
- 24.Cho H, Hur HW, Kim SW, Kim SH, Kim JH, Kim YT, et al. Pre-treatment neutrophil to lymphocyte ratio is elevated in epithelial ovarian cancer and predicts survival after treatment. Cancer Immunol Immunother. 2009;58:15–23. doi: 10.1007/s00262-008-0516-3. [DOI] [PMC free article] [PubMed] [Google Scholar]
- 25.Andreoli A, De Lorenzo A, Cadeddu F, Iacopino L, Grande M. New trends in nutritional status assessment of cancer patients. Eur Rev Med Pharmacol Sci. 2011;15:469–480. [PubMed] [Google Scholar]
- 26.Smale BF, Mullen JL, Buzby GP, Rosato EF. The efficacy of nutritional assessment and support in cancer surgery. Cancer. 1981;47:2375–2381. doi: 10.1002/1097-0142(19810515)47:10<2375::AID-CNCR2820471009>3.0.CO;2-I. [DOI] [PubMed] [Google Scholar]
- 27.Battaglia S, Spatafora M, Paglino G, Pedone C, Corsonello A, Scichilone N, et al. Ageing and COPD affect different domains of nutritional status: the ECCE study. Eur Respir J. 2011;37:1340–1345. doi: 10.1183/09031936.00032310. [DOI] [PubMed] [Google Scholar]
- 28.Shiozawa N, Hayashimoto K, Suzuki E, Kikuchi H, Takata S, Ashida K, et al. Lung function and blood markers of nutritional status in non-COPD aging men with smoking history: a cross-sectional study. Int J Chron Obstruct Pulmon Dis. 2010;5:233–240. doi: 10.2147/copd.s10029. [DOI] [PMC free article] [PubMed] [Google Scholar]