Abstract
Mitochondrial morphology has been associated with numerous pathologies including cancer, diabetes, obesity and heart disease. However, the connection is poorly understood—in part due to the difficulty of characterizing the morphology. This impedes the use of morphology as a tool for disease detection/monitoring. Here, we use the Brownian motion of isolated mitochondria to characterize their size and shape in a high throughput fashion. By using treadmill exercise training, mitochondria from heart and gastrocnemius of Balb/c mice were modulated in size and used to investigate the protocol. Consistent with previous reports, the heart mitochondria of untrained mice increased 5% in diameter immediately after a single bout of moderate exercise (1.091 ± 0.004 μm) as compared to completely sedentary controls (1.040 ± 0.022 μm). In addition, no change was observed in the size of gastrocnemius mitochondria (1.025 ± 0.018 μm), which was also in agreement with previous studies. The method was also successfully applied to smaller Saccharomyces cerevisiae mitochondria.
Introduction
Mitochondria are sub-cellular organelles which provide the majority of the energy required for human life, and their dysfunction has been increasingly implicated in a variety of diseases.1 In particular, abnormal mitochondrial morphology has been linked to aging,2 obesity,3 diabetes,4 and certain cancers.5 Understanding the relationship of mitochondrial morphology to disease may provide a useful tool in predicting disposition to disease onset6 as well as evaluating disease progression3,7 and response to treatment.8–10 Determination of mitochondrial morphology has typically been performed by examination of tissue cross-sections with conventional electron microscopy. However mitochondria are highly dynamic organelles with shapes ranging from simple spherical shapes to highly interconnected, tubular networks that require complex fluorescence or electron microscopy techniques with 3D reconstruction to image properly.11 While these advanced methods provide exquisite structural information, the preparation and equipment required limits application as a laboratory tool. For mitochondrial morphology to be exploited more widely as a diagnostic, more practical assays need to be developed.
One route is to isolate the mitochondria before imaging. While this does introduce issues of damage and purity, isolation allows more flexibility in the imaging modality. Mitochondria isolated from the cytoskeleton lose their reticular structure and collapse into roughly 1 μm diameter spherical shapes. This loss of geometry allows volume measurement of individual mitochondria to be performed using conventional electron microscopy;12 however this measurement is time-consuming, making it difficult to analyze enough mitochondria for statistical analysis. A promising alternative method is capillary electrophoresis with laser induced detection,13 which can measure the amount of fluorophore bound to individual mitochondria suspended in buffer. However, the fluorescence intensity of an individual mitochondrion is related to the binding characteristics of the fluorophore as well as the size,14 making size determination difficult. A related technique is capillary electrophoresis with laser scattering as the detection method.15 While sensitive to size, the degree of scattering is also affected by the internal structure of the mitochondrion as well as its molecular composition, complicating extraction of the size information. Laser scattering has also been used in flow cytometry studies of mitochondria and has demonstrated sensitivity to mitochondrial size changes.16Recently, we have reported sub-micron sizing of polystyrene beads in a suspension by analyzing the Brownian motion of individual beads via optical microscopy.17 This method exploits the inverse relationship between particle size and velocity fluctuations (i.e., small particles have more velocity fluctuation) found in the Brownian regime. Similarly, this methodology could be used to characterize individual mitochondria in a high throughput manner.
Here, we validate this methodology by examining mitochondria isolated from mice and budding yeast as well as mitochondria swelled using osmotic pressure. To investigate mitochondrial morphological differences in a more complicated system, we use the effects of exercise training on mice as a model system. Sedentary animals subjected to single bouts of exhaustive exercise display abnormally swollen heart mitochondria.18–20 In contrast, no such swelling is seen in mitochondria extracted from the gastrocnemius.21 The different mitochondrial size response between these two tissues provides a realistic test of the Brownian motion methodology.
Methods
Reagents and buffers
Mannitol, sorbitol and 3-(N-morpholino)propanesulfonic acid (MOPS) were purchased from Sigma-Aldrich (St. Louis, MO, USA). Sucrose, glucose and KH2PO4 were purchased from Mallinckrodt-Baker (Phillipsburg, NJ, USA). Yeast extract and Bacto-peptone were purchased from Becton, Dickinson and Company (Sparks, MD, USA). Halt protease inhibitor (Thermo Scientific, Rockford, IL, USA) and ethylene glycol tetraacetic acid (EGTA; Calbiochem, La Jolla, CA, USA) were also purchased. The mitochondrial isolation buffer contained 300 mM sucrose, 5 mM MOPS and 2 mM EGTA, pH 7.4 (isolation buffer). The buffer used for microscopy of the exercise/sedentary mice consisted of 225 mM mannitol, 70 mM sucrose, 10 mM KH2PO4, 50 mM MOPS and 1 mM EGTA, pH 7.4 (sizing buffer). Yeast mitochondria were observed in 600 mM sorbitol, 10 μM EGTA and 50 mM MOPS, pH 7.4 (shrinking buffer) and were also osmotically swollen in 6 mM sorbitol, 10 μM EGTA and 50 mM MOPS, pH 7.4 (swelling buffer). Yeast and mouse mitochondria were observed together in 300 mM sucrose, 10 μM EGTA and 50 mM MOPS, pH 7.4 (combination buffer). Polybead polystyrene beads (Polysciences, Warrington, PA, USA) were used for calibration. Buffer viscosity was measured with a Cannon-Fiske viscometer.
Yeast
Respiration-competent budding yeast (Saccharomyces cerevisiae) strain D273-10B22 was purchased from American Type Culture Collection (ATCC, Manassas, VA, USA). The yeast was grown on the YPD medium (10 g yeast extract, 20 g Bacto peptone, and 20 g glucose per litre) and harvested in the log stage.
Animals
For the initial comparison between yeast mitochondria and mouse heart mitochondria, a male C57BL/6 (Jackson Labs, Bar Harbor, ME, USA; catalog number 000664) was kept sedentary until 39 weeks of age. This mouse was anesthetized with isoflurane prior to cervical dislocation. For the other mouse heart experiments, a specific pathogen-free inbred female Foxp3 reporter mouse on a Balb/c background (Jackson Labs; catalog number 006769) was aerobically exercise-trained on a motorized treadmill (Columbus Instruments, Columbus, OH, USA) at a speed corresponding to approximately 65% of VO2max (13.5 m min−1, 45 min d−1) for 10 weeks). The mouse was kept on a 12 : 12 h light–dark cycle and given autoclaved food (8640 Harlan Teklad 22-5 Harlan, Madison, WI, USA) and water ad libitum. Exercise took place at the beginning of the dark cycle. Two months after the final exercise bout, the female was impregnated by a male mouse of the same strain.‡ Pups from this union were kept under conditions as described above except they were kept sedentary until 6–7 weeks of age. One group of 3 female pups was then given a 45 minute exercise bout as described above immediately before sacrifice (group EXR). The other group of 3 female pups was sacrificed with no exercise (group SED). Prior to sacrifice, mice were anesthetized with ketamine followed by cervical dislocation. All animal treatments were approved by the Institutional Animal Care and Use Committee at the University of Houston and within the guidelines set by the NIH.
Yeast mitochondrial preparation
The protocol was loosely based on a previous protocol.23 The yeast was washed twice in deionized water and resuspended in 600 mM sorbitol, 1 mM EGTA and 5 mM MOPS, pH 7.4 (sorbitol buffer). The wet weight of the yeast was ~3 g. The yeast was inserted into a 1 oz ice-cold bottle, which was 1/3 filled with 500 μm glass beads. 100 μl of Halt protease inhibitor was also added before filling the bottle with sorbitol buffer and sealing. The bottle was placed in an ice filled container and shaken by hand at 2 Hz with 10 cm amplitude for 30 seconds, before letting the suspension cool without shaking for 30 seconds. This was repeated 7 times. The suspension was then transferred to a 50 mL centrifuge tube and centrifuged at 2800g for 5 min at 2 °C with a Thermo Scientific Sorvall RT1 centrifuge (to remove unbroken cells and cell debris). The supernatant was then centrifuged at 2800g for 60 min at 2 °C to pellet the mitochondria. The pellet was resuspended in 50 μl sorbitol buffer and centrifuged at 2800g for 1 min at 2 °C to remove any residual cell debris. The supernatant was stored on ice until use.
Mouse mitochondrial preparation
A differential centrifugation procedure loosely based on the method used by Shen et al.4 was used to extract the mitochondria. The heart and gastrocnemius from both legs were removed and placed in ice cold isolation buffer. The tissue was then minced finely with a razor blade on an ice cold glass plate. After rinsing clean of blood, the tissue was combined with 4 mL isolation buffer and homogenized with a size 23 Duall Teflon pestle tissue grinder (Kimble-Chase, Vineland, NJ, USA). The pestle was rotated at 300 rpm and 25 up–down passes of the pestle were performed. The mortar was kept in ice water during this process and the pestle was also kept ice cold until immediately before use. The homogenate was transferred to a 50 mL centrifuge tube and centrifuged at 500g for 10 min at 4 °C with a Thermo Scientific Sorvall RT1 centrifuge (to remove unbroken cells and cell debris). The supernatant was split into 2 separate 2 mL microcentrifuge tubes and centrifuged again at 2800g for 10 min at 4 °C with the RT1 or an Eppendorf 5415C centrifuge placed in a refrigerator. The pellet in each tube was resuspended in 1 mL isolation buffer and the 2800g centrifugation repeated. The pellets were then combined in 100 μL of isolation buffer and kept on ice until measurement.
Brownian motion measurement
The design and construction of the system to measure the Brownian motion has been described previously.17 The mitochondria are diluted in the appropriate buffer to ~3 × 10⁸ particles per mL and injected into a rectangular capillary (50 μm 500 μm × 5 cm; Vitrocom, Mountain Lakes, NJ, USA). The capillary was preconditioned with NaOH and buffer as previously described.17 The mitochondria are observed in the capillary using an inverted microscope (IX-71; Olympus, Central Valley, PA, USA) with a 1.6× internal magnification and a 20× phase contrast objective (UPlanFl; Olympus). We intentionally choose a low 0.40 NA (and consequently low magnification) objective lens to increase the depth of field. The objective was focused in the middle of the capillary to avoid capillary wall effects. Images were recorded using a high-speed CCD camera (IPX-VGA 210L; Imperx, Boca Raton, FL, USA) operating at 98.6 fps with a 10 ms exposure per frame and 8 bit resolution. Flow is controlled by an external voltage (~60 V) which induces particle electrophoresis on the mitochondria. The voltage was tuned such that the mitochondria flow through the camera field of view in 5 to 10 seconds. Data were taken for 3–5 minutes in this way for every mitochondrial sample.
Data analysis
To remove background effects from the movie due to imperfections of the imaging system or capillary, a background image was created by averaging every 50th frame of the movie. This background was then subtracted from every frame of the movie using LabView software (National Instruments, Austin, TX, USA). The particles were tracked as previously described.17 Briefly, particles were identified by identifying dark clusters of pixels and the position calculated using centroid analysis. The particle locations are then linked into tracks using an algorithm designed by Sbalzarini et al.24 and implemented in ImageJ (public domain software freely available from the NIH). Particle images with areas less than 10 pixels (0.535 μm2) were removed from the analysis as these particles have velocity noise not related to simple translational Brownian motion17 (due to diffraction broadening the actual particle is smaller than the particle image, so the minimum size detected with this procedure is approx. 350 nm). Particles with area greater than 5.347 μm2 were also ignored as they were clearly (from visual inspection) not individual mitochondria (perhaps clumps of mitochondria or other cellular debris). Particles that lie within 2.3 mm of another particle were also removed from the analysis to simplify the particle linking algorithm. Particle tracks less than 3 seconds in length were not analyzed (too short for accurate Brownian motion analysis). All analysis subsequent to particle linking was done in Matlab (Mathworks, Natick, MA, USA). The statistical significance of changes in mean mitochondrial diameter between cohorts was examined using the 1-tailed Student's t-test.
Theory
Small particles undergo Brownian motion, which we monitor here by measuring velocity fluctuations in time. To measure the instantaneous velocity in the x direction (vx), the x position of a particle between consecutive frames were subtracted and multiplied by the frame rate. The instantaneous velocity in the y direction (vy) is similarly defined. To quantify the Brownian motion, the velocity variance of a particle () is defined as
| (1) |
| (2) |
| (3) |
where 〈 〉 denotes the time average over the observation of the particle.
The theory of Brownian motion links the particle size with velocity fluctuations. For the case of a sphere, the relation goes as17
| (4) |
| (5) |
where d is the particle diameter and Γ is a constant which depends on viscosity (η), temperature (T), Boltzmann's constant (kB) and camera frame rate (F). By determining Γ by calibration against a bead standard, spherical particles can be sized from their by using eqn (4).
Results and discussion
Bead calibration
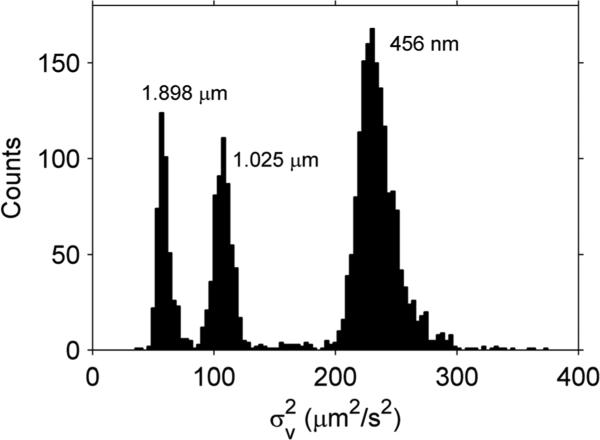
To measure Γ, the of different sized polystyrene beads was examined with the system in a variety of buffers. A histogram of one such test is given in Fig. 1. Three peaks are clearly evident, with the smaller beads displaying the larger . By taking the average of eqn (4) over all particles
| (6) |
where N is the total number of analyzed particles, is the of bead n and d̄ is the manufacturer quoted bead diameter, Γ can be calculated. As expected, Γ is independent of the particle size but does depend on the buffer (Table 1). In the subsequent analysis, to size mitochondria from a particular buffer, we use the average Γ from all the different size beads measured in that same buffer (except for the combination buffer, for which only one bead size was measured). This method is probably valid over a larger range that what was tested here (400 nm to 2 μm). However, if the particle is too large, the velocity fluctuations will become difficult to measure. If the particle is too small, the issue of actually imaging the particle can be a limiting factor.
Fig. 1.
histogram for 0.456 μm, 1.025 μm and 1.898 μm diameter beads in sizing buffer. The different beads were measured separately and combined into a single plot for comparison purposes.
Table 1.
Γ in different buffers
| Buffer | d̄ ± SD (μm) | # of beads | Γ ± SDa (μm3 s–2) |
|---|---|---|---|
| Sizing | 0.456 ± 0.015 | 337 | 102 ± 3 |
| 1.025 ± 0.01 | 318 | 110 ± 1 | |
| 1.898 ± 0.029 | 368 | 109 ± 2 | |
| Mean | 107 ± 3 | ||
| Shrinking | 0.456 ± 0.015 | 419 | 108 ± 3 |
| 1.025 ± 0.01 | 104 | 109 ± 1 | |
| 1.898 ± 0.029 | 151 | 111 ± 2 | |
| Mean | 109 ± 1 | ||
| Swelling | 0.456 ± 0.015 | 261 | 142 ± 5 |
| 1.025 ± 0.01 | 171 | 139 ± 1 | |
| 1.898 ± 0.029 | 120 | 139 ± 2 | |
| Mean | 140 ± 1 | ||
| Combination | 0.974 ± 0.034 | 69 | 98 ± 4 |
The Γ standard deviation (SD) for each trial includes the bead size uncertainty and the statistical uncertainty due to the number of beads studied.
Spherical vs. non-spherical particles
Particle shape is an important factor when analyzing . Strictly speaking, is inversely proportional to drag, which depends on both volume and shape. For example, as a fixed-volume sphere is deformed to an ellipsoidal shape, the time-averaged drag will increase, decreasing . In practice, this means large spheres and smaller, stretched-out ellipsoids may appear identical if only their average Brownian motion is compared. However, some shape information is available from the image. By analyzing only spherical particles, we can make some quantitative analysis on a subset of the data while keeping in mind that the remaining non-spherical particles may have different behavior.
To look for non-spherical particles, the Heywood circularity factor (H) defined as
| (7) |
is used, where C is the particle image perimeter and A is the particle image area. H equals 1 for perfect circles and increases for non-circular shapes. In practice, mitochondria are not perfect spheres, and the effect of this non-sphericity on the size estimation is important to quantify. If non-spherical particles are naively sized as spherical particles using eqn (4), the particle diameter results will overestimate the actual particle volume. However, if only highly spherical particles are chosen for analysis, the number of analyzed particles will become unacceptably small. The challenge is to find a range of acceptable ‘sphericity’ that gives both a sufficient number of particles for analysis and an acceptable degree of uncertainty in the size estimation. To address this question, the mitochondrial particles were modeled as prolate spheroids (rugby ball shapes), which can be described by their maximum cross-sectional area and major axis/minor axis (r). This shape provides a realistic worst case scenario for this methodology as the prolate spheroid maximizes drag while keeping a smooth surface condition. We choose r = 1.85 as the cutoff for analysis (H ≤ 1.15), which gives a maximum volume overestimate of 9% in the case of perfect imaging (see ESI†).
In practice, the H is measured for each image of a particle along its track, and the maximum H of the track is taken as the degree of deviation away from a sphere. One risk is, if the particles do not tumble rapidly enough in solution, the maximum H of the track may not represent the true maximum H of the particle. However, at the size scale examined here, the particles undergo Brownian rotation at a frequency of roughly 1 Hz. Thus, over the recorded particle track (minimum 3 s length), the projection of the maximum non-circular appearance will be well sampled.
Yeast mitochondria
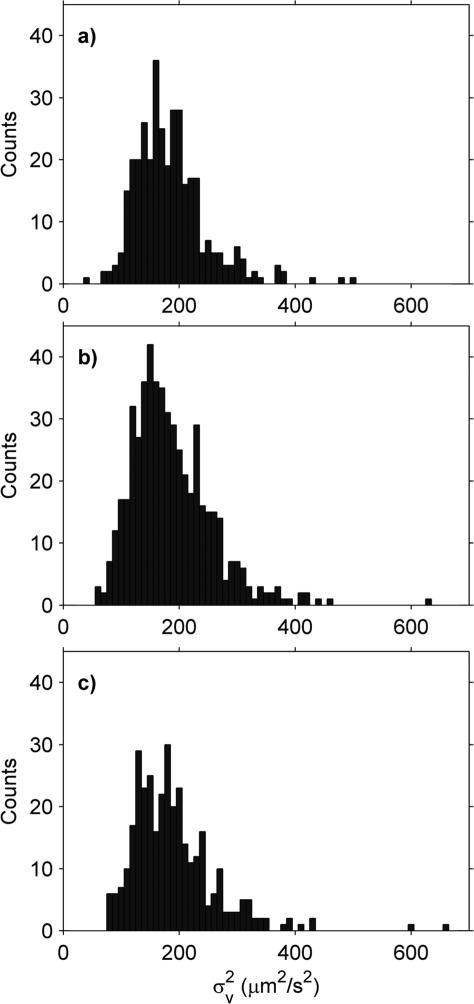
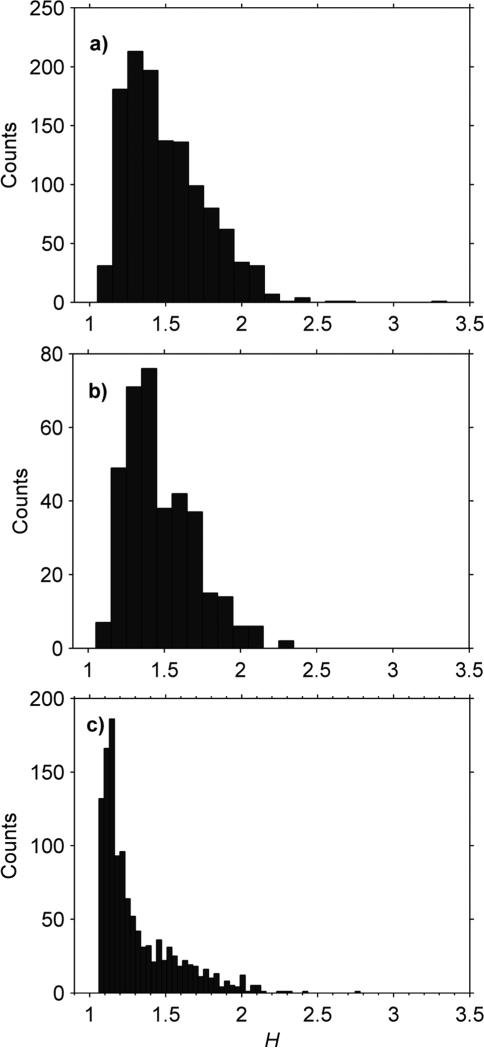
Crude mitochondrial suspensions from yeast were isolated and the Brownian motion measured three times using three different capillaries to check the reproducibility of the measurement (Fig. 2). Although the distributions are broad, the mean and standard deviations of the replicates are quite similar (Table 2). Examining the particles in more detail, the H distribution is also broad (Fig. 3a and b), with hardly any of the mitochondria meeting the above-defined criteria for sphericity.
Fig. 2.
Yeast mitochondria histograms in shrinking buffer using 3 different capillaries: (a) Replicate 1, (b) Replicate 2 and (c) Replicate 3.
Table 2.
Yeast mitochondria in shrinking buffer
| Replicate # | (μm2 s–2) | SDa (μm2 s–2) | # of mito. |
|---|---|---|---|
| 1 | 184.9 ± 3.3 | 62.5 | 350 |
| 2 | 186.7 ± 3.0 | 69.4 | 526 |
| 3 | 189.4 ± 4.0 | 73.1 | 340 |
SD refers to the standard deviation of the histogram.
Fig. 3.
H histograms of mitochondria in different buffers. (a) Yeast mitochondria in shrinking buffer (total count 1216). (b) Yeast mitochondria in swelling buffer (total count 363). (c) Mouse (C57BK/6) heart mitochondria in combination buffer (total count 1206).
Naively sizing these mitochondria by assuming them to be spherical gives an average diameter of 645 nm. However, as previously discussed, this approximation overestimates the particle volume. The volume correction factor for these mitochondria is non-trivial to calculate as the particle shape is not well-defined due to diffraction broadening and pixelation of the particle image. This issue is not insurmountable but has yet to be considered thoroughly.
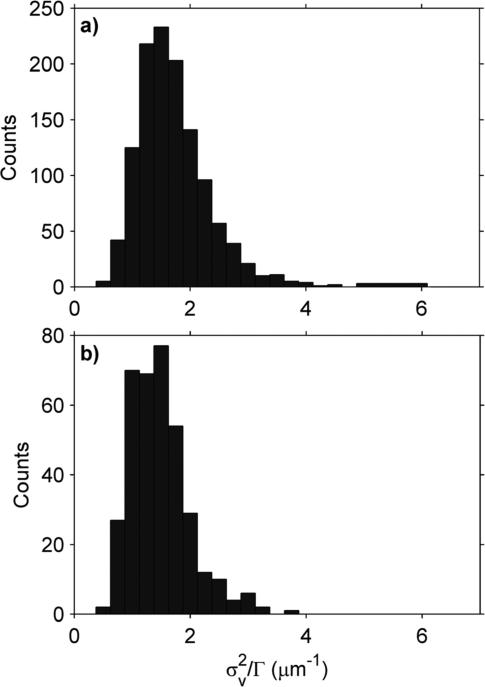
To test the sensitivity of this protocol to morphology changes, the yeast mitochondria were also placed in a low osmolar “swelling buffer”. When comparing distributions between different buffers, two factors must be considered. The first factor is the possibility of a particle shape change which changes the drag but does not change the particle volume. To investigate this possibility, we examined the H distribution. In this case, the H distribution of the swelled mitochondria was largely unchanged from the shrinking buffer (Fig. 3a and b and Table 3), suggesting the mitochondria did not change shape significantly between the two buffers. The second factor is the effect of buffer viscosity (η). has an inverse relationship with η (eqn (4) and (5)), which can be scaled out by dividing by Γ. When normalized in this way, the mean of the distribution shows a 16% decrease when the mitochondria are swollen (Fig. 4 and Table 3).
Table 3.
Effect of osmotic swelling
|
(μm–1) |
H
|
||||
|---|---|---|---|---|---|
| Buffer | Mean ± SEM | SDa | Mean ± SEM | SDa | # of mito. |
| Shrinking | 1.72 ± 0.02 | 0.62 | 1.51 ± 0.01 | 0.27 | 1216 |
| Swelling | 1.48 ± 0.03 | 0.51 | 1.48 ± 0.01 | 0.23 | 363 |
SD is the standard deviation of the respective histogram.
Fig. 4.
Effect of osmotic pressure on . To account for viscosity, has been scaled by Γ. (a) Shrinking (high osmolar) buffer. (b) Swelling (low osmolar) buffer.
Comparison of yeast and mouse mitochondria
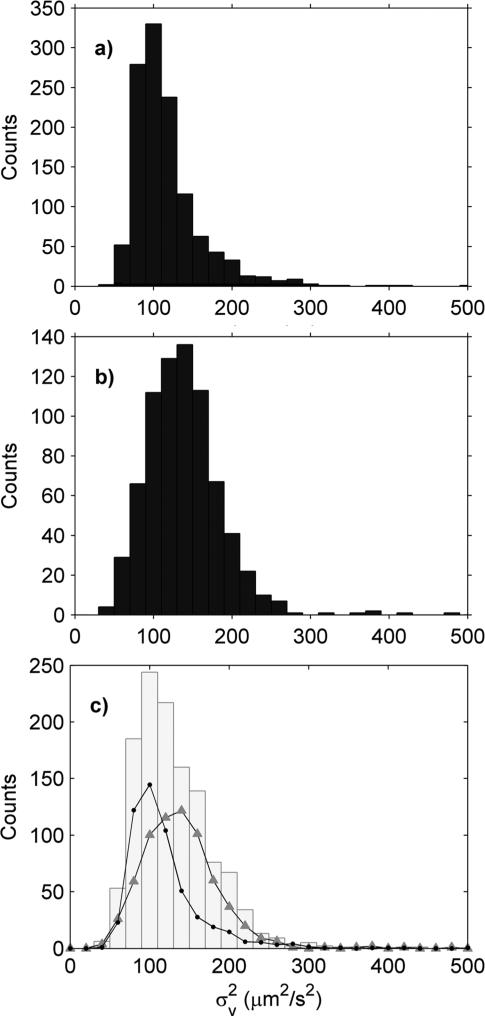
To test the ability of this protocol to distinguish between two groups of mitochondria, yeast and mouse heart mitochondria were compared. The of the mouse mitochondria (mean ± SEM; 117 ± 1 μm2 s−2) were on average smaller than the yeast (138 ± 2 μm2 s−2). However, the distributions from both samples were broad and overlapped considerably (Fig. 5a and b). Thus, when the two samples were mixed and the analyzed, only a single, smeared out peak was visible in the histogram (Fig. 5c), unlike a similar experiment performed with different sized beads (Fig. 1). To back out the contributions from each type of mitochondria, the mixed histogram was fit by mixing the histograms from the pure mouse and yeast histograms. The fit was performed in MATLAB using the least-squares fitting routine “lsqnonneg” and had a reduced χ2 of 1.07. The fit gives a ~15% lower than expected concentration of yeast and mouse mitochondria in the mixed sample (Fig. 5) as compared to the pure samples. This was probably due to sidewall adsorption as the mixed experiment was done 40 minutes after the initial pure sample experiments.
Fig. 5.
of mouse heart (C57BK/6) and yeast mitochondria in combination buffer. (a) Mouse heart mitochondria (11.81 μg ml−1) only; total count 1206 particles. (b) Yeast mitochondria (1.66 μg ml−1) only; total count 743 particles. (c) Grey histogram is a mixed sample of mouse heart (5.87 μg ml−1) and yeast (2.20 μg ml−1) mitochondria; total count of 1216 particles. The grey histogram was fit using (a) and (b) (circles and triangles respectively), which gave an estimated 5.20 μg ml−1 of mouse heart mitochondria and 1.79 μg ml−1 of yeast mitochondria.
Effect of exercise on mouse mitochondria
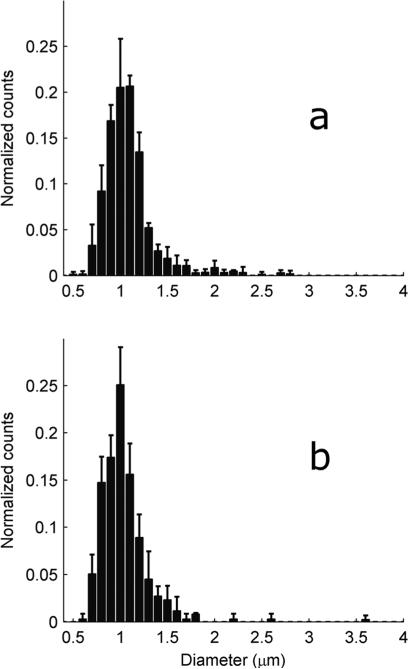
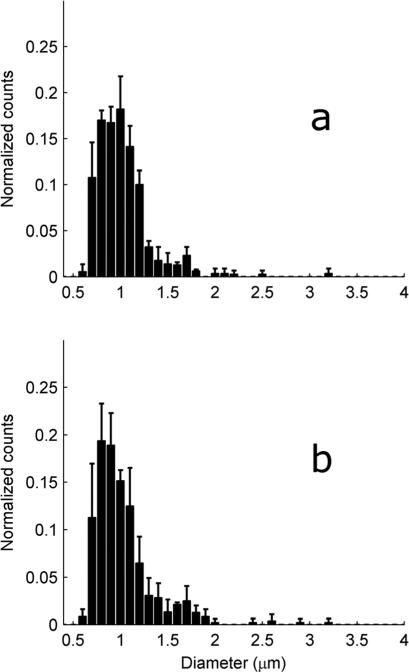
Mitochondria were isolated from heart or gastrocnemius from mice with different exercise histories. Unlike the yeast mitochondria, around 30% of the mouse mitochondria met the H ≤ 1.15 criteria for sphericity (Fig. 3c). These spherical mitochondria were sized using eqn (4) together with the sizing buffer Γ from Table 1. These histograms were then normalized by the total number of mitochondria and averaged (Fig. 6 and 7). These averaged distributions all have roughly the same shape, with a peak around 1 μm and a skew favoring larger mitochondria. Although reports on mitochondrial diversity within the same tissue are sparse, a few other studies have also found broad mitochondrial inhomogeneity.13,16 As mitochondrial size has been experimentally linked to age,2 exercise and environment,25 some degree of inhomogeneity is to be expected.
Fig. 6.
Distribution of heart mitochondrial diameter from mice with different exercise histories. To create each figure, the histograms generated from each tissue sample were normalized by the total number of counts, and then all normalized histograms within a mouse group were averaged. The solid bars represent the mean while the error bars represent one standard deviation. (a) EXR, 3 mice. (b) SED, 3 mice.
Fig. 7.
Distribution of the gastrocnemius mitochondrial diameter from mice with different exercise histories. To create each figure, the histograms generated from each tissue sample were normalized by the total number of counts, and then all normalized histograms within a mouse group were averaged. The solid bars represent the mean while the error bars represent one standard deviation. (a) EXR, 2 mice. (b) SED, 3 mice.
Differences between cohorts are difficult to discern from Fig. 6 and 7; however the peaks of the cardiac distributions are seen to be slightly right-shifted as compared to the gastrocnemius distribution peaks. To further quantify the differences, the mean mitochondrial diameter for each tissue sample was examined (Table 4). On average, the cardiac mitochondria are larger than the gastrocnemius mitochondria. However, differences can now be discerned between the cohorts. In particular, sedentary mice stressed by recent exercise (EXR) are seen to have larger cardiac mitochondria than the completely sedentary SED cohort (p-value 0.04). This is consistent with other electron microscopy studies which have found enlargement of cardiac mitochondria immediately after exhaustive exercise.18–20 This is, to our knowledge, the first study demonstrating the effects of moderate26,27 (as opposed to exhaustive) exercise on untrained heart muscle mitochondrial morphology. The origins of the mitochondrial swelling are unknown but may be related to opening of cristae junctions.11
Table 4.
Mean mitochondrial diameter compared between mouse cohorts
| Heart |
Gastrocnemius |
|||
|---|---|---|---|---|
| Mouse Cohort | Mean ± SEM (μm) | # mito.a | Mean ± SEM (μm) | # mito.a |
| EXR1 | 1.092 ± 0.022 | 191 | 1.048 ± 0.028 | 135 |
| EXR2 | 1.098 ± 0.018 | 233 | 0.999 ± 0.020 | 178 |
| EXR3 | 1.083 ± 0.021 | 174 | — b | — b |
| Mean ± SEM | 1.091 ± 0.004 | 1.024 ± 0.025 | ||
| SED1 | 1.083 ± 0.029 | 107 | 1.062 ± 0.028 | 146 |
| SED2 | 1.029 ± 0.025 | 135 | 1.009 ± 0.025 | 153 |
| SED3 | 1.009 ± 0.016 | 123 | 1.005 ± 0.035 | 85 |
| Mean ± SEM | 1.040 ± 0.022 | 1.025 ± 0.018 | ||
Refers to the number of tracked mitochondria from the tissue sample.
This sample could not be analyzed due to an error during capillary preparation.
In contrast, mitochondria from the gastrocnemius are not expected to change in size from a single bout of moderate exercise.21 In fact, even extreme muscle exhaustion has not been correlated to changes in skeletal muscle mitochondrial morphology.28 Consistent with these previous observations, no statistically significant change in the mean gastrocnemius mitochondrial size is observed (Table 4).
Assay caveats
This technique is limited by the quality of the mitochondrial suspension. There are a number of factors which should be considered:
-
(1)
Isolation entails removing the cytoskeleton from the mitochondria. However, the cytoskeleton provides much of the mitochondrial structure. When isolated, mitochondria lose their in vivo shape and become spheroidal. While volume measurements can still be made, other aspects of the morphology are likely distorted.
-
(2)
The homogenization process may damage the mitochondria; particularly those with a reticular structure. This would distort the size distribution of the isolated mitochondria as compared to the in vivo distribution.
-
(3)
If there are more than one type of mitochondria within a tissue, some types may be extracted more efficiently than others. This would also distort the isolated mitochondrial size distribution.
-
(4)
The differential centrifugation used to isolate the mitochondria can also isolate other organelles of similar size (e.g. peroxisomes). Thus the purity of the mitochondrial suspension can be an issue in some tissues (this is typically not an issue with muscle mitochondrial extraction). If this is an issue, the identity of the organelle could be detected simultaneously with the Brownian motion by using organelle specific fluorescent dyes.
In addition to aiding organelle identification, extending this method to include fluorescent imaging would allow additional molecular or membrane potential to be extracted together with the size information. However, since the mitochondria are floating freely and may lie out of the focal plane, the absolute fluorescent intensity cannot be quantitatively analyzed. While this is not a problem for qualitative organelle identification, this would be an issue for membrane potential measurements. One solution is to make a ratiometric measurement. For instance, the cationic dye JC-1 (Invitrogen, Grand Island, NY, USA) exists as a monomer at low concentration and yields green fluorescence but forms red-emitting aggregates at higher concentration. As the concentration of cationic dyes within mitochondria depends on the membrane potential, the ratio of the green/red fluorescent emission provides a sensitive measure of the membrane potential. Combining this fluorescent method with the Brownian motion analysis would allow the size and membrane potential to be determined simultaneously on the same mitochondrion in a high-throughput fashion.
Conclusions
Understanding mitochondrial dysfunction, particularly in regards to type 2 diabetes and obesity, has become increasingly pressing as these diseases progress into worldwide epidemics; however simple, robust techniques of probing mitochondrial morphology are still lacking. As the connection between mitochondrial size and disease is still poorly understood, we use the relatively well characterized relationship between the mitochondrial morphology and exercise to validate Brownian motion analysis as a sizing technique. As this technique only requires microlitre amounts of sample (~a few hundred mitochondria), the amount of tissue required is well within the volume obtained from a conventional tissue biopsy, allowing this methodology to be easily translated into clinical studies. In addition, this system can be combined with other well developed fluorescent techniques to create 2D analyses of mitochondrial size versus other properties (e.g., membrane potential, protein content, etc.), which may prove particularly useful in the study of mitochondrial aging.3 We also note this technique is completely general and can be applied to other particles in this size range provided the Brownian motion can be observed. In principle bacteria, peroxisomes, hydrogenosomes or colloids are all candidates for this kind of assay. In addition, the continuous nature of this technique may be useful in situations where on-line monitoring is desired.
Supplementary Material
Acknowledgements
The authors thank George Mercier and Bryan Spring for helpful discussion. Support was provided by R21CA133153 from the National Heart, Lung, and Blood Institute and the National Cancer Institute at the NIH, the National Science Foundation, and by the ARRA supplement: 3 R21 CA133153-03S1 (NIH, NCI). Additional support was provided by the Texas Center for Superconductivity, the Texas Higher Education Coordinating Board Norman Hackerman Advanced Research Program and a University of Houston internal grant.
Footnotes
Electronic supplementary information (ESI) available. See DOI: 10.1039/c2ay05686k
The exercise training given to the mother was for another exercise physiology study and was not necessary for the study here. The details are included for completeness.
Notes and references
- 1.DiMauro S, Hirano M, Schon EA, editors. Mitochondrial Medicine. Informa Healthcare; Andover: 2006. [Google Scholar]
- 2.Brunk UT, Terman A. Eur. J. Biochem. 2002;269:1996–2002. doi: 10.1046/j.1432-1033.2002.02869.x. [DOI] [PubMed] [Google Scholar]
- 3.Kelley DE, He J, Menshikova EV, Ritov VB. Diabetes. 2002;51:2944–2950. doi: 10.2337/diabetes.51.10.2944. [DOI] [PubMed] [Google Scholar]
- 4.Shen X, Zheng S, Thongboonkerd V, Xu M, Pierce WM, Klein JB, Epstein PN. Am. J. Physiol.: Endocrinol. Metab. 2004;287:E896–E905. doi: 10.1152/ajpendo.00047.2004. [DOI] [PubMed] [Google Scholar]
- 5.Modica-Napolitano JS, Singh K. Expert Rev. Mol. Med. 2002;4:1–19. doi: 10.1017/S1462399402004453. [DOI] [PubMed] [Google Scholar]
- 6.Kirkwood SP, Zurlo F, Larson K, Ravussin E. Am. J. Physiol.: Endocrinol. Metab. 1991;260:E89–E94. doi: 10.1152/ajpendo.1991.260.1.E89. [DOI] [PubMed] [Google Scholar]
- 7.Yu T, Robotham JL, Yoon Y. Proc. Natl. Acad. Sci. U. S. A. 2006;103:2653–2658. doi: 10.1073/pnas.0511154103. [DOI] [PMC free article] [PubMed] [Google Scholar]
- 8.Toledo FGS, Watkins S, Kelley DE. J. Clin. Endocrinol. Metab. 2006;91:3224–3227. doi: 10.1210/jc.2006-0002. [DOI] [PubMed] [Google Scholar]
- 9.Toledo FGS, Menshikova EV, Ritov VB, Azuma K, Radikova Z, DeLany J, Kelley DE. Diabetes. 2007;56:2142–2147. doi: 10.2337/db07-0141. [DOI] [PubMed] [Google Scholar]
- 10.Santoro C, Cosmas A, Forman D, Morghan A, Bairos L, Levesque S, Roubenoff R, Hennessey J, Lamont L, Manfredi T. Eur. J. Cardiovasc. Prev. Rehabil. 2002;9:377–381. doi: 10.1097/01.hjr.0000049243.21319.ee. [DOI] [PubMed] [Google Scholar]
- 11.Scheffler IE. Mitochondria. John Wiley & Sons; Hoboken: 2008. [Google Scholar]
- 12.Lang RDA. In: Mitochondria: A Practical Approach. Darley-Usmar VM, Rickwood D, Wilson MT, editors. IRL Press; Washington D.C.: 1987. [Google Scholar]
- 13.Duffy CF, Fuller KM, Malvey MW, O’Kennedy R, Arriaga EA. Anal. Chem. 2002;74:171–176. doi: 10.1021/ac010939i. [DOI] [PubMed] [Google Scholar]
- 14.Fuller KM, Duffy CF, Arriaga EA. Electrophoresis. 2002;23:1571–1576. doi: 10.1002/1522-2683(200206)23:11<1571::AID-ELPS1571>3.0.CO;2-3. [DOI] [PubMed] [Google Scholar]
- 15.Andreyev D, Arriaga EA. Anal. Chem. 2007;79:5474–5478. doi: 10.1021/ac070770u. [DOI] [PubMed] [Google Scholar]
- 16.Macouillard-Poulletier de Gannes F, Belaud-Rotureau M-A, Voisin P, Leducq N, Belloc F, Canioni P, Diolez P. Cytometry. 1998;33:333–339. [PubMed] [Google Scholar]
- 17.Palanisami A, Miller JH. Electrophoresis. 2010;31:3613–3618. doi: 10.1002/elps.201000291. [DOI] [PMC free article] [PubMed] [Google Scholar]
- 18.King D, Gollnick P. Am. J. Physiol. 1970;218:1150–1155. doi: 10.1152/ajplegacy.1970.218.4.1150. [DOI] [PubMed] [Google Scholar]
- 19.Taylor P, Lamb D, Budd G. Eur. J. Appl. Physiol. Occup. Physiol. 1976;35:111–118. doi: 10.1007/BF02333801. [DOI] [PubMed] [Google Scholar]
- 20.Banister E, Tomanek R, Cvorkov N. Am. J. Physiol. 1971;220:1935. doi: 10.1152/ajplegacy.1971.220.6.1935. [DOI] [PubMed] [Google Scholar]
- 21.Hoppeler H, Flueck M. Med. Sci. Sports Exercise. 2003;35:95. doi: 10.1249/01.MSS.0000043292.99104.12. [DOI] [PubMed] [Google Scholar]
- 22.Sherman F. Genetics. 1963;48:375–385. doi: 10.1093/genetics/48.3.375. [DOI] [PMC free article] [PubMed] [Google Scholar]
- 23.Diekert K, de Kroon AIPM, Kispal G, Lill R. In: Mitochondria. Pon LA, Schon EA, editors. Vol. 65. Academic Press; San Diego: 2001. [Google Scholar]
- 24.Sbalzarini I, Koumoutsakos P. J. Struct. Biol. 2005;151:182–195. doi: 10.1016/j.jsb.2005.06.002. [DOI] [PubMed] [Google Scholar]
- 25.Hoppeler H, Vogt M, Weibel E, Flüuck M. Exp. Physiol. 2003;88:109–119. doi: 10.1113/eph8802513. [DOI] [PubMed] [Google Scholar]
- 26.Lowder T, Padgett DA, Woods JA. Brain, Behav., Immun. 2005;19:377–380. doi: 10.1016/j.bbi.2005.04.002. [DOI] [PubMed] [Google Scholar]
- 27.Hewitt M, Creel A, Estell K, Davis I, Schwiebert L. Am. J. Respir. Cell Mol. Biol. 2009;40:83. doi: 10.1165/rcmb.2008-0172OC. [DOI] [PMC free article] [PubMed] [Google Scholar]
- 28.Oberholzer F, Claassen H, Moesch H, Howald H. Schweiz. Z. Sportmed. 1976;24:71. [PubMed] [Google Scholar]
Associated Data
This section collects any data citations, data availability statements, or supplementary materials included in this article.


