Abstract
Introduction
To investigate the functional significance of force fluctuations during voluntary contraction with a select muscle group, we examined the association between force fluctuations during voluntary contraction with plantar flexor muscles and postural sway during quiet standing in 20 young and 20 elderly adults.
Methods
Young and elderly subjects maintained a quiet standing position on a force platform. They also performed a force-matching task with unilateral isometric plantar flexion.
Results
A positive correlation was found in young and elderly adults between the coefficient of variation (CV) of center of pressure during quiet standing and the CV of force during plantar flexion only at contraction intensities ≤ 5% maximum voluntary contraction that corresponded to muscle activity during quiet standing. The electromyogram power in the medial gastrocnemius was greater in elderly than young adults around 10 Hz during quiet standing and at low contraction intensities during plantar flexion.
Conclusion
Fluctuations in motor output during low-intensity plantar flexion were associated with postural sway during quiet standing in both young and elderly adults.
Keywords: Aging, Ankle torque, Postural control, Steadiness
INTRODUCTION
Deteriorations in movement with advancing age, including weaker muscle force, slower movement speed, and less steady movement, can result in compromised quality of life in elderly adults. In particular, unsteady movement or large variability in motor output in elderly adults1 may lead to difficulties in the performance of daily activities such as manipulating small objects.2 Based on an assumption that performance of daily activity is influenced by variability in muscle force, force fluctuations and neuromuscular activity during voluntary steady contractions with a selected muscle group have been extensively studied as a simplified model of the physiological mechanisms that underlie unsteady movement (e.g., review by Enoka et al.3). Despite this assumption, the potential associations between the performance of daily activity and force fluctuations during isolated voluntary steady contractions are not clearly shown.4
As an example of a functional daily activity, the ability to control posture during quiet standing deteriorates with age, and the amount of postural sway during quiet standing is associated with an increased risk of fall in elderly adults.5,6 In leg muscles, force fluctuations during steady contractions are increased with prolonged inactivity (i.e., bedrest) in young adults7 and are often greater in elderly adults compared with young adults.8–10 In plantar flexor muscles, these adaptations in force fluctuations are suggested to be attributable to potential alterations in the relative amount and temporal characteristics of muscle activity in the involved muscles.7,11,12 Quiet standing is one of the basic daily activities that involves and is influenced by the contraction of plantar flexor muscles.13,14 For the plantar flexor muscles, the coefficient of variation (CV) of force is reported to be greater in elderly adults compared with young adults at contraction intensities ≤ 5% of maximal force.9 Incidentally, this amount of muscle activity in plantar flexor muscles corresponds to that observed during quiet standing.15 Hence, there seem to be common features in plantar flexor activity between steady contraction at low-contraction intensity and quiet standing.
It was thus hypothesized that the variability in postural sway during quiet standing is associated with force fluctuations during steady contractions of plantar flexor muscles at low-contraction intensity. By examining this association and the accompanying characteristics of muscle activity, the findings would clarify the functional significance of force fluctuations during steady contractions of plantar flexor muscles and may lead to an understanding of physiological mechanisms for greater postural sway in elderly adults and possibly in individuals with neurological disorders.
METHODS
Subjects
Twenty young men (mean ± SD; age: 28.1 ± 4.0 yrs, height: 172.9 ± 5.4 cm, body mass: 69.3 ± 8.3 kg) and 20 elderly men (age: 69.7 ± 2.8 yrs, height: 165.0 ± 6.6 cm, body mass: 61.1 ± 7.9 kg) volunteered for this experiment. They gave written informed consent for the study after receiving a detailed explanation of the purposes, potential benefits, and risks associated with participation in the study. All subjects were healthy with no history of any neurological disorders, and their vision corrected to normal levels with corrective lenses. All procedures used in this study were in accordance with the Declaration of Helsinki and were approved by the Committee for Human Experimentation at the Department of Life Sciences, The University of Tokyo.
Experimental protocol and measurement
The study consisted of bipedal quiet standing (QS) and steady unilateral plantar flexion (PF) at various contraction intensities in a seated position. Subjects performed QS followed by PF with a sufficient rest (> 10 min) in between.
Quiet standing
The basic setup and measurement of postural sway during QS has been described in our previous studies.15,16 Subjects were required to maintain QS barefoot on a force platform (Type 9281B; Kistler, Zürich, Switzerland) for ~40 s with eyes open. They looked at a certain point on the plain wall in front of them. Subjects held their arms by their sides and their feet parallel with a distance of 15 cm between the heels. All subjects felt comfortable in this posture. Three trials were conducted with sufficient rest between trials. The foot center of pressure (CoP) was obtained from the vertical components of the force platform. Anteroposterior displacement of the CoP was calculated from the distance between measured CoP position and the medial malleolus.17 The position of the medial malleolus was measured by high-resolution digital photographic equipment (α-7; Konica-Minolta, Tokyo, Japan).
Plantar flexion
Subjects performed a maximal voluntary contraction (MVC) followed by submaximal steady contractions with their plantar flexor muscles in the dominant leg. The dominant leg was the right leg in all subjects. The basic setup for plantar flexion was the same as in our previous studies.18,19 Subjects were comfortably seated in a semi-reclined position, and their upper body and thigh were strapped to the chair. The leg position was determined so the knee and ankle joint angles were comparable between PF and QS. Both legs were fixed with the knee joint fully extended and the ankle joint in the neutral position. The feet were attached to a metal foot plate with individual straps to each foot. The feet were parallel with a distance of 15 cm between the heels. PF force by the dominant (right) leg was measured with a custom-made force-measurement device.12 A strain gauge transducer (LTZ-200KA; Kyowa, Tokyo, Japan) was fixed to the device between a base metal plate and a foot lever plate near the distal part of the foot.
The MVC involved a gradual increase in the PF force exerted by the plantar flexor muscles from baseline to maximum in 3–4 s and then sustained at maximum for 2 s. The PF force was displayed real-time on an oscilloscope. The timing of the task was based on a verbal count given at a 1 s interval, with vigorous encouragement from the investigators when the force began to plateau. Subjects performed at least three MVC trials with subsequent trials performed if the differences in the peak force of two MVCs were > 5%.20 The trial with the highest peak force was chosen for analysis. In addition, MVCs for unilateral dorsiflexion were performed in a similar manner to determine the maximal activity of the dorsiflexor muscle.
After ~10 min rest, subjects were asked to contract their plantar flexor muscles and to maintain PF force about a target value as steadily as possible for 40 s. The contraction intensities were 2.5, 5, 10, 15, and 20% of subjects’ MVC. The target and exerted forces were presented to the subjects as horizontal lines on the oscilloscope ~50 cm away. The gain of the visual feedback was adjusted so the full range of the vertical axis of the oscilloscope corresponds to twice the target force. There were 3 trials with a rest of at least 3 min between each PF trial. The order of the contraction intensity was pseudo-randomized across subjects.
Data recording
For both QS and PF, the surface electromyogram (EMG) was recorded from the bellies of the right soleus (SOL), medial gastrocnemius (MG), lateral gastrocnemius (LG), and tibialis anterior (TA) muscles. Bipolar Ag–AgCl electrodes were used with a diameter of 10 mm and interelectrode distance of 20 mm. The common reference electrode was placed on the medial malleolus. The electrodes were connected to a preamplifier and differential amplifier (× 1,000) with a bandwidth of 20 Hz to 500 Hz (SX203; Biometrics Ltd, Gwent, U.K.).16 The foot CoP during QS was recorded with the force platform. The PF force was measured with a strain gauge transducer attached to the foot plate. All signals were sampled at a rate of 1 kHz by a 16-bit analog-to-digital converter (PowerLab/16SP; ADInstrument, Sydney, Australia) and stored on the hard disk of a personal computer for later analyses.
Data Analysis
To compare motor output variability between QS and PF, the CV of CoP displacement during QS and the CV of PF force during PF were calculated. For QS, we focused on anteroposterior CoP sway because force produced by plantar flexor muscles contributes mainly to the body sway in this direction.14,15 The CV of CoP is comparable to the root-mean square and/or standard deviation of CoP trajectory that is commonly used in assessing the variability in postural control.5,21
For both QS and PF, the 30-s data in the middle portion were selected from each trial (~ 40 s). The CoP and force data were passed through a low-pass filter of 30 Hz using a fourth-order Butterworth filter before the CV of CoP displacement and PF force were calculated.14 The EMG was full-wave rectified and averaged over the entire period to yield the average amplitude (AEMG). The AEMG was further expressed in the normalized value as a percentage of the corresponding maximal value (%MVC) during the MVC of unilateral plantar flexion and dorsiflexion.
For further analysis of the frequency content of the signals, the 30-s data was first divided into 13 segments that were 212 points long (4.098 s). Almost half of the selected 4.098 s segments overlapped with the adjacent segments.22 A twelve-bit fast-Fourier transform algorithm was then applied to these segments to yield the power spectrum. Consequently, the frequency resolution of the power spectrum was 0.244 Hz. An ensemble-averaged power spectrum across these segments was calculated as the power spectrum density of CoP or PF force. The mean power spectrum across the 1-Hz window was further calculated up to 10 Hz, and each calculated value was expressed as the percentage of total power.
Rectification of the EMG signal is a strategy that has been used to reveal the temporal pattern of grouped motor unit discharges.23,24 Therefore, we also calculated the power spectrum of the rectified EMG in a similar procedure. The mean power spectrum across the 5-Hz window was calculated up to 50 Hz,12 and each value was normalized as the percentage of the total power spectrum.
Statistical analyses
The average value for 3 trials was statistically analyzed except for the MVC values. To identify the difference between young and elderly adults, the CV was compared with a one-factor (age) ANOVA for QS and a two-factor (age and intensity) ANOVA with repeated measures on 5 intensities for PF force. The power spectrum density of CoP and PF force was tested using a two-factor (age and frequency bin) ANOVA with repeated measures on 20 frequency bins for QS and a three-factor (age, frequency bin, and intensity) ANOVA with repeated measures on 10 frequency bins and 5 intensities for PF. The AEMG was tested using a two-factor (age and muscle) ANOVA with repeated measures on 4 muscles for QS and a three-factor (age, intensity, and muscle) ANOVA with repeated measures on 5 intensities and 4 muscles for PF. The power spectra of rectified EMG were tested using a three-factor (age, frequency bin, and muscle) ANOVA with repeated measures on 20 frequency bins and 4 muscles for QS and a four-factor (age, frequency bin, intensity, and muscle) ANOVA with repeated measures on 10 frequency bins, 5 intensities, and 4 muscles for PF. An alpha level of 0.05 was chosen for all initial statistical comparisons, with Tukey post-hoc comparisons performed when necessary. A linear regression analysis was also performed to identify significant correlation between variables. Data are given as means ± SD in the text and tables, and as means ± SE in the figures.
RESULTS
The MVC of PF was significantly smaller in elderly (741 ± 199 N) than young adults (1125 ± 191 N) by ~52% (P < 0.05). As a result, the mean force for the steady contraction task were higher in young (28 ± 5 N at 2.5% MVC to 221 ± 37 N at 20% MVC) than elderly adults (19 ± 5 N at 2.5% MVC to 147 ± 39 N at 20% MVC).
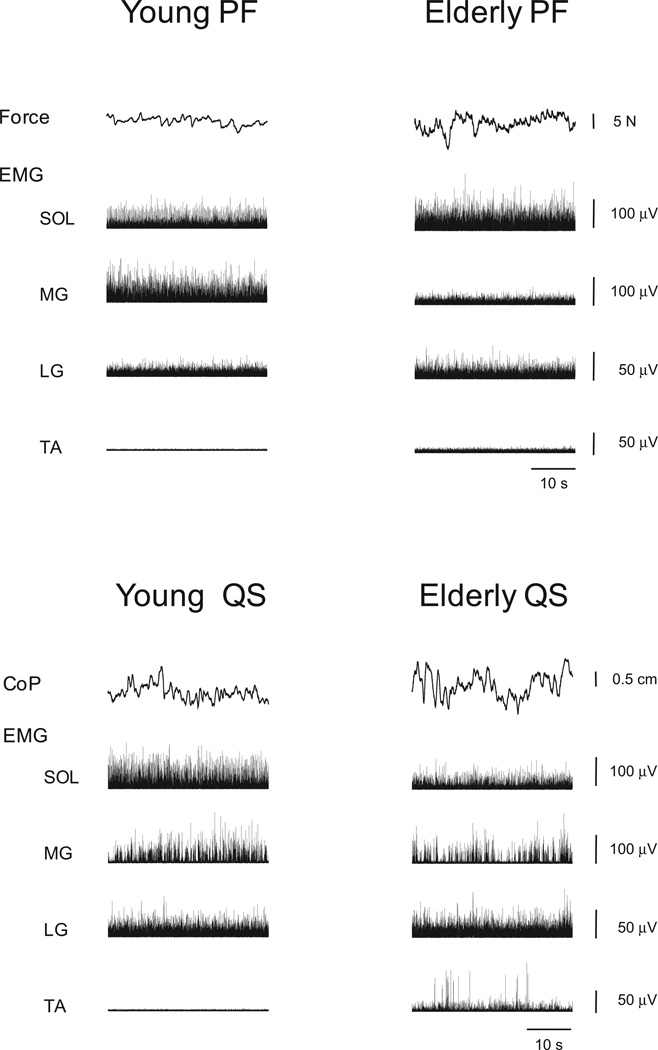
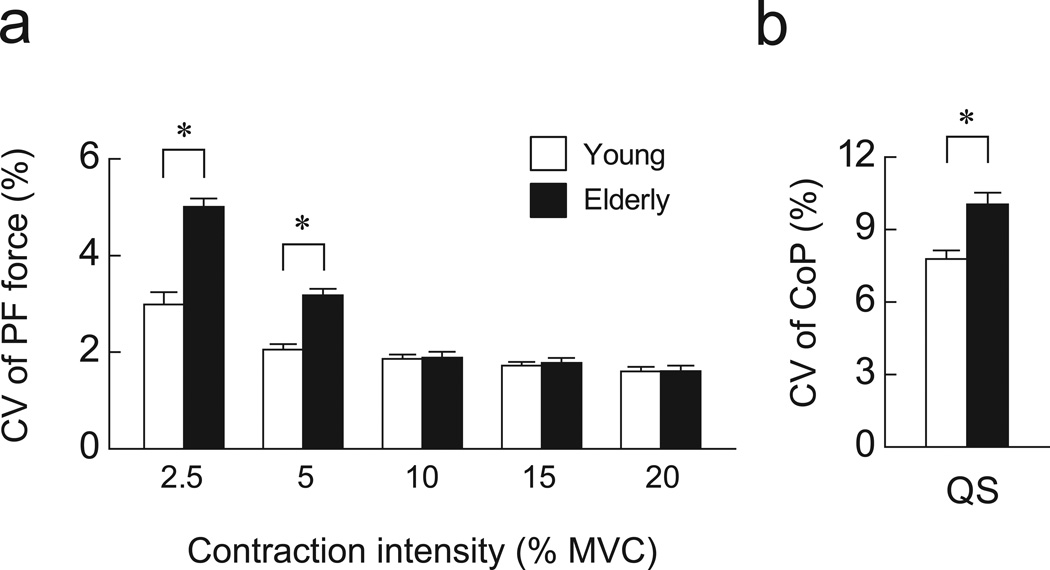
PF force and CoP fluctuated about the mean value in both age groups. In representative recordings, the fluctuations appeared to be greater in elderly than in young adults for both PF and QS (Fig. 1). In the group data for PF, the CV of PF force was significantly greater in elderly than young adults (P < 0.05, Fig. 2a) at low contraction intensities (2.5% and 5% of MVC) but not at higher contraction intensities (10%-20% MVC). For QS, the CV of CoP was significantly greater in elderly than young adults (P < 0.05, Fig. 2b).
Figure 1.
Representative recordings of fluctuations in plantar flexion force or foot center of pressure (CoP), rectified electromyogram (EMG) in soleus (SOL), medial gastrocnemius (MG), lateral gastrocnemius (LG) and tibialis anterior (TA) during steady isometric plantar flexion (PF) at 5% of maximal voluntary contraction (top panels) and during quiet standing (QS) (bottom panels) in young (left column) and elderly (right column) adults.
Figure 2.
The coefficient of variation (CV) of force during PF at various intensities (a) and the CV of CoP during QS (b). Open and filled bars indicate young and elderly adults, respectively. *, significant difference between young and elderly adults (P < 0.05).
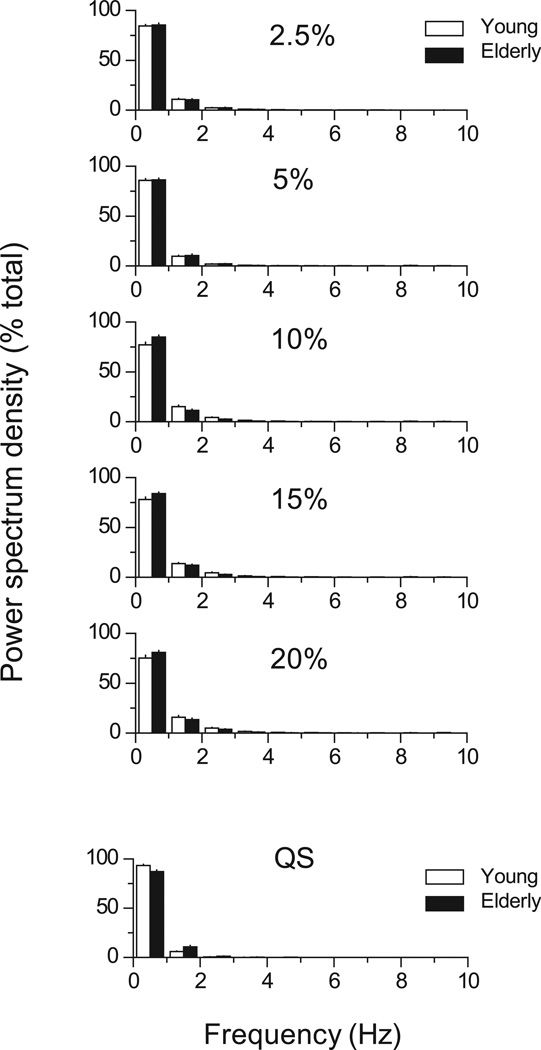
When the power spectrum density of force and CoP were presented for every 1 Hz-bin, the major frequency was < 1 Hz. There was no significant difference in the power spectrum distribution of these signals between young and elderly adults (Fig. 3).
Figure 3.
Power spectrum density of force during PF at various intensities and during QS (bottom). Power spectrum density is presented every 1-Hz bin as a percentage of total power. Open and filled bars indicate young and elderly adults, respectively.
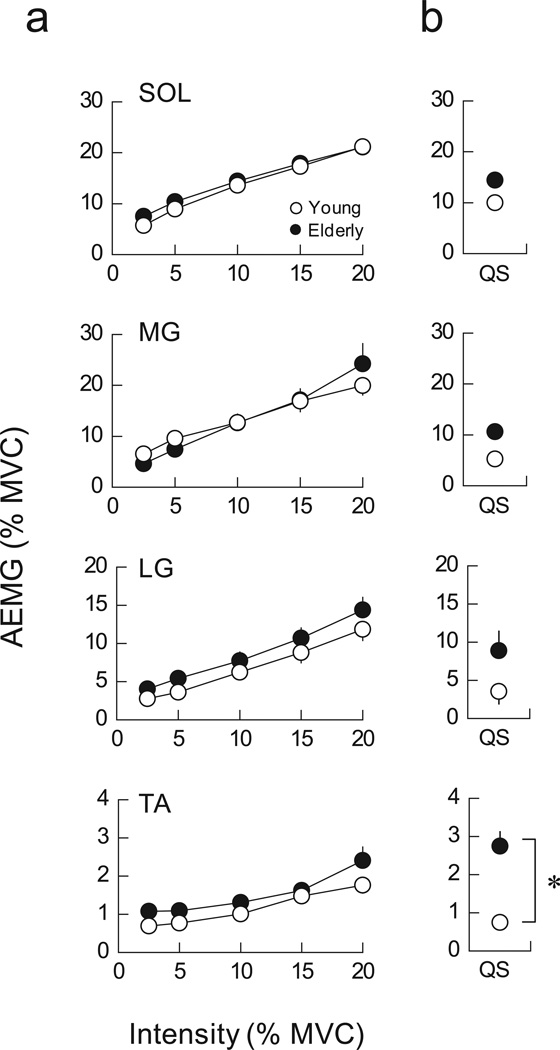
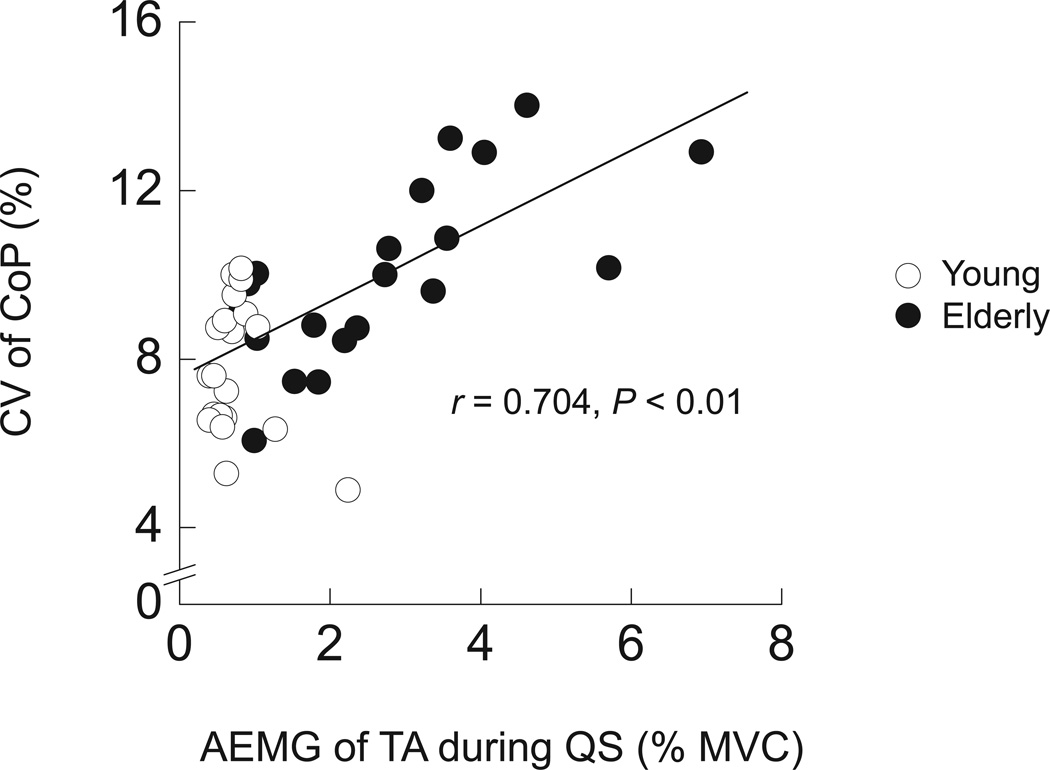
AEMG during PF increased linearly with contraction intensity and was not different between young and elderly adults in any muscle (Fig. 4a). In QS, AEMG tended to be greater in young than in elderly adults, but there was no statistically significant difference in any muscle (Fig. 4b). In contrast, AEMG in TA, an antagonist to plantar flexor muscles, was significantly greater in elderly than in young adults during QS. To assess the association between this greater coactivation and greater postural sway in elderly adults, the correlation between AEMG in TA and the CV of CoP was calculated. A highly significant correlation between these variables was found in elderly (r = 0.704, P < 0.01) but not in young adults (Fig. 5).
Figure 4.
The amplitude of EMG (AEMG) in SOL, MG, LG and TA during PF at various intensities (a) and during QS (b) in young and elderly adults. Open and filled symbols indicate young and elderly adults, respectively. *, significant difference between young and elderly subjects (P < 0.05).
Figure 5.
The CV of CoP as a function of AEMG of TA during QS in young and elderly adults. Open and filled symbols indicate young and elderly adults, respectively. The superimposed line indicate the linear regression line with statistical significance for elderly subjects (n = 20, P < 0.01).
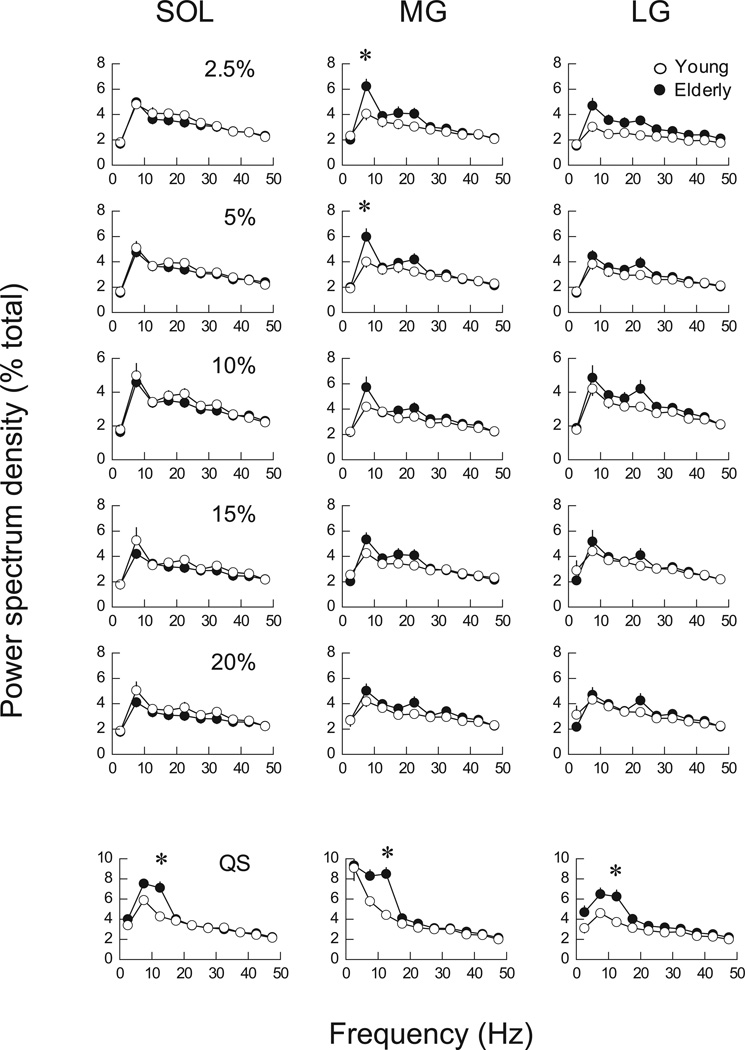
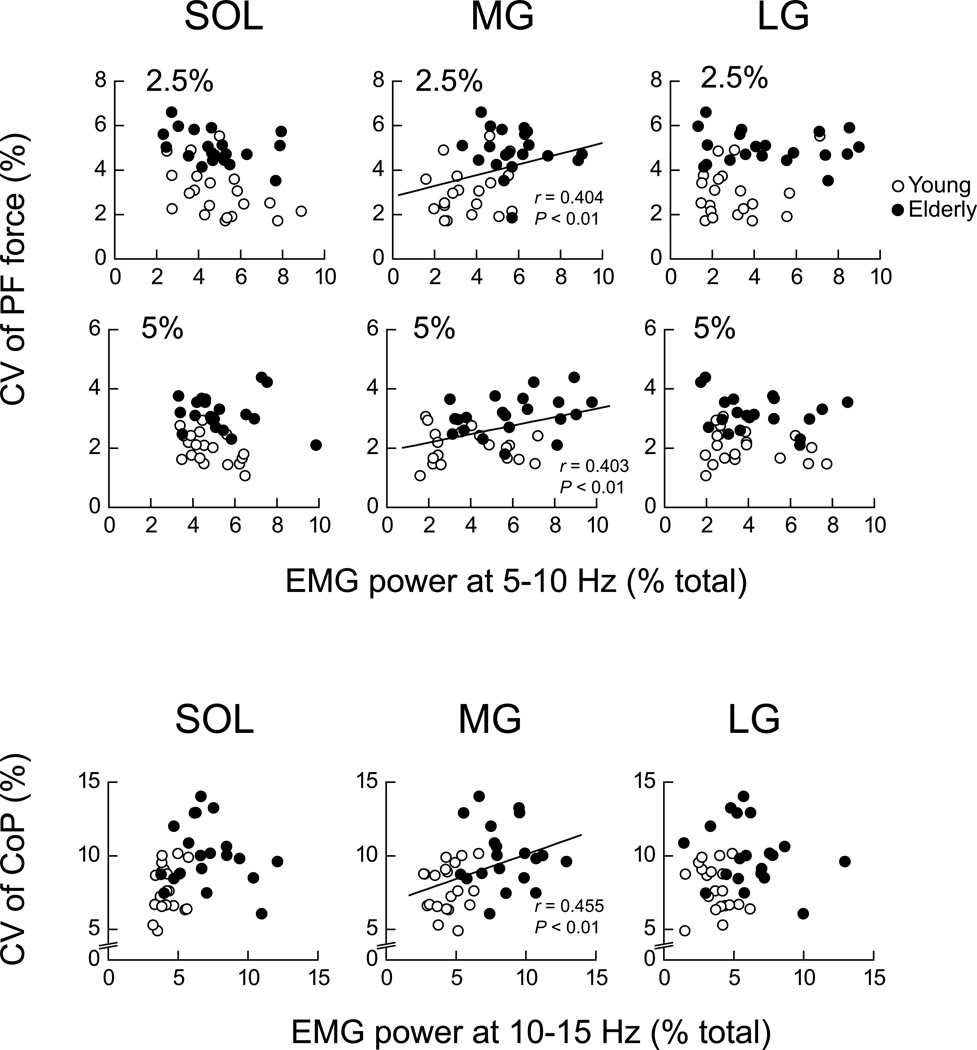
For the frequency content of AEMG, there was no significant difference in the power distribution of SOL and LG between young and elderly adults across contraction intensities during PF. The only significant difference between groups in PF was the greater power (P < 0.05) in MG in the 5–10 Hz bin in elderly than in young adults at 2.5% and 5% MVC (Fig. 6). When these data were plotted together for young and elderly adults, the EMG power of MG in the 5–10 Hz bin correlated significantly with the CV of PF (Fig. 7). For QS, the power spectrum density of rectified EMG was significantly greater only in the 10–15 Hz bin in elderly than in young adults across plantar flexor muscles (P < 0.05, Fig. 6 bottom). When the data for young and elderly adults were plotted together, the EMG power in the 10–15 Hz bin was significantly correlated with the CV of CoP only for MG (Fig. 7).
Figure 6.
Power spectrum density of the rectified EMG in SOL, MG, LG and TA during PF at various intensities and during QS (bottom). Power spectrum density is presented every 5-Hz bin as a percentage of total power. Open and filled symbols indicate young and elderly adults, respectively. *, significant difference between young and elderly subjects (P < 0.05).
Figure 7.
Scatter plots of the CV of PF as a function of the power spectrum density of the rectified EMG at 5–10 Hz bin for SOL, MG and LG during PF (upper panels). Scatter plots of the CV of CoP as a function of the power spectrum density of the rectified EMG at 10–15 Hz bin for SOL, MG and LG during QS (lower panels). Power spectrum density is presented as a percentage of total power. Open and filled symbols indicate young and elderly adults, respectively. Superimposed lines indicate the linear regression lines with statistical significance (n = 40, P < 0.05) for young and elderly adults combined.
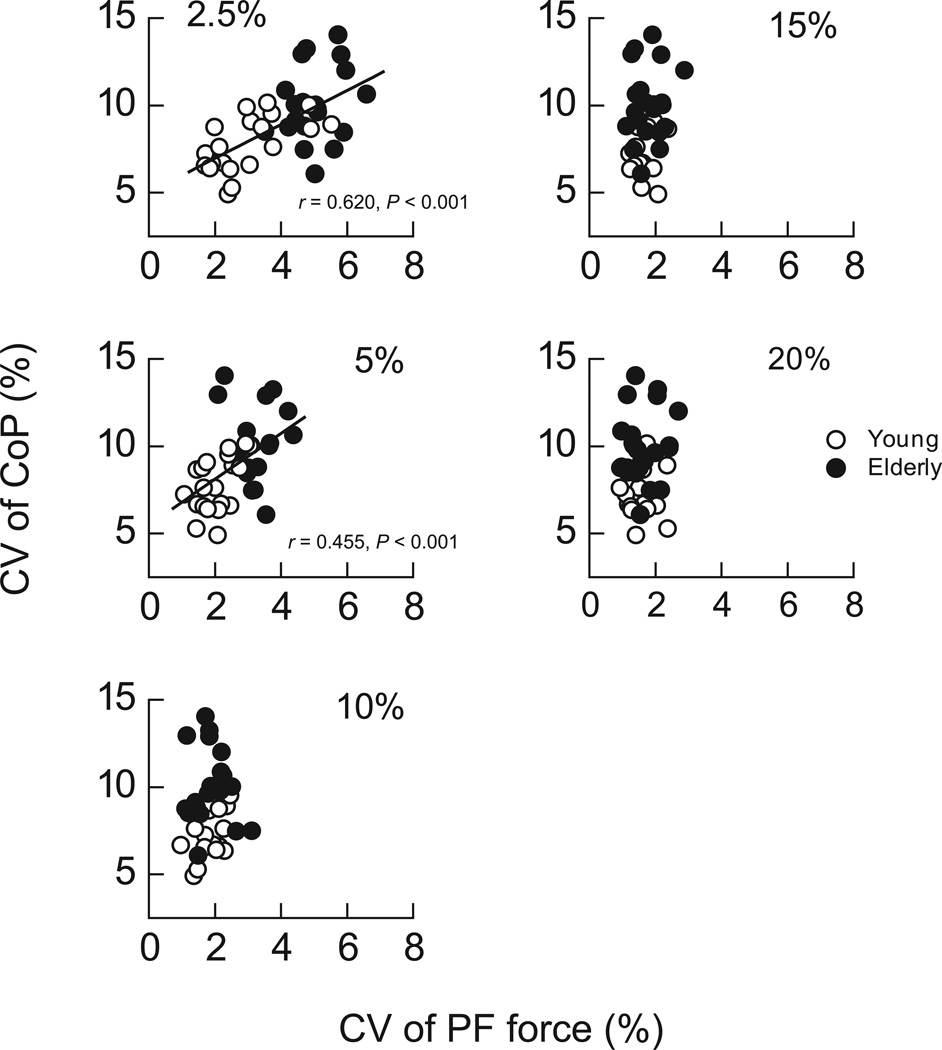
To examine if there was an association in motor output fluctuations between PF and QS, the correlation between the CV of CoP and the CV of PF force was assessed in both age groups combined (Fig. 8). A significant positive correlation was found between the CV of CoP and the CV of PF force at low contraction intensities at 2.5% (r = 0.620, P < 0.01) and 5% of MVC (r = 0.455, P < 0.01). In contrast, there was no significant correlation between the CV of CoP and the CV of PF force at contraction intensities above 5% of MVC.
Figure 8.
Scatter plots of the CV of CoP as a function of the CV of PF force at various intensities in young (open symbols) and elderly (filled symbols) adults. Superimposed lines indicate the linear regression lines with statistical significance (n = 40, P < 0.05) for young and elderly adults combined.
DISCUSSION
The study compared the fluctuations in force during steady plantar flexion at various intensities between young and elderly adults and its relation to the fluctuations in CoP during quiet standing. The major finding was that the CoP fluctuations during quiet standing were positively correlated with the CV of force during plantar flexion ≤ 5% MVC when young and elderly adults were combined. In addition, EMG power around 10 Hz in medial gastrocnemius was significantly correlated with the fluctuations during quiet standing and plantar flexion. Furthermore, elderly adults had increased antagonist activity that was associated with increased CoP fluctuations.
Greater fluctuations in PF force in elderly adults
In the literature, there is one study that compared force fluctuations in plantarflexor muscles between young and elderly adults.9 With the knee joint angle of 2.62 radian (150 deg) and the ankle joint angle of 0.09 radian (5 deg) plantarflexed from a right angle, Tracy9 showed greater force fluctuations in elderly adults compared with young adults only ≤ 5% MVC. Despite different knee and ankle joint angles in our study, we found similar results (Fig. 2a), indicating that an increase in plantar flexion force fluctuations due to age or reduced use is restricted to low-contraction intensities and that the effect of age is independent of subtle differences in joint angles or muscle length.
Increased fluctuations in motor output are often associated with unique activation patterns of involved muscles including 1) increased coactivation of antagonist muscles,25 2) preferential activation of an agonist muscle,26 and 3) low-frequency modulation of an agonist muscle.11 Increased coactivation of antagonist muscles is accompanied with greater force fluctuations in elderly adults during steady contractions of a hand25 and knee extensor muscles.27 The current study did not find a difference in AEMG during PF in either the plantar flexor (agonist) or dorsiflexor (antagonist) muscle between age groups. In fact, the exact role of coactivation for the fluctuations in motor output is unclear. Burnett et al.25 found no correlation between the amount of EMG activity in the second palmar interosseus muscle and the amount of force fluctuations during isometric abduction of the index finger across individuals. Similarly, a preliminary study showed no change in position fluctuations of the index finger with increased/decreased coactivation during position matching tasks within individuals.28 Hence, it is unlikely that coactivation of antagonist muscles plays a role for the difference in the force fluctuations between young and elderly adults.
Preferential activation of an agonist muscle has been associated with increased fluctuations in arm movement in elderly adults,26 knee extension force with sustained contraction in young adults,29 and knee extension and plantarflexion forces after bedrest in young adults.7 In particular, increased force fluctuations during plantarflexion after bedrest were accompanied by a preferential increase in MG activity.7 In contrast, the similarity in AEMG between young and elderly adults in our study (Fig. 4) confirmed that aging does not induce preferential activation of plantar flexor muscles, as previously reported by Tracy.9 Hence, the difference in force fluctuations between young and elderly adults during PF is not due to preferential activation of an agonist muscle.
Low-frequency modulation of an agonist muscle is another unique activation pattern that is often accompanied by increased force fluctuations. Our study found that the rectified EMG of the MG had greater 5–10 Hz power in the elderly than in young adults only in conditions in which force fluctuations were greater in the elderly than in the young adults (i.e., at low contraction intensities ≤ 5% MVC) (Fig. 6). This difference due to aging is a new observation, but it is similar to the change due to reduced use in young adults.12 Yoshitake et al.12 found that ≤ 10 Hz power in the rectified EMG of the MG increased after bedrest only in a condition in which force fluctuations during plantarflexion were increased (in the knee-extended position) and not in another condition without increased fluctuations (in the knee-flexed position). In addition, the current low-frequency modulation of agonist muscle activity with greater age-associated force fluctuations in the leg muscles is consistent with increased relative power of 5–15 Hz in the rectified EMG in the first dorsal interosseus muscle during isometric abduction of the index finger in elderly adults.30 The significant correlation between the EMG power of 5–10 Hz and force fluctuations in this study (Fig. 7) further implies, as was the case in the adaptation in young adults to reduced use (bedrest), that low-frequency modulation of the MG activity may contribute, at least in part, to greater force fluctuations during PF in elderly adults.
Association between PF fluctuations and CoP fluctuations
We focused on plantar flexion force and CoP as mechanical motor outputs in the processes of steady motor performance that involves plantar flexor muscles. The significant association between the fluctuations in the two performance variables (i.e., fluctuations in PF force and CoP) across age groups indicates that individuals who have greater difficulty in controlling plantarflexion force during low-intensity steady contraction tend to have greater difficulty in controlling quiet standing posture. Findings on the association in motor output fluctuations between steady motor tasks are mixed in the literature.31–33 It appears to depend on age, contraction type, contraction intensity, and involved muscles. Since the same muscles are involved in both tasks in our study, it is temping to speculate that individuals may have similar characteristics in the neural strategies for stabilization of motor performance between PF and QS. For PF, the activation strategy of the MG appears to influence the fluctuations in force according to the earlier discussion. For QS, CoP trajectory is more closely associated with muscle activity of MG compared with SOL.14 In addition, Borg et al.34 recently found a high correlation between CoP displacement and the rectified and filtered EMG in the MG during QS in both healthy young adults and multiple sclerosis patients. These reports may lead one to speculate that the activation strategy in MG may play an important role for the fluctuations in CoP during QS as well as those in PF force.
Although the control of posture during QS involves multiple pathways (e.g., vestibular, visual, and somatosensory systems),35 the significant role of plantar flexor muscle activity for CoP may be further strengthened by the fact that the significant correlations between the CoP during QS and PF force fluctuations were found only at the corresponding contraction intensities for the plantar flexor muscles in the present study. When the activation levels of plantar flexor muscles are compared between QS and PF in young adults, the activation levels in QS correspond to those in PF ≤ 5% of MVC (Fig. 4). This is consistent with our previous study that reported the activation level of MG during QS to be ≤ 5% of MVC during PF.15 It is possible that there are unidentified common features in the discharge properties of motor neurons or activation strategy of plantarflexor muscles during low-level contractions that produce the significant correlations between the CoP during QS and force fluctuations during PF ≤ 5% of MVC (Fig. 8).
However, there were distinct differences in the EMG characteristics between PF and QS that would speak against this speculation. For example, the EMG activity of MG was a tonic type of activity in PF, whereas that of MG was not tonic but phasic in QS. The different activity was manifested in the apparent difference in the frequency distribution of EMG as large MG power < 5 Hz in QS than PF (Fig. 6). In addition, although not statistically significant, elderly adults tended to have greater plantar flexor activity than young adults during QS (Fig. 4b). These results would collectively indicate that specific neural mechanisms to activate plantar flexor muscles were actually different between PF and QS although the MG activity plays a role for determining the fluctuations in both tasks.
The greater fluctuations in CoP sway in elderly than in young adults during QS (Fig. 2b) were consistent with previous studies that demonstrated impaired postural control in elderly adults as evidenced by greater amplitude of CoP trajectories, such as SD, area, range, and path length of CoP sway.5,6,21 In PF, elderly adults had greater power at 5–10 Hz in the rectified EMG of MG than young adults at low contraction intensities (Fig. 6). In QS, the rectified EMG in elderly adults had greater power than in young adults at 10–15 Hz in all plantar flexor muscles (Fig. 6). EMG activity of muscles is transformed nonlinearly to mechanical output, such as lower-frequency muscle force and joint torque.36,37 Then, changes in ankle joint torque during QS are immediately and linearly translated into changes in CoP position in a single-joint inverted pendulum model that rotates about the ankle joint.14 Therefore, greater EMG activity at 10–15 Hz across the plantar flexor muscles during QS in elderly adults, which was not observed during PF, is likely to have contributed to the fluctuations in CoP during QS in the elderly adults. This argument is supported by the significant correlation between the EMG power at 10–15 Hz in MG and fluctuations in CoP during QS in both young and elderly adults (Fig. 7). The findings imply that aging increases the EMG activity of MG at 5–10 Hz and 10–15 Hz that leads to increased fluctuations during PF and QS, respectively. In other words, increased force fluctuations due to age-related increase in EMG power around 10 Hz may amplify postural sway with age.
Greater coactivation of the TA during QS in elderly adults compared with young adults (Fig. 4) is consistent with a previous study that reported greater coactivation of the TA during QS in various conditions with regard to the size of the base of support and the availability of vision.38 Benjuya et al.38 concluded that elderly adults “seemed to have developed a strategy of stiffening and freezing their lower legs during upright standing.” If the stiffening of the lower leg muscles stabilizes the CoP during QS, however, elderly adults with greater AEMG in TA should have smaller fluctuations in the CoP. The opposite results in our study (Fig. 5) were unexpected but indicate that stiffening of lower leg muscles may not help reduce the fluctuations in CoP during QS. The positive association between the AEMG in TA and the fluctuations in CoP may rather imply that elderly adults with greater CoP fluctuations coactivate the antagonist muscle more, presumably in fear of losing the balance in case they happen to receive a perturbation. It is also possible that elderly adults had greater or more frequent activation of TA because of the marked difference of location of CoP during quiet standing between elderly and young adults in general.39,40 Collectively with the reports that showed the non-significant role of coactivation for force fluctuations,25,28 it is unlikely that the greater coactivation of the antagonist muscle played a major role for greater fluctuations in CoP and PF force in elderly adults.
Although we have focused on discussing muscle activities around the ankle joint, other potential differences between young and elderly adults should also be discussed. For example, the hip joint motion may also play an important role in the efficient maintenance of human standing.41,42 In particular, elderly adults appear to use more hip strategy compared with young adults in controlling posture.43,44 It is possible that potentially greater involvement of hip joint torque in elderly adults contributed to different EMG activity during QS between young and elderly adults. We are not able to examine this possibility, however, without the hip joint data in our study.
The above-discussed differences in motor output between young and elderly adults may be influenced by the different effects of feedback systems on motor performance. The integration of visual and somatosensory information is crucial for controlling motor output during steady muscle contractions, and vestibular information plays an additional role in controlling posture.45 It is possible that the deterioration in the quality of information and the capability for integrating information led to different neural strategies and greater fluctuations in motor output in elderly compared with young adults during PF and QS. For example, elderly adults have limited ability to process visual information, and the availability of visual information is known to exacerbate the age-related difference in variability in force and motor unit discharges during isometric contractions of the hand or leg muscles.46,47 In the current study, however, it is impossible to discuss how the potential differences in the feedback systems may induce the observed differences in muscle activity.
As a first attempt to examine the association in fluctuations in motor output between PF and QS in young and elderly adults, the findings should be interpreted in the context of the current protocol. Specifically, PF was performed unilaterally and isometrically with visual feedback; the target of the PF was comparable to the muscle activity level during QS; eyes were open during QS; whereas there were differences in the hip joint angle and gravity between PF and QS. It is possible that some of the details of these conditions may have different influences on the neural strategy and eventually on the association in fluctuations in motor output between PF and QS. Detailed examination of the complex processes of postural control or the effect of these conditions was not the scope of this study, and future studies are required to clarify the multiple processes that may be involved in neural strategies for steady motor output in PF and QS in young and elderly adults.
The association between force fluctuations during steady contraction and functional performance during daily life are inconsistent with a previous report that did not find a significant association between the force fluctuations during knee extension and the daily activity performance that involves knee extensor muscles in elderly adults.4 Manini et al.4 failed to find a significant association between CV of knee extension force and gait speed or time to complete a chair rise, stair ascent, and stair descent in elderly adults. The presence of such an association in our study is most likely because the motor tasks that were compared had greater similarity compared with those in Manini et al.4
In conclusion, a positive correlation between fluctuations in motor output in plantar flexion at ≤5% of MVC and postural sway during quiet standing was found in both young and elderly adults. The study provided evidence for the functional significance of fluctuations in motor output of select leg muscles in young and elderly adults. Greater fluctuations with enhanced ~10-Hz EMG activity in the medial gastrocnemius in both tasks in both age groups implied that age-related increases in the motor output fluctuations in these tasks were due in part to enhanced ~10-Hz EMG activity in the medial gastrocnemius. Investigation into the frequency analysis of EMG in the medial gastrocnemius may help understand the deterioration in steady control of muscle force and whole body that are often observed in healthy elderly adults and individuals with neurological disorders.
Acknowledgments
We are grateful to Kei Masani (University of Toronto) for invaluable comments on the manuscript. This work was supported, in part, by a grant from the Mitsui Sumitomo Kaijo Welfare Foundation. M. Shinohara is supported in part by NIH NS052480.
Abbreviations
- AEMG
average amplitude of electromyogram
- CoP
center of pressure
- CV
coefficient of variation
- EMG
electromyogram
- LG
lateral gastrocnemius
- MG
medial gastrocnemius
- MVC
maximal voluntary contraction
- PF
plantar flexion
- QS
quiet standing
- SD
standard deviation
- TA
tibialis anterior
REFERENCES
- 1.Galganski ME, Fuglevand AJ, Enoka RM. Reduced control of motor output in a human hand muscle of elderly subjects during submaximal contractions. J Neurophysiol. 1993;69:2108–2115. doi: 10.1152/jn.1993.69.6.2108. [DOI] [PubMed] [Google Scholar]
- 2.Kornatz KW, Christou EA, Enoka RM. Practice reduces motor unit discharge variability in a hand muscle and improves manual dexterity in old adults. J Appl Physiol. 2005;98:2072–2080. doi: 10.1152/japplphysiol.01149.2004. [DOI] [PubMed] [Google Scholar]
- 3.Enoka RM, Christou EA, Hunter SK, Kornatz KW, Semmler JG, Taylor AM, et al. Mechanisms that contribute to differences in motor performance between young and old adults. J Electromyogr Kinesiol. 2003;13:1–12. doi: 10.1016/s1050-6411(02)00084-6. [DOI] [PubMed] [Google Scholar]
- 4.Manini TM, Cook SB, Ordway NR, Ploutz-Snyder RJ, Ploutz-Snyder LL. Knee extensor isometric unsteadiness does not predict functional limitation in older adults. Am J Phys Med Rehabil. 2005;84:112–121. doi: 10.1097/01.phm.0000151940.47912.df. [DOI] [PubMed] [Google Scholar]
- 5.Maki BE, Holliday PJ, Fernie GR. Aging and postural control: a comparison of spontaneous- and induced-sway balance tests. J Am Geriatr Soc. 1990;38:1–9. doi: 10.1111/j.1532-5415.1990.tb01588.x. [DOI] [PubMed] [Google Scholar]
- 6.Panzer VP, Bandinelli S, Hallet M. Biomechanical assessment of quiet standing and changes associated with age. Arch Phys Med Rehabil. 1995;76:151–157. doi: 10.1016/s0003-9993(95)80024-7. [DOI] [PubMed] [Google Scholar]
- 7.Shinohara M, Yoshitake Y, Kouzaki M, Fukuoka H, Fukunaga T. Strength training counteracts motor performance losses during bed rest. J Appl Physiol. 2003;95:1485–1492. doi: 10.1152/japplphysiol.01173.2002. [DOI] [PubMed] [Google Scholar]
- 8.Hortobágyi T, Tunnel D, Moody J, Beam S, DeVita P. Low- or high-intensity strength training partially restores impaired quadriceps force accuracy and steadiness in aged adults. J Gerontol A Biol Sci Med Sci. 2001;56:B38–B47. doi: 10.1093/gerona/56.1.b38. [DOI] [PubMed] [Google Scholar]
- 9.Tracy BL. Force control is impaired in the ankle plantarflexors of elderly adults. Eur J Appl Physiol. 2007;101:629–636. doi: 10.1007/s00421-007-0538-0. [DOI] [PubMed] [Google Scholar]
- 10.Tracy BL, Dinenno DV, Jorgensen B, Welsh SJ. Aging, visuomotor correction, and force fluctuations in large muscles. Med Sci Sports Exerc. 2007;39:469–479. doi: 10.1249/mss.0b013e31802d3ad3. [DOI] [PubMed] [Google Scholar]
- 11.Shinohara M, Yoshitake Y, Kouzaki M. Alterations in synergistic muscle activation impact fluctuations in net force. Med Sci Sports Exerc. 2009;41:191–197. doi: 10.1249/MSS.0b013e318183c0d9. [DOI] [PubMed] [Google Scholar]
- 12.Yoshitake Y, Kouzaki M, Fukuoka H, Fukunaga T, Shinohara M. Modulation of muscle activity and force fluctuations in the plantarflexors after bedrest depends on the knee position. Muscle Nerve. 2007;35:745–755. doi: 10.1002/mus.20764. [DOI] [PubMed] [Google Scholar]
- 13.Gatev P, Thomas S, Kepple T, Hallett M. Feedforward ankle strategy of balance during quiet standing in adults. J Physiol. 1999;514:915–928. doi: 10.1111/j.1469-7793.1999.915ad.x. [DOI] [PMC free article] [PubMed] [Google Scholar]
- 14.Masani K, Popovic MR, Nakazawa K, Kouzaki M, Nozaki D. Importance of body sway velocity information in controlling ankle extensor activities during quiet stance. J Neurophysiol. 2003;90:3774–3782. doi: 10.1152/jn.00730.2002. [DOI] [PubMed] [Google Scholar]
- 15.Kouzaki M, Masani K, Akima H, Shirasawa H, Fukuoka H, Kanehisa H, et al. Effects of 20-day bed rest with and without strength training on postural sway during quiet standing. Acta Physiol. 2007;189:279–292. doi: 10.1111/j.1748-1716.2006.01642.x. [DOI] [PubMed] [Google Scholar]
- 16.Kouzaki M, Fukunaga T. Frequency features of mechanomyographic signals of human soleus muscle during quiet standing. J Neurosci Methods. 2008;173:241–248. doi: 10.1016/j.jneumeth.2008.06.008. [DOI] [PubMed] [Google Scholar]
- 17.Winter DA, Patla AE, Rietdyk S, Ishac MG. Ankle muscle stiffness in the control of balance during quiet standing. J Neurophysiol. 2001;85:2630–2633. doi: 10.1152/jn.2001.85.6.2630. [DOI] [PubMed] [Google Scholar]
- 18.Ushiyama J, Masani K, Kouzaki M, Kanehisa H, Fukunaga T. Difference in aftereffects following prolonged Achilles tendon vibration on muscle activity during maximal voluntary contraction among plantar flexor synergists. J Appl Physiol. 2005;98:1427–1433. doi: 10.1152/japplphysiol.00613.2004. [DOI] [PubMed] [Google Scholar]
- 19.Yoshitake Y, Shinohara M, Kouzaki M, Fukunaga T. Fluctuations in plantar flexion force are reduced after prolonged tendon vibration. J Appl Physiol. 2004;97:2090–2097. doi: 10.1152/japplphysiol.00560.2004. [DOI] [PubMed] [Google Scholar]
- 20.Gandevia SC. Spinal and supraspinal factors in human muscle fatigue. Physiol Rev. 2001;81:1725–1789. doi: 10.1152/physrev.2001.81.4.1725. [DOI] [PubMed] [Google Scholar]
- 21.Prieto TE, Myklebust JB, Hoffmann RG, Lovett E, Myklebust M. Measures of postural steadiness: Differences between healthy young and elderly adults. IEEE Trans Biomed Eng. 1996;43:956–966. doi: 10.1109/10.532130. [DOI] [PubMed] [Google Scholar]
- 22.Bloomfield P. Fourier Analysis of Time Series. Toronto: John Wiley & Sons; 2000. [Google Scholar]
- 23.Halliday DM, Rosenberg JR, Amjad AM, Breeze P, Conway BA, Farmer SF. A framework for the analysis of mixed time series/point process data-theory and application to the study of physiological tremor, single motor unit discharges and electromyograms. Prog Biophys Mol Biol. 1995;64:237–278. doi: 10.1016/s0079-6107(96)00009-0. [DOI] [PubMed] [Google Scholar]
- 24.Myers LJ, Lowery M, O’Malley M, Vaughan CL, Heneghan C, St Clair Gibson A, et al. Rectification and non-linear pre-processing of EMG signals for cortico-muscular analysis. J Neurosci Methods. 2003;124:157–165. doi: 10.1016/s0165-0270(03)00004-9. [DOI] [PubMed] [Google Scholar]
- 25.Burnett RA, Laidlaw DH, Enoka RM. Coactivation of the antagonist muscle does not covary with steadiness in old adults. J Appl Physiol. 2000;89:61–71. doi: 10.1152/jappl.2000.89.1.61. [DOI] [PubMed] [Google Scholar]
- 26.Graves AE, Kornatz KW, Enoka RM. Older adults use a unique strategy to lift inertial loads with elbow flexor muscles. J Neurophysiol. 2000;83:2030–2039. doi: 10.1152/jn.2000.83.4.2030. [DOI] [PubMed] [Google Scholar]
- 27.Tracy BL, Enoka RM. Older adults are less steady during submaximal isometric contractions with the knee extensor muscles. J Appl Physiol. 2002;92:1004–1012. doi: 10.1152/japplphysiol.00954.2001. [DOI] [PubMed] [Google Scholar]
- 28.Shinohara M, Marmon AR, Enoka RM. Coactivtion with hand muscles and movement fluctuations in old adults. Abstract of the American Society of Biomechanics 2007 Annual Conference. 2007:10–15. [Google Scholar]
- 29.Kouzaki M, Shinohara M, Masani K, Fukunaga T. Force fluctuations are modulated by alternate muscle activity of knee extensor synergists during low-level sustained contraction. J Appl Physiol. 2004;97:2121–2131. doi: 10.1152/japplphysiol.00418.2004. [DOI] [PubMed] [Google Scholar]
- 30.Vaillancourt DE, Larsson L, Newell KM. Effects of aging on variability, single motor unit discharge patterns, and the structure of 10, 20, and 40 Hz EMG activity. Neurobiol aging. 2003;24:25–35. doi: 10.1016/s0197-4580(02)00014-3. [DOI] [PubMed] [Google Scholar]
- 31.Shinohara M, Keenan KG, Enoka RM. Fluctuations in motor output during steady contractions are weakly related across contraction types and between hands. Muscle Nerve. 2005;31:741–750. doi: 10.1002/mus.20326. [DOI] [PubMed] [Google Scholar]
- 32.Sosnoff JJ, Newell KM. The generalization of perceptual-motor intra-individual variability in young and old adults. J Gerontol B Psychol Sci Soc Sci. 2006;61:P304–P310. doi: 10.1093/geronb/61.5.p304. [DOI] [PubMed] [Google Scholar]
- 33.Tracy BL, Mehoudar PD, Ortega JD. The amplitude of force variability is correlated in the knee extensor and elbow flexor muscles. Exp Brain Res. 2007;176:448–464. doi: 10.1007/s00221-006-0631-3. [DOI] [PubMed] [Google Scholar]
- 34.Borg F, Finell M, Hakala I, Herrala M. Analyzing gastrocnemius EMG-activity and sway data from quiet and perturbed standing. J Electromyogr Kinesiol. 2007;17:622–634. doi: 10.1016/j.jelekin.2006.06.004. [DOI] [PubMed] [Google Scholar]
- 35.Nashner LM. Analysis of stance posture in humans. In: Towed AL, Lushes ES, editors. Motor coordination. Handbook of Behavioral Neurology. New York: Plenum Press; 1981. pp. 527–565. [Google Scholar]
- 36.Fukunaga T, Kubo K, Kawakami Y, Fukashiro S, Kanehisa H, Maganaris CN. In vivo behaviour of human muscle tendon during walking. Proc Biol Sci. 2001;268:229–233. doi: 10.1098/rspb.2000.1361. [DOI] [PMC free article] [PubMed] [Google Scholar]
- 37.Kawakami Y, Muraoka T, Ito S, Kanehisa H, Fukunaga T. In vivo muscle fibre behaviour during counter-movement exercise in humans reveals a significant role for tendon elasticity. J Physiol. 2002;540:635–646. doi: 10.1113/jphysiol.2001.013459. [DOI] [PMC free article] [PubMed] [Google Scholar]
- 38.Benjuya N, Melzer I, Kaplanski J. Aging-induced shifts from a reliance on sensory input to muscle cocontraction during balanced standing. J Gerontol A Biol Sci Med Sci. 2004;59:166–171. doi: 10.1093/gerona/59.2.m166. [DOI] [PubMed] [Google Scholar]
- 39.Maki BE, Holliday PJ, Topper AK. A prospective study of postural balance and risk of falling in an ambulatory and independent elderly population. J Gerontol. 1994;49:M72–M84. doi: 10.1093/geronj/49.2.m72. [DOI] [PubMed] [Google Scholar]
- 40.van Wegen EE, van Emmerik RE, Riccio GE. Postural orientation: age-related changes in variability and time-to-boundary. Hum Mov Sci. 2002;21:61–84. doi: 10.1016/s0167-9457(02)00077-5. [DOI] [PubMed] [Google Scholar]
- 41.Aramaki Y, Nozaki D, Masani K, Sato T, Nakazawa K, Yano H. Reciprocal angular acceleration of the ankle and hip joints during quiet standing in humans. Exp. Brain Res. 2001;136:463–473. doi: 10.1007/s002210000603. [DOI] [PubMed] [Google Scholar]
- 42.Sasagawa S, Ushiyama J, Kouzaki M, Kanehisa H. Effect of the hip motion on the body kinematics in the sagittal plane during human quiet standing. Neurosci Lett. 2009;450:27–31. doi: 10.1016/j.neulet.2008.11.027. [DOI] [PubMed] [Google Scholar]
- 43.Amiridis IG, Hatzitaki V, Arabatzi F. Age-induced modifications of static postural control in humans. Neurosci Lett. 2003;350:137–140. doi: 10.1016/s0304-3940(03)00878-4. [DOI] [PubMed] [Google Scholar]
- 44.Manchester D, Woollacott M, Zederbauer-Hylton N, Marin O. Visual, vestibular and somatosensory contributions to balance control in the older adult. J Gerontol Med Sci. 1989;44:M118–M127. doi: 10.1093/geronj/44.4.m118. [DOI] [PubMed] [Google Scholar]
- 45.Horak FB, Nashner LM, Diener HC. Postural strategies associated with somatosensory and vestibular loss. Exp Brain Res. 1990;82:167–177. doi: 10.1007/BF00230848. [DOI] [PubMed] [Google Scholar]
- 46.Sosnoff JJ, Newell KM. Information processing limitations with aging in the visual scaling of isometric force. Exp Brain Res. 2006;170:423–432. doi: 10.1007/s00221-005-0225-5. [DOI] [PubMed] [Google Scholar]
- 47.Welsh SJ, Dinenno DV, Tracy BL. Variability of quadriceps femoris motor neuron discharge and muscle force in human aging. Exp Brain Res. 2007;179:219–233. doi: 10.1007/s00221-006-0785-z. [DOI] [PubMed] [Google Scholar]


