Abstract
In the treatment of type 2 diabetes mellitus a continuous therapy is required which is a more complex one. As in these patients there may be a defect in both insulin secretion and insulin action exists. Hence, the treatment depends on the pathophysiology and the disease state. In the present study, multilayered tablets of pioglitazone hydrochloride 15 mg and metformin hydrochloride 500 mg were prepared in an attempt for combination therapy for the treatment of type 2 diabetes mellitus. Pioglitazone HCl was formulated as immediate release layer to show immediate action by direct compression method using combination of superdisintegrants, namely, crospovidone and avicel PH 102. Crospovidone at 20% concentration showed good drug release profile at 2 hrs. Metformin HCl was formulated as controlled release layer to prolong the drug action by incorporating hydrophilic polymers such as HPMC K4M by direct compression method and guar gum by wet granulation method in order to sustain the drug release from the tablets and maintain its integrity so as to provide a suitable formulation. The multilayered tablets were prepared after carrying out the optimization of immediate release layer and were evaluated for various precompression and postcompression parameters. Formulation F13 showed 99.97% of pioglitazone release at 2 hrs in 0.1 N HCl and metformin showed 98.81% drug release at 10 hrs of dissolution in 6.8 pH phosphate buffer. The developed formulation is equivalent to innovator product in view of in vitro drug release profile. The results of all these evaluation tests are within the standards. The procedure followed for the formulation of these tablets was found to be reproducible and all the formulations were stable after accelerated stability studies. Hence, multilayered tablets of pioglitazone HCl and metformin HCl can be a better alternative way to conventional dosage forms.
1. Introduction
A drug delivery system (DDS) is defined as a formulation or a device that enables the introduction of a therapeutic substance in the body and improves its efficacy and safety by controlling the rate, time, and place of release of drugs in the body. The process includes the administration of the therapeutic product, the release of the active ingredient by the therapeutic product, and subsequent transport of the active ingredients across the biological membranes to the site of action. Oral route for the administration of therapeutic agents is the oldest and most convenient route because of low cost of therapy and ease of administration which leads to higher level of patient compliance. It has a wide acceptance up to 50–60% of total dosage forms and has been explored for systemic delivery of drugs via pharmaceutical products of different dosage form. Approximately 50% of the drug products available in the market are administered orally [1–3].
Conventional dosage forms are rapidly absorbed, with the ascending and descending portions of the concentrations versus time curve reflecting primarily the rate of absorption and elimination, respectively. Because of the rapid rate of absorption from conventional drug delivery systems, drugs are usually administered more than once daily, with the frequency being dependent on biological half-life (t(1/2)) and duration of pharmacological effect [4–6].
An appropriately designed controlled-release drug delivery system (CRDDS) can improve the therapeutic efficacy and safety of a drug by precise temporal and spatial placement in the body, thereby reducing both the size and number of doses required. The main objective of controlled/sustained release drug delivery is to make sure of safety and to improve effectiveness of drugs as well as patient compliance. Moreover, this controlled drug delivery system fails to achieve the stated advantages due to lack of releasing the initial bolus dose dumping and failure to achieve site specific drug delivery. Formulation of layers from different types of polymers allows manipulation over more than one rate-controlling polymer, thus enabling different kinds of drug delivery of one or more active ingredients, that is, where the drug may be released with a bolus and then at a controlled rate or by targeted drug delivery in the GI tract using pH dependent polymers [7, 8].
Diabetes mellitus is a chronic metabolic disorder characterized by a high blood glucose concentration, hyperglycemia (fasting plasma glucose >7.0 mmol/L, or plasma glucose >11.1 mmol/L two hours after a meal) caused by insulin deficiency, often combined with insulin resistance, where continuous therapy is required. Apart from diet and exercise, which are fundamental in the treatment of diabetes mellitus (DM), single oral antidiabetic drug sometimes fails to achieve and maintain glycemic control. Consequently, a combination therapy using agents with complementary mechanism of action has become a cornerstone of type 2 diabetes mellitus (T2DM) management [9].
Metformin HCl, the only available biguanide, remains the first line drug therapy for obese patients with T2DM. Daily dose of metformin HCl is 0.5–3 gm. In monotherapy under certain conditions, metformin at high doses can cause lactic acidosis, cataract. Pioglitazone HCl is an orally administered thiazolidinedione agent. Daily dose of pioglitazone HCl is 15–30 mg. Pioglitazone sensitizes peripheral tissues to insulin and hence may cause hypoglycemia when insulin is used concomitantly, though hypoglycemia can also occur with monotherapy. Multilayered tablets were formulated to avoid repetitive dosage form administration. Solubility of pioglitazone decreases with increase in pH and metformin is freely soluble drug, pioglitazone is formulated as immediate release layer, and metformin is formulated as controlled release layer. This type of combination will give better compliance [10–14].
The release retardant guar gum which was used in the present study is one of the most promising dietary fibers, which is a gel-forming galactomannan obtained by grinding the endosperm portion of Cyamopsis tetragonolobus L., a leguminous plant. All natural fiber diet works with body to achieve a feeling of fullness and to reduce hunger. It has also been used as an appetite suppressant [15–17].
2. Materials and Methods
2.1. Materials
Pioglitazone and metformin were obtained as a gift samples from Dr. Reddy's laboratories, Hyderabad and MSN formulations, Hyderabad, respectively, HPMC K4M and crospovidone were procured from Nihal traders, Hyderabad, guar gum is the grounded endosperm of Cyamopsis tetragonolobus, and all the remaining chemicals are of analytical grade.
2.2. Method
2.2.1. Preparation of Immediate Release Layer of Pioglitazone HCl (F1–F4)
Immediate release layer of pioglitazone HCl was prepared by direct compression method (Figure 4). Pioglitazone HCl, crospovidone, avicel pH-102, and lactose were accurately weighed and passed through sieve number 40. All the above ingredients as shown in Table 1 were mixed in a polybag. Talc and magnesium stearate were added after passing through sieve number 40 and mixed properly.
Figure 4.
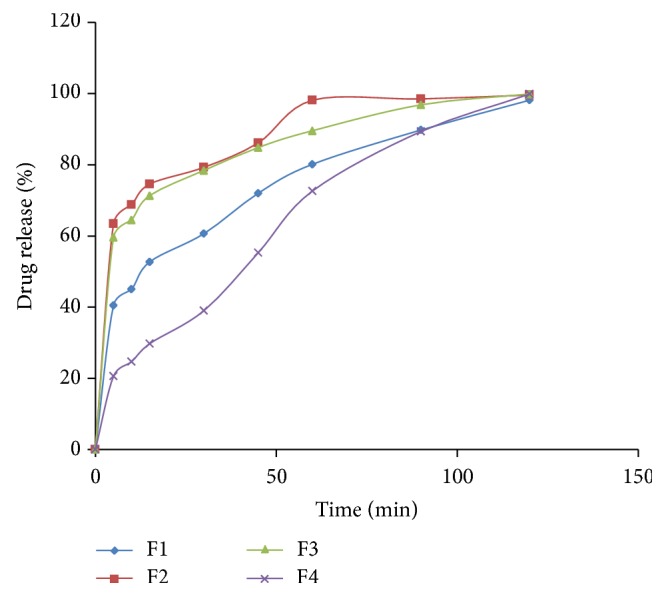
Dissolution graph of pioglitazone HCl immediate release tablets (F1–F4).
Table 1.
Composition of immediate release layer formulations of pioglitazone HCl.
| Formulation code | F1 | F2 | F3 | F4 |
|---|---|---|---|---|
| Pioglitazone HCl (mg) | 15 | 15 | 15 | 15 |
| Crospovidone (mg) | 1.5 | 2.25 | 3 | 3.75 |
| Avicel PH 102 (mg) | 2.25 | 2.25 | 2.25 | 2.25 |
| Lactose (mg) | 59.25 | 58.5 | 57.75 | 57 |
| Magnesium stearate (mg) | 1 | 1 | 1 | 1 |
| Talc (mg) | 1 | 1 | 1 | 1 |
| Total weight (mg) | 80 | 80 | 80 | 80 |
2.2.2. Preparation of Controlled Release Layer of Metformin HCl Formulated with HPMC K4M (F5–F8)
Controlled release layer of metformin HCl containing HPMC K4M was prepared by direct compression method. Metformin HCl, HPMC K4M, PVP K30, and dicalcium phosphate were passed through sieve number 40. All the above ingredients were mixed in a polybag. Talc and magnesium stearate were added after passing through sieve number 40 and mixed properly.
2.2.3. Preparation of Controlled Release Layer of Metformin HCl Formulated with Guar Gum (F9–F12)
Metformin HCl granules containing guar gum were prepared by wet granulation technique by adding PVP K 30 dissolved in distilled water as a granulating fluid. Required quantities of metformin HCl, guar gum, and dicalcium phosphate were passed through sieve number 40 and were mixed thoroughly and a sufficient volume of granulating fluid was added slowly. After enough cohesiveness was obtained, the mass was passed through sieve number 12. The obtained granules were dried at 50°C in hot air oven till a constant weight was obtained (until dry). The dried granules were then passed through sieve number 40. Talc and magnesium stearate were added after passing through sieve number 40 and mixed properly.
2.3. Procedure
Optimization process is done for immediate release layer in order to select the composition to form a multilayered tablet. The first layer consists of immediate release and the second layer consists of controlled release. The first layer was placed in the die cavity which consists of immediate release layer and punched with low compression force and then the second layer was placed in the die cavity which consists of controlled release layer and allowed for punching and finally barrier layer containing 35 mg of ethyl cellulose was placed in the die cavity and compressed with maximum compression force in order to obtain multilayered tablets by using 12 mm punches of SAIMACH SMD 16 station tablet compression machine with an average hardness of 6–8 kg/cm2. Prior to compression, the granules were evaluated for several tests.
The optimized immediate release tablet F3 is formulated into multilayer tablet containing metformin HCl as controlled release layer with two different polymers.
3. Evaluation of Flow Properties
3.1. Precompression Flow Properties [18–20]
The granules of all formulations were evaluated for powder flow properties independently for both immediate and controlled release layers. The fixed funnel method was employed to measure the angle of repose. Bulk and tapped densities were determined by tapped density apparatus from which compressibility index and Hausner's ratio values were calculated. Drug content of granules was determined spectrophotometrically and the granules prepared from wet granulation method (F9–F13) were subjected to moisture content and loss on drying by using hot air oven.
4. Evaluation of Multilayer Tablets [21–24]
4.1. Thickness
The thickness of the tablets was determined by using vernier calipers. Randomly 10 tablets selected were used for determination of thickness that was expressed in mean ± SD and unit is mm.
4.2. Uniformity of Weight
The individual weight of 20 tablets was taken after selecting them randomly for weight variation. Then their average weight and their mean and standard deviationwere calculatedand compared with the standards. The weight of the tablet being made is measured to ensure that it contains predetermined amount of drug.
4.3. Hardness
Hardness is termed as the tablet crushing strength and it is the force required to break a tablet diametrically. Hardness of tablets was measured by selecting 5 tablets randomly and the hardness of each tablet was measured with Monsanto hardness tester. The hardness was noted. The hardness is usually measured in terms of kg/cm2.
4.4. Friability
The tablet friability is a measure of loss due to abrasion. The preweighed tablets were exposed to repeated shocks in Roche Friabilator in which they are initially weighed (W o) and kept in a tumbling and rotating apparatus drum and were subjected to fall from 6 inches height. After completion of 100 rotations, the tablets were reweighed (w) and the percent loss in weight or friability (f) was calculated by the formula given below:
| (1) |
4.5. Disintegration Time
The disintegration time was determined at 37 ± 0.5°C using disintegration test apparatus in 0.1 N HCl.
4.6. Content Uniformity
Twenty tablets were powdered, and dose equivalent weight of powder blend was accurately weighed and transferred into a 100 mL volumetric flask. Initially 5 mL of methanol was added and shaken for 10 min. Then volume was made up to 100 mL with the methanol. The solution in the volumetric flask was filtered, diluted suitably, and analyzed spectrophotometrically. The drug content should be within the range between 90 and 110% of standard amount:
| (2) |
4.7. In Vitro Dissolution Studies
In vitro dissolution studies was conducted using USP dissolution apparatus-I at 37 ± 0.5°C temperature and at 50 rpm and the volume of dissolution media is 900 mL. 0.1 N hydrochloric acid was used as dissolution medium for the first two hours and 6.8 pH phosphate buffer for the remaining time. Samples of 5 mL were withdrawn at predetermined time intervals and replaced with 5 mL of fresh dissolution medium. The collected samples were suitably diluted with dissolution fluid, wherever necessary, and were analyzed for the pioglitazone HCl for the first two hours at 269 nm and for metformin HCl for the remaining time at 233 nm by using a double beam UV spectrophotometer.
4.8. Release Kinetics
The rate and mechanism of metformin release from the prepared multilayer tablets were analyzed by fitting the data in zero order as cumulative amount of drug release versus time:
| (3) |
where C is the amount of drug released at time t and K 0 is the release rate constant, first order as log cumulative percent of drug remaining versus time:
| (4) |
where C 0 is the initial concentration of drug and K is the first-order rate constant, Higuchi model as cumulative percentage of drug released versus square root of time:
| (5) |
where Q is the amount of drug released at time t and K is the diffusion rate constant, Korsmeyer-Peppas model as log time versus log cumulative percent drug release:
| (6) |
where M t is the amount of drug released at time t, M ∞ is the amount of drug release after infinite time, K is release rate constant, and n is the diffusion exponent indicative of the mechanism of drug release.
4.9. Swelling Behavior of Tablets
The extent of swelling was measured in terms of % weight gain by the tablet. The swelling behaviors of all controlled release formulations were studied. Initially one tablet from each formulation was kept in a petridish containing 6.8 pH phosphate buffers. The tablet was removed, lightly blotted with tissue paper to remove excess buffer, and reweighed for every 1 h; the weights of the tablet were noted. Percentage weight gain by the tablet was calculated by the following formula:
| (7) |
where S.I. is the swelling index, W t the weight of tablet at time t (h), and W 0 the weight of tablet at zero time.
4.10. Stability Studies
The tablets were packed in suitable packaging and the well-sealed tablets were kept in the humidity chamber and their stability studies were conducted as per ICH and WHO guidelines to assess the drug content samples which were collected at the end of the studies and were evaluated for drug release and its content. The conditions prescribed by ICH guidelines for accelerated studies are 40°C ± 2°C/75% RH ± 5% RH for 3 months.
5. Results and Discussion
5.1. FTIR Studies
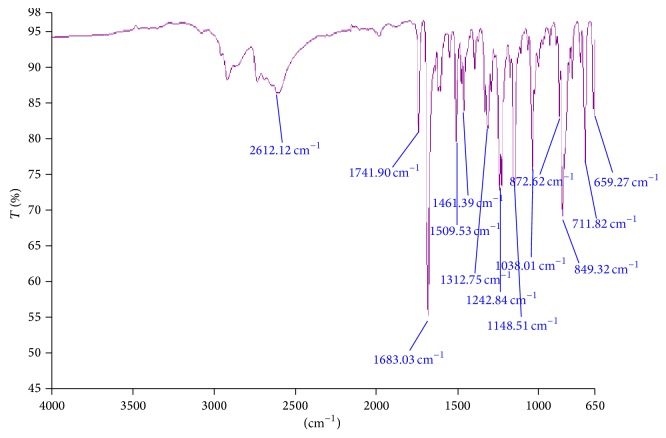
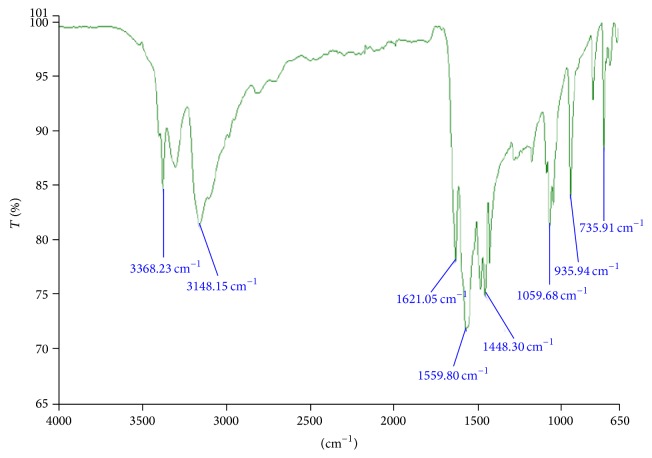
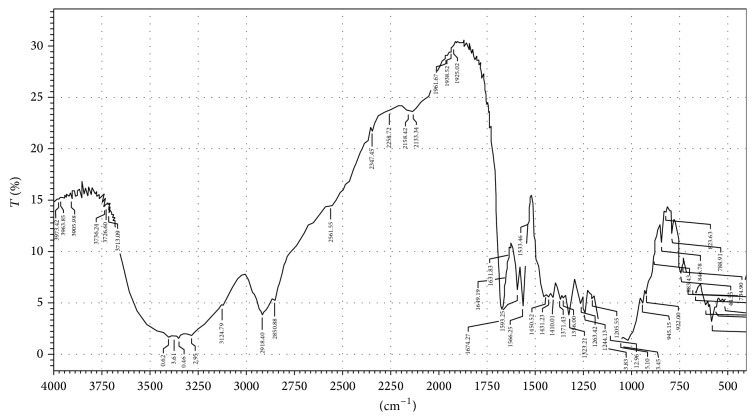
In order to investigate the possible interactions among pioglitazone HCl, metformin HCl, and different polymers/diluents, FTIR studies were carried out (Figures 1, 2, and 3). As the identical peaks were observed in all the cases, hence it was confirmed that no interaction exists between drugs and excipients. The characteristic peaks obtained in FTIR studies were shown in Table 3.
Figure 1.
FTIR graph of pure drug pioglitazone HCl.
Figure 2.
FTIR graph of pure drug metformin HCl.
Figure 3.
FTIR graph of optimized formulation.
Table 3.
Characteristic peaks of FTIR graphs.
| Bond and frequency (cm−1) | Pure drugs | Optimized multilayer tablet formulated with guar gum (cm−1) | |
|---|---|---|---|
| Metformin (cm−1) | Pioglitazone (cm−1) | ||
| N–H (1°) 3400–3250 |
3368.23 | — | 3373.61 |
|
| |||
| N–H (2°) 3400–3250 |
3148.15 | — | 3282.95 |
|
| |||
| C=N 1471–1689 |
1559.80 | — | 1566.25 |
|
| |||
| C=O 1760–1665 |
— | 1741.90 | 1674.27 |
|
| |||
| C–O 1000–1300 |
— | 1242.84 | 1244.13 |
|
| |||
| C–S 600–700 |
— | 659.27 | 682.82 |
|
| |||
| C=N 1471–1689 |
— | 1509.53 | 1533.46 |
5.2. Precompression Flow Properties
All the formulations showed good flow properties with angle of repose values between 25° and 35° and Hausner's ratio ranged between 1.10 and 1.19, whereas Carr's index values ranged between 11 and 15, and all these values are shown in Tables 4 and 5.
Table 4.
Flow properties of granules prepared by direct compression method.
| Batch number | Angle of repose | Bulk density (g/mL) | Tapped density (g/mL) | Compressibility index (%) | Hausner's ratio | Content uniformity (%) |
|---|---|---|---|---|---|---|
| F1 | 31.9 ± 0.03 | 0.63 ± 0.01 | 0.74 ± 0.04 | 11.9 ± 0.02 | 1.17 ± 0.05 | 98.8 ± 0.06 |
| F2 | 34.5 ± 0.06 | 0.75 ± 0.08 | 0.89 ± 0.02 | 12.6 ± 0.04 | 1.18 ± 0.04 | 100.7 ± 0.02 |
| F3 | 33.8 ± 0.08 | 0.65 ± 0.03 | 0.76 ± 0.07 | 14.4 ± 0.05 | 1.16 ± 0.06 | 98.5 ± 0.07 |
| F4 | 32.6 ± 0.02 | 0.72 ± 0.01 | 0.81 ± 0.06 | 12.4 ± 0.06 | 1.12 ± 0.03 | 97.8 ± 0.04 |
| F5 | 32.6 ± 0.05 | 0.43 ± 0.08 | 0.51 ± 0.02 | 14.8 ± 0.06 | 1.18 ± 0.06 | 94.8 ± 0.04 |
| F6 | 33.8 ± 0.04 | 0.51 ± 0.04 | 0.59 ± 0.05 | 13.9 ± 0.03 | 1.15 ± 0.04 | 99.6 ± 0.03 |
| F7 | 30.5 ± 0.06 | 0.46 ± 0.05 | 0.55 ± 0.08 | 11.4 ± 0.07 | 1.19 ± 0.01 | 97.9 ± 0.06 |
| F8 | 34.7 ± 0.08 | 0.39 ± 0.01 | 0.46 ± 0.01 | 12.7 ± 0.04 | 1.17 ± 0.09 | 98.6 ± 0.01 |
Table 5.
Flow properties of granules prepared by wet granulation method.
| Batch number | Angle of repose | BD (g/mL) | TD (g/mL) | C.I (%) | Hausner's ratio | Content uniformity (%) | Moisture content (%) | Loss on drying (%) |
|---|---|---|---|---|---|---|---|---|
| F9 | 28.7 ± 0.02 | 0.56 ± 0.04 | 0.62 ± 0.09 | 11.8 ± 0.07 | 1.107 ± 0.07 | 102.6 ± 0.04 | 4.6 ± 0.6 | 6.2 ± 0.4 |
| F10 | 26.3 ± 0.07 | 0.53 ± 0.08 | 0.59 ± 0.06 | 13.4 ± 0.04 | 1.113 ± 0.08 | 98.8 ± 0.05 | 5.1 ± 0.2 | 6.7 ± 0.1 |
| F11 | 25.8 ± 0.06 | 0.59 ± 0.01 | 0.65 ± 0.05 | 12.6 ± 0.06 | 1.101 ± 0.05 | 101.6 ± 0.02 | 4.3 ± 0.5 | 6.5 ± 0.8 |
| F12 | 29.1 ± 0.04 | 0.55 ± 0.05 | 0.61 ± 0.02 | 14.8 ± 0.09 | 1.109 ± 0.04 | 98.5 ± 0.05 | 5.8 ± 0.4 | 5.9 ± 0.3 |
| F13 | 25.9 ± 0.08 | 0.57 ± 0.03 | 0.63 ± 0.07 | 12.3 ± 0.07 | 1.103 ± 0.04 | 99.8 ± 0.09 | 4.5 ± 0.7 | 6.4 ± 0.2 |
5.3. Evaluation of Prepared Tablets
The tablets were visually observed and free from defects such as lamination, chipping, and capping. The prepared tablets passed all the in-process tests. The weights of the tablets are within the range. Hardness of the tablets was in the range of 2.9–7.3 kg/cm2, thickness of the tablets is within 2.65–5.20 mm, and the friability ranges between 0.17 and 0.81 percent. These results are shown in Tables 6 and 7.
Table 6.
Physical properties of immediate release tablets.
| Batch number | Weight (mg) | Hardness (kg/cm2) | Thickness (mm) | Friability (%) | Disintegration time (min) | Content uniformity (%) |
|---|---|---|---|---|---|---|
| F1 | 78.2 ± 0.5 | 3.4 ± 0.05 | 2.65 ± 0.04 | 0.75 ± 0.01 | 19′36′′ | 100.6 ± 0.4 |
| F2 | 81.6 ± 0.8 | 2.9 ± 0.13 | 2.68 ± 0.01 | 0.64 ± 0.05 | 1′24′′ | 98.6 ± 0.8 |
| F3 | 79.6 ± 0.7 | 3.1 ± 0.08 | 2.67 ± 0.02 | 0.81 ± 0.03 | 16′12′′ | 99.1 ± 0.5 |
| F4 | 80.3 ± 0.2 | 3.2 ± 0.02 | 2.68 ± 0.03 | 0.68 ± 0.04 | 16′30′′ | 97.3 ± 0.7 |
Table 7.
Physical properties of multilayer tablets.
| Batch number | Weight (mg) | Hardness (kg/cm2) | Thickness (mm) | Friability (%) |
|---|---|---|---|---|
| F5 | 749.7 ± 0.5 | 6.5 ± 0.01 | 5.08 ± 0.02 | 0.25 ± 0.03 |
| F6 | 750.2 ± 0.2 | 5.9 ± 0.03 | 5.11 ± 0.01 | 0.38 ± 0.04 |
| F7 | 751.0 ± 0.1 | 6.8 ± 0.02 | 5.09 ± 0.04 | 0.17 ± 0.02 |
| F8 | 748.9 ± 0.3 | 6.7 ± 0.05 | 5.11 ± 0.02 | 0.36 ± 0.07 |
| F9 | 749.5 ± 0.4 | 5.7 ± 0.04 | 5.07 ± 0.02 | 0.41 ± 0.05 |
| F10 | 751.6 ± 0.1 | 6.8 ± 0.01 | 5.10 ± 0.03 | 0.28 ± 0.06 |
| F11 | 750.1 ± 0.2 | 7.2 ± 0.03 | 5.09 ± 0.01 | 0.24 ± 0.03 |
| F12 | 749.8 ± 0.4 | 6.9 ± 0.02 | 5.11 ± 0.06 | 0.36 ± 0.04 |
| F13 | 785.8 ± 0.4 | 6.8 ± 0.04 | 5.20 ± 0.05 | 0.43 ± 0.02 |
5.4. In Vitro Drug Release Profile
The drug release from F1 composed of 10% crospovidone is 98.14 ± 0.3%, F2 composed of 15% crospovidone is 99.60 ± 0.1%, F3 composed of 20% crospovidone is 99.89 ± 0.4%, and F4 composed of 25% crospovidone is 99.86 ± 0.2%. The concentration of avicel PH 102 was kept at constant in all the formulations, that is, 15%. The drug release at specific time intervals was plotted in a graph and from the drug release profile formulation F3 composed of 20% crospovidone showed good drug release profile (99.97 ± 0.5%) with least disintegration time. Hence, F3 was selected as the optimized formulation for immediate release layer for incorporation with metformin controlled release layer. The drug release from crospovidone may be due to its capillary activity with the dissolution media [25].
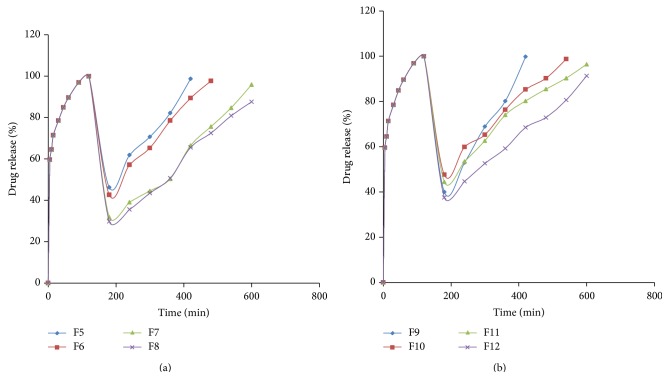
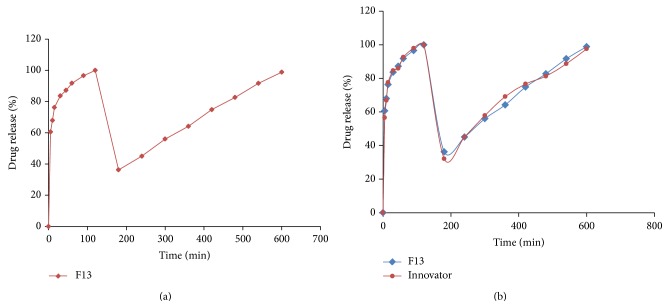
The optimized F3 was formulated into bilayer tablets containing metformin controlled release layer along with it (Table 2). The drug release from F11 was better and a barrier layer was incorporated to it in F13 to release the drug in a controlled manner. The drug release profile of the tablets was shown in Figures 5 and 6.
Table 2.
Optimized immediate release layer along with controlled release layer is formulated as bilayer tablets.
| Formulation code | F5 | F6 | F7 | F8 | F9 | F10 | F11 | F12 | F13 |
|---|---|---|---|---|---|---|---|---|---|
| Immediate release layer | |||||||||
| Pioglitazone HCl (mg) | 15 | 15 | 15 | 15 | 15 | 15 | 15 | 15 | 15 |
| Crospovidone (mg) | 3 | 3 | 3 | 3 | 3 | 3 | 3 | 3 | 3 |
| Avicel PH 102 (mg) | 2.25 | 2.25 | 2.25 | 2.25 | 2.25 | 2.25 | 2.25 | 2.25 | 2.25 |
| Lactose (mg) | 57.75 | 57.75 | 57.75 | 57.75 | 57.75 | 57.75 | 57.75 | 57.75 | 57.75 |
| Magnesium stearate (mg) | 1 | 1 | 1 | 1 | 1 | 1 | 1 | 1 | 1 |
| Talc (mg) | 1 | 1 | 1 | 1 | 1 | 1 | 1 | 1 | 1 |
| Controlled release layer | |||||||||
| Metformin HCl (mg) | 500 | 500 | 500 | 500 | 500 | 500 | 500 | 500 | 500 |
| HPMC K4M (mg) | 50 | 75 | 112.5 | 125 | — | — | — | — | — |
| Guar gum (mg) | — | — | — | — | 37.5 | 75 | 112.5 | 150 | 112.5 |
| PVP K30 (mg) | 25 | 25 | 25 | 25 | 10 | 10 | 10 | 12 | 10 |
| Dicalcium phosphate (mg) | 87 | 62 | 24.5 | 12 | 114.5 | 77 | 39.5 | — | 39.5 |
| Magnesium stearate (mg) | 4 | 4 | 4 | 4 | 4 | 4 | 4 | 4 | 4 |
| Talc (mg) | 4 | 4 | 4 | 4 | 4 | 4 | 4 | 4 | 4 |
| Distilled water | — | — | — | — | Q.S | Q.S | Q.S | Q.S | Q.S |
| Barrier layer | |||||||||
| Ethyl cellulose (mg) | — | — | — | — | — | — | — | — | 35 |
| Total weight (mg) | 750 | 750 | 750 | 750 | 750 | 750 | 750 | 750 | 785 |
Figure 5.
Dissolution graph of optimized immediate release layer formulated with metformin controlled release layer containing (a) HPMC K4 M (F5–F8) and (b) guar gum (F9–F12).
Figure 6.
Dissolution graph of optimized guar gum formulation (F13) (a) individually and (b) compared with innovator.
The drug release of pioglitazone HCl from F13 was found to be 99.94 ± 0.7% at 2 hrs of dissolution in 0.1 N HCl. The drug release of metformin HCl from F13 was found to be 98.81 ± 0.5% at 10 hrs of dissolution in 6.8 pH phosphate buffer.
The release of drug not only depends upon the nature of matrix but also depends upon the drug polymer ratio. Due to the differences in the rheological properties of the polymers, they are taken in different concentrations. Guar gum at low concentrations (F9) can retard the drug release very well compared to HPMC K4M (F5) that can retard the drug release at a slight higher concentration compared to guar gum, whereas the drug retarding capacity is similar at higher concentrations for HPMC (F7 and F8) and guar gum (F11 and F12). As HPMC K4M is a semisynthetic polymer, by direct compression, high binder concentrations are required to maintain the tablet integrity due to the poor compressibility problems of metformin HCl compared to less concentrations of binder in wet granulation formulated with guar gum that acts as a good binding agent and maintains integrity of tablets up to 8 hrs of dissolution in 6.8 pH phosphate buffer. The filler dicalcium phosphate employed in the formulations (F5–F13) is insoluble and nonswelling and also slows the drug release from the matrix [26, 27].
HPMC forms low density hydrocolloid system and a hydrogel layer would be formed which acts as a gel boundary for the delivery system that retards the drug release. The tablets swelled radially and axially during the in vitro swelling studies of HPMC and the dissolution of drug can be diffusion controlled by the formation of gel that forms a viscous layer acting as a protective barrier to both the influx of water and the efflux of the drug in solution from the polymer matrix as water uptake increases with increase in concentration of polymer, whereas the penetration of water into tablets formulated with guar gum (F9–F13) was rather slow. The guar gum formulations showed an initial burst of drug release from the matrix-embedded system, diffusion coupled with erosion might be the mechanism of the drug release at low concentrations, and the slow drug release was observed with increase in the concentration of the polymer; this might be due to the formation of thick gel layer with increasing viscosity around the tablets and this gel further inhibits the entry of release medium into the matrix and control release of the drug. The reason behind this is due to the slow erosion of the gelled layer, backbone mechanism for the drug release from the tablets containing higher amounts of guar gum [28, 29].
5.5. Release Kinetics
The data suggested that the release kinetics of the drug follow zero order drug release, as the values of regression coefficient obtained for zero order drug release profiles (r 2 = 0.8524 to 0.9932) are higher as compared to first-order drug release profiles (r 2 = 0.0098–0.4866). The in vitro release profiles of drug from all these formulations could be best expressed by Higuchi's equation as the plots showed the highest linearity (r 2 = 0.9422 to 0.9966). This indicates that the drug release from the tablets was diffusion method. To confirm the exact mechanism of drug release further the data was fitted in Korsmeyer-Peppas equation and the results showed that the drug release follows diffusion mediated Fickian model from the n value (n < 0.45) (Table 8).
Table 8.
Release kinetics of metformin HCl controlled release layer (F5–F13).
| Batch number | Zero order | Higuchi | Korsmeyer-Peppas model | First order | |||||
|---|---|---|---|---|---|---|---|---|---|
| r 2 | k | r 2 | k | r 2 | k-a | n | r 2 | k | |
| F5 | 0.9018 | 17.42 | 0.9924 | 42.15 | 0.3179 | 1.995 | 0.300 | 0.0098 | 0.0806 |
| F6 | 0.9075 | 14.56 | 0.9966 | 39.21 | 0.1962 | 1.5995 | 0.204 | 0.0362 | 0.1105 |
| F7 | 0.9533 | 10.28 | 0.9681 | 31.57 | 0.4287 | 1.8407 | 0.265 | 0.4647 | 0.2118 |
| F8 | 0.9594 | 9.99 | 0.9749 | 30.69 | 0.4556 | 1.8155 | 0.259 | 0.4866 | 0.1865 |
| F9 | 0.9511 | 18.14 | 0.9851 | 42.59 | 0.2937 | 1.9319 | 0.286 | 0.0138 | 0.1381 |
| F10 | 0.8524 | 11.80 | 0.9856 | 35.75 | 0.0456 | 1.2217 | 0.087 | 0.0698 | 0.1450 |
| F11 | 0.9062 | 10.30 | 0.9960 | 32.93 | 0.1318 | 1.1825 | 0.120 | 0.3679 | 0.2533 |
| F12 | 0.9044 | 9.44 | 0.9878 | 30.09 | 0.2408 | 1.4256 | 0.154 | 0.4158 | 0.1888 |
| F13 | 0.9932 | 9.66 | 0.9525 | 31.25 | 0.1307 | 1.6749 | 0.224 | 0.3698 | 0.2809 |
5.6. Swelling Studies
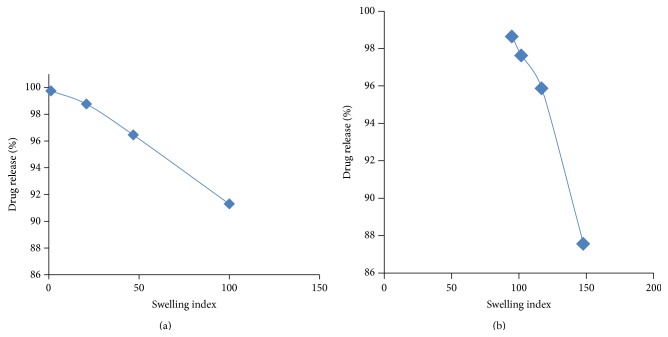
The swelling index was found to be increased with the polymer concentration. The swelling index was found to be increased with polymer concentration. There was a good correlation between the swelling index and in vitro drug release (Figure 7).
Figure 7.
Graph of swelling index versus % drug release of tablets formulated with (a) HPMC K4 M and (b) guar gum.
5.7. Stability Studies
Accelerated stability studies were performed as per ICH guidelines for optimized formulation. The tablets showed no significant changes in the physical appearance and color. The tablets were evaluated at initial, 1st month, 2nd month, and 3rd month for in vitro drug release. The in vitro release profile was the same as that of the initial one and the results were shown in Figure 8, indicating that the formulation was quite suitable.
Figure 8.
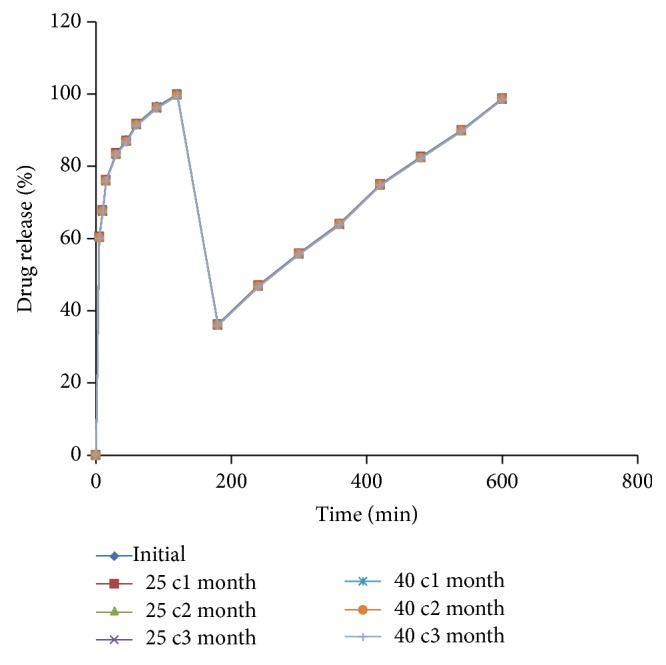
Stability studies graph of optimized multilayered tablets.
5.8. Comparison of Optimized Formulation with Marketed Formulation
The in vitro drug release profile of optimized formulation (F13) was compared with that of the marketed formulation (PIO-FIX MF 15). The % drug release of pioglitazone from marketed formulation was found to be 56.57 ± 0.3% at 5 min and 99.97 ± 0.5% at 2 hrs, whereas the drug release from the optimized formulation was found to be 60.57 ± 0.8% at 5 min and 99.94 ± 0.7% at 2 hrs, indicating that the drug release from the optimized formulation of immediate release layer of pioglitazone HCl showed better drug release compared to the innovator. The % drug release of metformin HCl from marketed formulation was found to be 97.5 ± 0.8% and from F13 was 98.81 ± 0.5% at 10 hrs. Hence, the drug release from optimized formulation was better when compared to marketed formulation.
6. Conclusion
From the experimental results, the following was concluded.
Pioglitazone HCl and metformin HCl along with the polymers and other excipients which are selected were compatible and were confirmed from the FTIR studies. A barrier layer is incorporated in F13 to release the drug in a controlled manner, such that the drug is to be eliminated before the administration of next dosage form, and in night times the metabolic processes are slow and the plasma drug concentration levels decline slowly due to the reduced elimination rate. The drug release rate from immediate layer was found to be dependent on the concentration of superdisintegrants employed whereas the controlled release layer was found to be dependent on the type of and polymer concentration employed in the tablet formulation. This may be due to the variations in the viscosity, swelling index, and type of release mechanism involved. The formulation F13 formulated with crospovidone-20%, avicel PH 102-15% in immediate release layer, guar gum-22.5%, and PVP K30-2% in controlled release layer along with the barrier layer showed the required drug release profile.
Conflict of Interests
The authors declare that there is no conflict of interests regarding the publication of this paper.
References
- 1. http://www.pharmatutor.org/articles/sustained-release-drug-delivery-system-concise-review.
- 2.Aggarwal S., Syan N., Mathur P. Bi-layer tablet technology—opening new ways in drug delivery systems: an overview. International Journal of Research in Pharmaceutical and Biomedical Sciences. 2013;4:2229–3701. [Google Scholar]
- 3.Dash T. R., Verma P. Matrix tablets: an approach towards oral extended release drug delivery. International Journal of Pharmaceutical Sciences Review. 2013;2:12–24. [Google Scholar]
- 4.Bhateja P., Kumar P., Gautam S. P., Hitesh, Dogra S., Dogra N. Formulation development and evaluation of Sustained release tablets of Aceclofenac. World Journal of Pharmaceutical Research. 2012;1:1394–1423. [Google Scholar]
- 5.Gopinath H., Sowjanya R., Chakravarthi V., Shaheda A., Sudha K. N., Kola R. Formulation and evaluation of ofloxacin floating tablets by using hydroxyl propyl methyl cellulose as polymer. Journal of Chemical and Pharmaceutical Sciences. 2012;5:974–2115. [Google Scholar]
- 6.Pandey S., Niraj, Gupta M. M., Chauhan B. S. Bilayer tablets: recent trends in oral drug delivery with present and future prospects. International Journal of Pharma and Bio Sciences. 2013;2:2319–8141. [Google Scholar]
- 7.Brahmankar D. M., Jaiswal S. B. Biopharmaceutics & Pharmacokinetics a Treatise. 2nd. Vallabh Prakashan; [Google Scholar]
- 8.Ahmed Syed I., Rao Y. M. A modified release drug delivery Device: multilayered matrix tablets. The American Journal of PharmTech Research. 2012;2:2249–3387. [Google Scholar]
- 9.Simó R., Hernández C. Treatment of diabetes mellitus: general goals, and clinical practice management. Revista Espanola de Cardiologia. 2002;55(8):845–860. doi: 10.1016/s0300-8932(02)76714-6. [DOI] [PubMed] [Google Scholar]
- 10.Sadiq S. A., Chatterjee A., Vernon S. A. Progression of diabetic retinopathy and rubeotic glaucoma following cataract surgery. Eye. 1995;9(6):728–732. doi: 10.1038/eye.1995.185. [DOI] [PubMed] [Google Scholar]
- 11.Bouchoucha M., Uzzan B., Cohen R. Metformin and digestive disorders. Diabetes and Metabolism. 2011;37(2):90–96. doi: 10.1016/j.diabet.2010.11.002. [DOI] [PubMed] [Google Scholar]
- 12.Gabriely I., Shamoon H. Hypoglycemia in diabetes: common, often unrecognized. Cleveland Clinic Journal of Medicine. 2004;71(4):335–342. doi: 10.3949/ccjm.71.4.335. [DOI] [PubMed] [Google Scholar]
- 13.Stolar M. Safety and efficacy of Pioglitazone/Metformin combination therapy in treatment of type 2 diabetes: a rationale for earlier use. Clinical Medicine: Therapeutics. 2009;1:289–303. [Google Scholar]
- 14. Indian Pharmacopoeia. Volume 2: page No: 740. 15, 2007.
- 15. http://www.satgum.com/application.php.
- 16.Yoon S.-J., Chu D.-C., Juneja L. R. Chemical and physical properties, safety and application of partially hydrolized guar gum as dietary fiber. Journal of Clinical Biochemistry and Nutrition. 2008;42(1):1–7. doi: 10.3164/jcbn.2008001. [DOI] [PMC free article] [PubMed] [Google Scholar]
- 17. http://www.bioportfolio.com/search/hpmc-as-a-week-slimm-laxative.html.
- 18.Cooper J., Gunn C. Powder flow and compaction. In: Carter S. J., editor. Tutorial Pharmacy. CBS Publishers and Distributors; 1986. pp. 211–233. [Google Scholar]
- 19.Patel J. R., Patel B. A., Patel D. G., Patel D. S., Patel V. B. Formulation and evaluation of oral controlled drug delivery system for a model anti diabetic drug metformin. International Journal of Current Pharmaceutical Research. 2011;3:37–39. [Google Scholar]
- 20.Rangapriya M., Manigandan V., Natarajan R., Mohankumar K. Formulation and evaluation of floating tablets of Pioglitazone hydrochloride. International Journal of Pharmaceutical and Chemical Sciences. 2012;1:1048–1054. [Google Scholar]
- 21.Rohini D., Alexandar S., Chandrasekar M. J. N. Preparation and in vitro evaluation of sustained release tablet formulations of metformin HCL. Asian Journal of Pharmaceutical and Clinical Research. 2012;5(1):45–48. [Google Scholar]
- 22.Venkateswarlu K., Shanthi A. Formulation and evaluation of sustained release glipizide matrix. IOSR Journal of Pharmacy and Biological Sciences (IOSRJPBS) 2012;2(5):17–23. [Google Scholar]
- 23.Shirse P. Formulation and evaluation of bilayered tablets of HP-β-cyclodextrin complexed Glimepiride with Metformin hydrochloride for immediate and sustain release. International Journal of Pharmacy and Biological Sciences. 2012;3:148–160. [Google Scholar]
- 24.Chime Salome A., Onunkwo Godswill C., Onyishi Ikechukwu I. Kinetics and mechanisms of drug release from swellable and non swellable matrices: a review. Research Journal of Pharmaceutical, Biological and Chemical Sciences. 2013;4:97–103. [Google Scholar]
- 25.Mofizur Rahman Md., Roy S., Hasan S., et al. Effect of mode of addition of disintegrants on dissolution of model drug from wet granulation tablets. International Journal of Pharmaceutical Sciences Review and Research. 2011;2:84–92. [Google Scholar]
- 26.Abhilash G., Baby B., Rao B. P., Raja Rajan S., Ramesh K., Kumar G. R. Comparative study on the efficiency of various binder combinations for metformin tablets. Journal of Pharmacy and Pharmaceutical Science Research and Review. 2013;2:20–24. [Google Scholar]
- 27.Husen P. M., Kumar P. A., Kulkarni S. V., Someshwara Rao B. Formulation and in vitro evaluation of controlled release matrix tablets of metoclopramide hydrochloride: influence of fillers on hydrophilic natural gums. International Journal of Pharmacy and Pharmaceutical Sciences. 2012;4:181–187. [Google Scholar]
- 28.Verma S., Narang N., Upmanyu G., Sharma J. Preparation and in vitro evaluation of gastroretentive tablets of anti retroviral drug using different polymers. Current Pharma Research. 2011;3:245–249. [Google Scholar]
- 29.Singh A., Sharma P. K., Malviya R. Release behavior of drugs from various natural gums and polymers. Polimery w Medycynie. 2011;41(4):73–80. [PubMed] [Google Scholar]


