

Abstract
A global decrease in microRNA (miRNA) levels is often observed in human cancers1,2, indicating that small RNAs may have an intrinsic function in tumour suppression. To identify miRNA components of tumour suppressor pathways, we compared miRNA expression profiles of wild-type and p53-deficient cells. Here we describe a family of miRNAs, miR-34a–c, whose expression reflected p53 status. Genes encoding miRNAs in the miR-34 family are direct transcriptional targets of p53, whose induction by DNA damage and oncogenic stress depends on p53 both in vitro and in vivo. Ectopic expression of miR-34 induces cell cycle arrest in both primary and tumour-derived cell lines, which is consistent with the observed ability of miR-34 to downregulate a programme of genes promoting cell cycle progression. The p53 network suppresses tumour formation through the coordinated activation of multiple transcriptional targets, and miR-34 may act in concert with other effectors to inhibit inappropriate cell proliferation.
The p53 tumour suppressor lies at a nexus of cellular pathways that sense DNA damage, cellular stress and improper mitogenic stimulation3. p53 integrates such signals and, in response, induces growth arrest, promotes apoptosis, blocks angiogenesis, or mediates DNA repair in a context-dependent manner4. The importance of p53 in preventing tumour formation is indicated by the presence of mutations in the p53 pathway in nearly all cancers5. Although p53 is most studied as a transcriptional activator, several reports have suggested that p53 represses the expression of specific genes6. Studies of p53-mediated repression have shown that both genes that modulate apoptotic responses and genes that promote cell cycle progression can repressed by p53 (ref. 7).
miRNAs enforce post-transcriptional silencing through the RNA interference pathway8. p53-mediated induction of one or more miRNAs could therefore allow it to exert negative effects on gene expression indirectly. To explore the possibility that miRNAs might constitute part of the p53 tumour suppressor network, we examined miRNA expression profiles in wild-type and p53-deficient mouse embryonic fibroblasts (MEFs). Using the semi-quantitative reverse-transcription-polymerase chain reaction (QRT-PCR)9, we measured the expression of a panel of 145 mouse miRNAs in wild-type or p53−/− MEFs that ectopically express various oncogenes (Fig. 1a, and Supplementary Fig. S1). miRNA expression was strongly affected by genetic alterations, because unsupervised clustering grouped MEFs according to their genotype (Supplementary Fig. S1). The expression of three miRNAs, miR-34a, miR-34b and miR-34c, was precisely correlated with p53 status (Fig. 1a). This raised the possibility that mir-34 genes might be regulated by p53.
Figure 1. Expression of miR-34 is correlated with p53 status in MEFs.
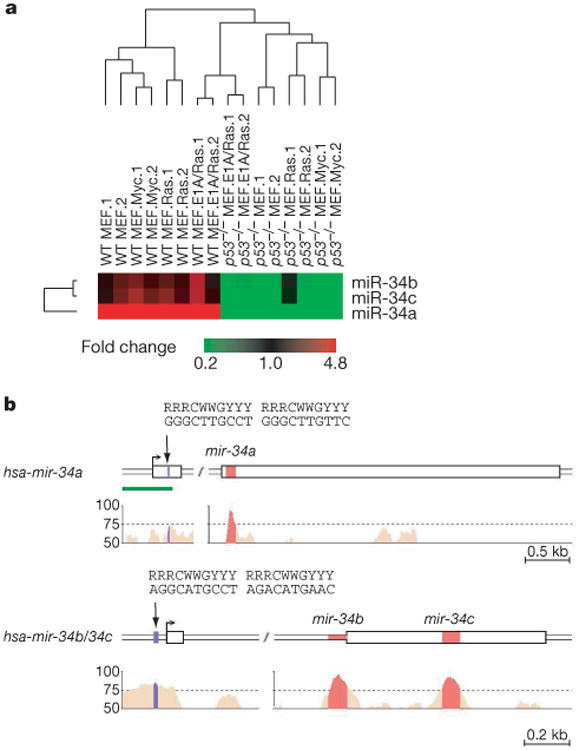
a, An unsupervised hierarchical clustering based on miRNA expression profiles in wild-type and p53−/− MEFs with the indicated additional genetic alteration. Two independently constructed cell lines (.1 and .2) were analysed in each case. The complete heat map (linear scale) is presented in Supplementary Fig. S1. b, Predicted gene structures for human mir-34a and mir-34b/c were generated by combining information from expressed sequence tag databases, CAGE databases and 5′ rapid amplification of cDNA ends. Sequence conservation between human, mouse and rat are represented as the percentage of conservation in the Vista analysis shown in the lower panel. The promoter regions of mir-34a and mir-34b/c each contain a palindromic sequence (shown in blue) that matches the canonical p53 binding site. The green bar indicates a CpG island. kb, kilobase.
miR-34s belong to an evolutionarily conserved miRNA family, with single, recognizable orthologues in several invertebrate species (Supplementary Fig. S2). According to predicted gene structures, human miR-34a is located within exon 2 of its primary transcript, whereas miR-34b and miR-34c are located within intron 1 and exon 2, respectively, of the same primary transcript (Fig. 1b). Aside from the miRNAs themselves, the only other region of significant sequence conservation in mir-34 genes lies in their putative promoter regions (Fig. 1b).
Because expression of miR-34s was correlated with p53 status, we asked whether miR-34s were directly regulated by p53. In MEFs expressing a tetracycline-regulated p53 short hairpin RNA (shRNA), endogenous p53 activity gradually increased over 6–8 days after repression of the shRNA6. Reactivation of p53 led to significant induction of both primary (pri-) mir-34 transcripts and mature miR-34s (Fig. 2a, and Supplementary Fig. S3A). The kinetics and magnitude of induction were comparable to those of the canonical p53 target, p21 (Supplementary Fig. S3A). Silencing of p53 in human tumour cell lines led to a roughly fourfold decrease in miR-34a levels (Supplementary Fig. S3B).
Figure 2. Genes encoding miR-34 are direct targets of p53.

a, miR-34 levels were measured in MEFs expressing a tetracycline-repressible p53 shRNA6 at the indicated times after the addition of doxycycline. White columns, mature miR-34a; grey columns, mature miR-34b; black columns, mature miR-34c. b, Wild-type and p53−/− animals were subjected to 6 Gy of ionizing radiation (IR), and miR-34 levels (identified as in a) were measured in spleens by Taqman assays both before and at the indicated times after irradiation. Unt., unirradiated. c, A group of 191 miRNAs and selected miRNA* sequences were quantified by QRT-PCR in TOV21G cells before and after treatment with 0.1 μg ml−1 adriamycin (Adr.). Results are presented in a logarithmic-scale dot plot of copy number per cell. The full data set is presented in Supplementary Table S1. d, Hepatocellular carcinomas were produced by combined expression of activated Ras and a conditional p53 shRNA13. p53 suppression was relieved by treatment with doxycycline (Dox.). Tumours were harvested at the indicated times during treatment with doxycycline, and levels of mature miR-34 were measured by Taqman assays. Levels are plotted with respect to tumours before p53 reactivation. Left: white columns, pri-mir-34a; grey columns, pri-mir-34b/34c; black columns, mp21. Right: column colours as in a. e, ChIPs were performed with p53 antibodies on wild-type MEFs (white columns) or p53−/− MEFs (black columns) treated with adriamycin. BS indicates quantification of the fragment containing the predicted p53 binding site in the mir-34a, mir-34b/c or p21 promoter regions, and Ctrl indicates a 3′ fragment from the same gene. Signals were normalized to glyceraldehyde-3-phosphate dehydrogenase (GAPDH) for each genotype. f, Firefly luciferase coding sequences were placed under the transcriptional control of human mir-34a or mir-34b/c promoter elements containing either wild-type or mutant (as indicated) p53 binding sites. These reporters were co-transfected with either control (white columns) or human p53 expression plasmids (black columns). Transfections were normalized by using a simultaneously delivered Renilla luciferase expression plasmid, pRLTK. In all cases, error bars indicate s.d. (n = 3).
Multiple physiological stresses can induce the accumulation of p53 protein and activate p53-mediated transcriptional programmes. DNA damage mediates p53 activation mainly through post-translational modification10,11. In a p53-dependent manner, both pri-mir-34s and mature miR-34s were induced by ionizing radiation in a variety of mouse tissues, including spleen, colon, thymus and kidney (Fig. 2b, Supplementary Fig. S4A, and data not shown). miR-34s were also induced after DNA damage in wild-type but not p53-null MEFs, with an amplitude and kinetics that closely resembled those of p21 (Supplementary Fig. S4B, C). Similarly, in TOV21G cells, a human ovarian cancer cell line, members of the miR-34 family had one of the highest levels of induction after DNA damage among the miRNAs examined (Fig. 2c, and Supplementary Table S1).
Oncogene activation often induces the p53 pathway through induction of ARF (alternative reading frame)12. Such a response was evident in a mouse hepatocellular carcinoma model, in which tumorigenesis driven by activated Ras required continuous suppression of p53 by an inducible shRNA13. Repression of the shRNA allowed Ras-mediated activation of endogenous p53 and resulted in the senescence of tumour cells13. Under these circumstances, all three miR-34s were strongly induced, supporting their regulation by p53 in vivo (Fig. 2d). Similarly, oncogenic stress can induce miR-34a in cultured primary human fibroblasts (data not shown).
One of the few conserved regions within the genes encoding miR-34 family members contains a match to the canonical p53 binding site (see Fig. 1b). To test p53 binding to these sites, we performed chromatin immunoprecipitation (ChIP). In wild-type MEFs, in which p53 activity was induced by DNA damage, regions of the genes encoding both miR-34a and miR-34b/c that contained putative p53 binding sites were enriched in p53 immunoprecipitates. This enrichment was absent from similarly treated p53-null MEFs (Fig. 2e). These same sites were previously detected in genome-wide chromatin occupancy experiments with p53, though their significance for regulation of miR-34s was not noted14. To examine the potential of mir-34 promoters to confer p53 regulation, we inserted fragments of the mouse or human genes encoding miR-34a or miR-34b/c upstream of a luciferase-coding region. Co-transfection of these reporters with a p53 expression vector robustly stimulated luciferase expression (Fig. 2f, and data not shown). Mutation of p53 binding sites in these reporters negated this induction. These findings indicate that miR-34a and miR-34b/c are direct transcriptional targets of p53.
Two major endpoints of p53 activation are apoptosis and growth arrest (either cell cycle arrest or senescence). The ectopic expression of either mir-34a or mir-34b/c in IMR90 cells led to substantial inhibition of growth (Fig. 3a). This was attributable to effects on cell proliferation: the fraction of S-phase cells decreased, and the fraction of cells in G1 and G2 increased (Fig. 3b). We also noted distinctive morphological alterations characteristic of cellular senescence (Fig. 3c), and about 60% of infected cells stained positively for a senescence marker, SA-β-Gal, at 6 days after selection (Fig. 3d). Importantly, all of these effects were seen with mir-34 expression levels similar to those achieved after p53-mediated induction (Supplementary Fig. S5). Transfection of miR-34 miRNAs, but not that of miR-34s containing seed mutations, also led to G1 arrest in immortalized mouse cells and in human tumour cell lines including NIH-3T3, HCT-116, A549 and TOV21G (Supplementary Fig. S6, data not shown). These studies indicate that arrest can be induced independently of the integrity of major tumour suppressor pathways, at least in some cell lines (Fig. 3, and data not shown). Ectopic delivery of miR-34a also sensitized MEFs to apoptosis in response to genotoxic stress, although the effects were not as pronounced as the growth arrest induced by this miRNA (data not shown).
Figure 3. miR-34 family miRNAs mediate growth arrest in a variety of cell types.
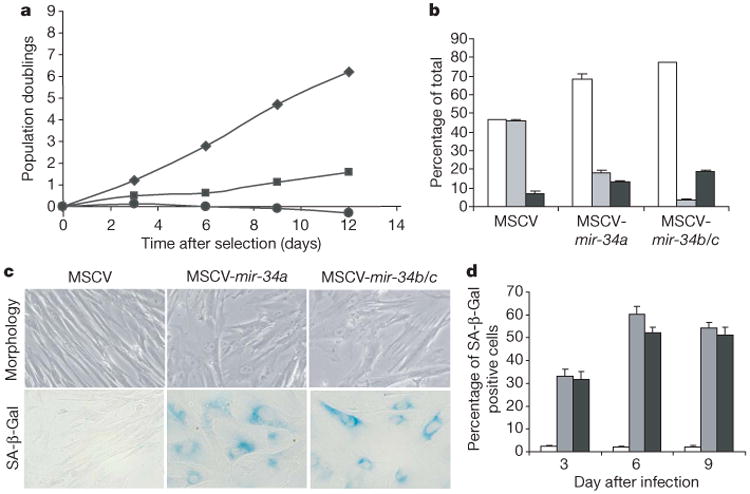
a, Proliferation of IMR90 cells was measured as cumulative population doublings after retroviral delivery of vectors directing the expression of primary miR-34a (squares), miR-34b/c (circles) or a control MSCV vector (diamonds). Measurements were initiated immediately after selection with puromycin. b, Cell cycle analysis was performed 1 day after selection with puromycin by BrdU/FACS on IMR90 cells engineered as in a. White columns, G1; grey columns, S; black columns, G2/M. c, IMR90 cells engineered to express pri-miR-34a or pri-miR-34b/c showed morphological alterations similar to those seen in senescent cells. d, Percentages of SA-β-Gal-positive cells were determined at 3, 6 and 9 days after the completion of selection with puromycin. White columns, MSCV; grey columns, MSCV-mir-34a; black columns, MSCV-mir-34b/c. In all cases, error bars indicate s.e.m. (n = 3).
miRNAs often decrease the mRNA levels of direct regulatory targets15. After transfection of miR-34a, b or c into a panel of four tumour cell lines, a cluster of genes was specifically downregulated at 24h after transfection (Supplementary Fig. S7 and Supplementary Table S2), with some genes showing significant repression as early as 10 h after transfection. These genes were highly enriched for transcripts with 3′ untranslated regions (UTRs) containing complements to miR-34 seed hexamers. On the basis of functional annotation, genes involved in control of the cell cycle were strongly overrepresented among this set (P < 3.4 × 10⁻²⁰; Supplementary Fig. S7). A selection of candidate targets, including cyclin E2 (CCNE2), cyclin-dependent kinase 4 (CDK4) and the hepatocyte growth factor receptor (MET)16, were validated by western blotting (Fig. 4a, and Supplementary Fig. S8). On transfection of miR-34a into A549 and HCT116 cells, we observed the expected twofold to fourfold decrease in each target examined15. To test whether regulation was direct, we fused the 3′ UTRs of these selected targets to luciferase. Co-transfection with miR-34a but not miR-124a specifically decreased luciferase levels from each reporter (Fig. 4b). Mutations in seed complementary sites fully rescued repression for both CDK4 and MET. For cyclin E2, mutation of the single best seed complementary site had only a partial effect (Fig. 4b), indicating either the presence of other relevant seed complements or a combination of both direct and indirect effects of miR-34. Silencing of these selected miR-34 targets by using siRNAs led to a substantial arrest in G1 (Fig. 4c), partly phenocopying activation of their upstream regulator. Ectopic miR-34 delivery caused a decrease in levels of phosphorylated retinoblastoma gene product (Rb), consistent with lowered activity of both CDK4 and CCNE2 complexes (Fig. 4a). Repression of CDK4 and CCNE2 has previously been noted after p53 activation in PC3 cells7. Our results indicate the possibility that p53 might repress these genes indirectly by the induction of miR-34.
Figure 4. miR-34 regulates a programme of cell cycle and DNA damage response genes.

a, Western blots were used to measure protein levels after miR-34 delivery for multiple candidate targets identified in the cell cycle overlapping gene set in Supplementary Fig. S6. Tub., tubulin. b, Reporter plasmids in which the luciferase coding sequence had been fused to the 3′ UTR of CDK4, CCNE2 or MET, as indicated, were transfected into HeLa cells in conjunction with either miR-34a (grey columns) or miR-124a (white columns) siRNAs. Luciferase activity was normalized relative to a simultaneously transfected Renilla expression plasmid. In each case 3′-UTR-Mut indicates the introduction of alterations into the seed complementary sites shown in Supplementary Fig. S8. Error bars indicate s.e.m. (n = 3). c, HCT116 Dicerex5 cells were transfected with siRNAs targeting CDK4, CCNE2 and MET, and cell cycle effects were analysed as described in Supplementary Fig. S6. The somewhat less efficacious arrest on transfection with CCNE2 siRNA could reflect a partly redundant function or less potent suppression of its mRNA.
We also noted a significant overlap between miR-34-regulated genes and those whose expression is altered after DNA damage (Supplementary Fig. S7). This was seen both for genes that increased after either miR-34 delivery or DNA damage (P < 7 × 10−65) and for those that decreased in response to either treatment (P < 1.8 × 10−73). Although strong seed enrichment was seen in the mutually downregulated set, seed enrichment was not seen in the mutually upregulated set, indicating that such increases in expression might be secondary effects of miR-34.
Activation of p53 leads to the coordinated induction of multiple downstream effectors, many of which act in a partly or fully redundant manner. A classic example is p53-dependent apoptosis, which depends not only on the induction of bax17 but also on puma and noxa18. For p53-mediated growth arrest, induction of the CDK inhibitor p21 is clearly important. However, p21 loss does not completely negate the ability of p53 to halt proliferation19,20. This demonstrates the existence of redundant or cooperating pathways that contribute to p53-mediated arrest in G1. Recent studies have identified several p53 targets, including Gadd45a (for growth arrest and DNA-damage-inducible), 14-3-3 and Reprimo, which have been proposed to collaborate with p21, primarily to trigger arrest in G2 in specific cell types3. At least in some contexts, miR-34s can exert their growth inhibitory effects in the absence of p21, because HCT-116 cells lacking p21 are susceptible to miR-34 (Supplementary Fig. S6B). This is especially important because reports have implicated p21 in p53-mediated repression21.
Our data identify the miR-34 family of miRNAs as direct targets of p53 that possess anti-proliferative potential. It is likely that miR-34s mediate this response through additive or synergistic effects of multiple targets, because many components of the cell cycle machinery are affected after the manipulation of miR-34 levels. The effects of miR-34s may also extend to the other arm of the p53 response, given a recent report and our findings (data not shown) that miR-34a can enhance apoptotic responses in some cell types22. Thus, the actual phenotypic output of miR-34 activation may vary by cell type depending on the spectrum of its targets that are available for repression.
In accord with their regulation by p53, comparatively low levels of miR-34s are observed in human tumours and cancer cell lines, which have a high frequency of functional p53 deficiency. Although selective pressures for miR-34 deletion in human cancers may be alleviated by frequent p53 mutations, deletion of miRNAs of the miR-34 family has been reported in several human tumours and cancer cell lines22,23. In fact, the human gene encoding miR-34a maps to 1p36, a locus frequently deleted in human cancers. Recently, one gene within this locus, CHD5, has been implicated in its tumour suppressive activity24. CHD5 has been proposed to act upstream of p53 by regulating its expression in response to various p53-inducing stimuli. Deletions at 1p36 are often quite large and can encompass both CHD5 and the mir-34a locus, as well as other genes. Thus, 1p36 genomic lesions might affect the p53 pathway at multiple levels, both upstream and downstream of p53 activation.
Although dozens of p53 targets have been identified in mammals, very few are evolutionarily conserved in Drosophila and Caenorhabditis elegans, both of which retain homologues of the p53 pathway25. miR-34 is one of only 18 mammalian miRNA families26 that are also present in flies and worms. This raises the possibility that the link between p53 and this non-coding RNA target may have arisen early in the evolution of the p53 network and may be important in p53 function in diverse species.
Methods
Quantification of miRNAs with real-time PCR
TaqMan MicroRNA assays were used to quantify the level of mature miRNAs as described previously9,27. In miRNA profiling experiments, each reverse transcriptase (RT) reaction contained 3.75 ng of purified total RNA, 50 nM stem–loop RT primer, 1 × RT buffer, dNTPs (each at 0.25 mM), 3.33 U μl−1 MultiScribe reverse transcriptase and 0.25 U μl−1 RNase inhibitor (Applied Biosystems). The reactions were incubated for 30min at 16 °C, 30 min at 42 °C, and 5 min at 85°C. Real-time PCR reactions for each miRNA (10 μl volume) were performed in quadruplicate, and each 10-μl reaction mixture included 2 μl of diluted RT product (1:2 dilution), 5 μl of 2 × TaqMan Universal PCR Master Mix, 0.2 μM TaqMan probe, 1.5 μM forward primer, and 0.7 μM reverse primer, respectively (Applied Biosystems). Reactions were incubated in an Applied Biosystems 7900HT Fast Real-Time PCR system in 384-well plates at 95 °C for 10 min, followed by 40 cycles at 95 °C for 15 s and 60 °C for 1 min. The threshold cycle (Ct) is defined as the fractional cycle number at which the fluorescence exceeds the fixed threshold of 0.2. Primary transcripts level of mir-34a and mir-34b/c were determined with the SuperScript III SYBR Green One-Step qRT–PCR system (Invitrogen). Primers that amplify the mir-34a pri-miRNA, mir-34b/c pri-miRNA and the control β-actin mRNA were designed with Primer Express software, v. 2: hsa-pri-mir-34a forward primer, 5′-CCTCCAAGCCAGCTCAGTTG-3′; hsa-pri-mir-34a reverse primer, 5′-TGACTTTGGTCCAATTCCTGTTG-3′; hsa-pri-mir-34b/c forward primer, 5′-GCTCTTTGTCCCTCCTGCTAGA-3′; hsa-pri-mir-34b/c reverse primer, 5′-GTGGGCGGTCCCTGAAG-3′; mmu-pri-mir-34a forward primer, 5′-CTGTGCCCTCTTGCAAAAGG-3′; mmu-pri-mir-34a reverse primer, 5′-GGACATTCAGGTGAGGGTCTTG-3′; mmu-pri-mir-34b/c forward primer, 5′-GGCAGGAAGGCTCCAGATG-3′; mmu-pri-mir-34b/c reverse primer, 5′-CCTCACTGTTCATATGCCCATTC-3′. The ratios of RNA species in each sample were determined in triplicate with the use of an ABI 7900HT TaqMan sequence detector following the standard curve method.
Hierarchical clustering for miRNA expression profiling
Expression of 145 mouse miRNAs was characterized and the data were subjected to a series of adjustment and filtering before hierarchical clustering. Assays with Ct values greater than 35 were treated as 35, and low-expressing miRNAs were then removed from the analysis if their average Ct values across the samples were between 34 and 35. Four miRNAs (miR-30d, miR-148b, miR-320 and let-7d) that were least variable among the 16 samples used in this study were selected as internal references, and ΔCt between the Ct of each miRNA and the average of these four references for each sample were calculated. Data from each of the resulting 115 miRNAs were median-centred, and both miRNAs and samples were clustered by using the average linkage method under the correlation similarity metric.
Chromatin immunoprecipitation
Wild-type MEF and p53−/− MEF cultures were grown to 70–80% confluence and then treated with doxorubicin (0.5 μg ml−1) for 24 h. After being washed with PBS, cells were crosslinked with 1% formaldehyde for 15 min at room temperature. Crosslinking was stopped by the addition of glycine to 125 mM final concentration. Cells were washed twice with cold PBS and then harvested in lysis buffer first (20 mM Tris-HCl pH 8.0, 85 mM KCl, 1 mM EDTA, 0.5 mM EGTA, 0.5% Nonidet P40, and protease inhibitors), and the pellets were then dissolved in nuclear lysis buffer (50 mM Tris-HCl pH 8.0, 10 mM EDTA, 1% SDS, and protease inhibitors). Samples were sonicated to generate DNA fragments less than 500 base pairs in length. Before immunoprecipitation, nuclear extracts were precleared at 4°C with 50 μl of 50 % Protein A–Sepharose slurry for 30 min. p53 antibody (CM5; Novocastra) was then added to form complexes with p53 protein and associated chromatin. These immunocomplexes were recovered with Protein A–Sepharose beads (Upstate), and the associated DNA was purified by extraction with phenol/chloroform. The enrichment across the putative p53 binding sites at both miR-34a and miR-34b/c were then tested by real-time PCR analysis. Primers 5′-CAGCCTGGAGGAGGATCGA-3′ and 5′-TCCCAAAGCCCCCAATCT-3′ were used to amplify the mir-34a promoter regions containing the putative p53 binding sites; primers 5′-GTTGATCCTGCCCACAGTTACTAGA-3′ and 5′-ATTAAAACATGAGTCTCCCTGGTCTCT-3′ were used to amplify the mir-34b/c promoter regions containing the putative p53 binding sites. Two sets of primers designed to amplify the 3′ end of the gene encoding the miR-34a precursor and the gene encoding the miR-34b/c precursor, respectively, were used as controls.
Proliferation and cell cycle analysis
Primary IMR90 cells and MEFs were infected with MSCV retroviral vectors directing the expression of mir-34a or mir-34b/c from the long terminal repeat promoter. Infected cells were selected by puromycin for 2 days, left to recover for 12 h and then used for a variety of growth assays. Growth curves were measured by determining accumulative population doublings over a course of 12 days after puromycin selection. At day 1 after selection, IMR90 cells were labelled with BrdU for 6 h, and G1, S and G2/M populations were measured by the BrdU APC flow kit (BD Biosciences). SA-β-Gal staining was conducted for IMR90 cells at 3, 6 and 9 days after selection with puromycin. Cells were fixed with 0.5% glutaraldehyde in PBS for 15 min at room temperature. After being washed with PBS/MgCl2 (1 mM MgCl2, pH 6.0), cells were stained in X-Gal (1 mg ml−1 X-Gal, 0.1 M K3Fe(CN)6, 0.1 M K3Fe(CN)63H2O, 1 mM MgCl2, in PBS, pH 6.0). Tumour-derived cell lines including A549, HCT116 and HCT116 p21−/− cells were transfected with luciferase siRNA GL-3 or miR-34a–c siRNA duplexes (100 nM). At 24 h after transfection, the cells were treated with nocodazole (100 ng ml−1) for 16–20 h. Cell cycle distributions were measured by staining with propidium iodide, followed by FACS.
Microarray profiling
Cells were plated 24 h before transfection. HCT116 DicerEx5 cells were transfected in six-well plates with duplexed RNAs with the use of Lipofectamine 2000 (Invitrogen). DLD-1, HeLa, TOV21G and A549 cells were transfected by using SilentFect (Bio-Rad). Duplexes were used at final concentrations of 100 nM for all cell lines. RNA was isolated 6–24 h after transfection, and microarray analysis was performed as described28.
Gene set analysis methods
miRNA-regulated transcripts were identified in microarray gene expression signatures using a P-value cut-off (P < .01). miRNA downregulated transcripts were defined by the intersection of downregulated transcripts in all the lines tested. Downregulated transcripts were tested for enrichment relative to a background set with the use of the hypergeometric distribution. miRNA target regulation was measured by enrichment of transcripts containing miRNA hexamer seed strings (stretches of six contiguous bases complementary to miRNA seed region nucleotides 1–6, 2–7 or 3–8) in transcripts having annotated 3′ UTRs. Biological function was categorized by enrichment of transcripts from Gene Ontology Biological Process functional categories (http://www.geneontology.org/). The set of genes on the microarray was used as a background set.
Cell lines
Wild-type MEFs and p53−/− MEFs were isolated from embryonic day (E)13.5 embryos. HCT116, HCT116 p53−/−, HCT116 Dicerex5, HCT116 p21−/− and DLD-1 Dicerex5 cells were provided by B. Volgelstein's group. HEPG2, A549, 3T3 and TOV21G calls were acquired from ATCC. HEPG2, A549 and TOV21G cells were engineered to contain an empty vector or a vector expressing a hairpin targeting human p53. For these cells, the p53 shRNA was a 19-mer stem–loop cloned under the control of a human H1 promoter29 and shuttled into the pLenti6 Block-It vector (Invitrogen). The engineered lines were generated by stable transduction with packaged lentiviral particles. The knockdown level of p53 was about 95%.
Western analysis
Antibodies against CDK4 (c-22; dilution 1:1,000; Santa Cruz), CCNE2 (dilution 1:1,000; Cell Signaling), MET (25H2; dilution 1:1,000; Cell Signaling) and phospho-Rb (dilution 1:2000; Santa Cruz) were used in western analysis in accordance with the manufacturer's instruction. Tubulin (Sigma) was blotted for a loading control, as well as for subsequent quantification.
miR-34-mediated suppression reporter assays
The 3′ UTRs from human CDK4, CCNE2 and MET were amplified from human genomic DNA (Promega) and individually cloned into pEntr/D (Invitrogen) by directional TOPO cloning. Seed regions were mutated to remove all complementarity to nucleotides 1–7 of miR-34s by using the QuickchangeXL Mutagenesis Kit (Stratagene). Both wild-type and mutant 3′ UTRs were transferred into pGL3-TK (Promega) with the use of Gateway cloning (Invitrogen). HeLa cells were co-transfected with reporter constructs and miRNAs (miR-34a or miR-124a) in the form of siRNAs using LT1 and TKO (Mirus). pRLTK (Promega) was also transfected as a normalization control. Cells were lysed 24 h after transfection, and ratios between firefly luciferase and Renilla luciferase activity were measured with a dual luciferase assay (Promega).
Promoter reporter assays
The putative promoter regions of human mir-34a and mir-34b/c were amplified from genomic DNA and cloned into pGL4 vector (Promega). Mutagenesis of p53 binding sites was performed with the QuickchangeXL mutagenesis kit (Strategene). HCT116 p53−/− cells were transfected with the heterologous reporter vectors and pRL-TK along with either the pLPC-p53 vector or pLPC control vector. Ratios of firefly luciferase to Renilla luciferase activity were determined with a dual luciferase assay (Promega) 24 h after transfection.
Supplementary Material
Acknowledgments
We thank members of the Hannon and Lowe laboratories and the Rosetta Biology group for helpful input; M. Zhang and J. Burchard for bioinformatic analysis; J. Guo, C. Raymond and K. Niemeyer for miRNA quantification; J. Schelter and M. Kibukawa for cell cycle analyses and gene expression profiling; R. Diaz, M. Mehaffey, F. Huynh and the Rosetta Gene Expression Laboratory for technical assistance; and R. Dickins, J. Kurland, M. McCurrach, K. Diggins, A. Chicas, B. Stillman and B. Vogelstein for providing reagents and protocols. L.H. is a Fellow of the Helen Hay Whitney Foundation and is supported by a K99 grant from the NCI. S.W.L. and G.J.H. are supported by a program project grant from the NCI and are investigators of the Howard Hughes Medical Institute. This work was also supported in part by a gift from K. W. Davis.
Footnotes
Supplementary Information is linked to the online version of the paper at www.nature.com/nature.
The authors declare no competing financial interests.
References
- 1.Lu J, et al. MicroRNA expression profiles classify human cancers. Nature. 2005;435:834–838. doi: 10.1038/nature03702. [DOI] [PubMed] [Google Scholar]
- 2.Thomson JM, et al. Extensive post-transcriptional regulation of microRNAs and its implications for cancer. Genes Dev. 2006;20:2202–2207. doi: 10.1101/gad.1444406. [DOI] [PMC free article] [PubMed] [Google Scholar]
- 3.Levine AJ, Hu W, Feng Z. The p53 pathway: what questions remain to be explored? Cell Death Differ. 2006;13:1027–1036. doi: 10.1038/sj.cdd.4401910. [DOI] [PubMed] [Google Scholar]
- 4.Ko LJ, Prives C. p53: puzzle and paradigm. Genes Dev. 1996;10:1054–1072. doi: 10.1101/gad.10.9.1054. [DOI] [PubMed] [Google Scholar]
- 5.Hollstein M, Sidransky D, Vogelstein B, Harris CC. p53 mutations in human cancers. Science. 1991;253:49–53. doi: 10.1126/science.1905840. [DOI] [PubMed] [Google Scholar]
- 6.Dickins RA, et al. Probing tumor phenotypes using stable and regulated synthetic microRNA precursors. Nature Genet. 2005;37:1289–1295. doi: 10.1038/ng1651. [DOI] [PubMed] [Google Scholar]
- 7.Spurgers KB, et al. Identification of cell cycle regulatory genes as principal targets of p53-mediated transcriptional repression. J Biol Chem. 2006;281:25134–25142. doi: 10.1074/jbc.M513901200. [DOI] [PubMed] [Google Scholar]
- 8.Bartel DP. MicroRNAs: genomics, biogenesis, mechanism, and function. Cell. 2004;116:281–297. doi: 10.1016/s0092-8674(04)00045-5. [DOI] [PubMed] [Google Scholar]
- 9.Chen C, et al. Real-time quantification of microRNAs by stem-loop RT-PCR. Nucleic Acids Res. 2005;33:e179. doi: 10.1093/nar/gni178. [DOI] [PMC free article] [PubMed] [Google Scholar]
- 10.Fei P, El-Deiry WS. P53 and radiation responses. Oncogene. 2003;22:5774–5783. doi: 10.1038/sj.onc.1206677. [DOI] [PubMed] [Google Scholar]
- 11.Giaccia AJ, Kastan MB. The complexity of p53 modulation: emerging patterns from divergent signals. Genes Dev. 1998;12:2973–2983. doi: 10.1101/gad.12.19.2973. [DOI] [PubMed] [Google Scholar]
- 12.Sherr CJ, Weber JD. The ARF/p53 pathway. Curr Opin Genet Dev. 2000;10:94–99. doi: 10.1016/s0959-437x(99)00038-6. [DOI] [PubMed] [Google Scholar]
- 13.Xue W, et al. Senescence and tumour clearance is triggered by p53 restoration in murine liver carcinomas. Nature. 2007;445:656–660. doi: 10.1038/nature05529. [DOI] [PMC free article] [PubMed] [Google Scholar]
- 14.Wei CL, et al. A global map of p53 transcription-factor binding sites in the human genome. Cell. 2006;124:207–219. doi: 10.1016/j.cell.2005.10.043. [DOI] [PubMed] [Google Scholar]
- 15.Lim LP, et al. Microarray analysis shows that some microRNAs downregulate large numbers of target mRNAs. Nature. 2005;433:769–773. doi: 10.1038/nature03315. [DOI] [PubMed] [Google Scholar]
- 16.Lewis BP, Burge CB, Bartel DP. Conserved seed pairing, often flanked by adenosines, indicates that thousands of human genes are microRNA targets. Cell. 2005;120:15–20. doi: 10.1016/j.cell.2004.12.035. [DOI] [PubMed] [Google Scholar]
- 17.Miyashita T, Reed JC. Tumor suppressor p53 is a direct transcriptional activator of the human bax gene. Cell. 1995;80:293–299. doi: 10.1016/0092-8674(95)90412-3. [DOI] [PubMed] [Google Scholar]
- 18.Villunger A, et al. p53- and drug-induced apoptotic responses mediated by BH3-only proteins puma and noxa. Science. 2003;302:1036–1038. doi: 10.1126/science.1090072. [DOI] [PubMed] [Google Scholar]
- 19.Brugarolas J, et al. Radiation-induced cell cycle arrest compromised by p21 deficiency. Nature. 1995;377:552–557. doi: 10.1038/377552a0. [DOI] [PubMed] [Google Scholar]
- 20.Deng C, Zhang P, Harper JW, Elledge SJ, Leder P. Mice lacking p21CIP1/WAF1 undergo normal development, but are defective in G1 checkpoint control. Cell. 1995;82:675–684. doi: 10.1016/0092-8674(95)90039-x. [DOI] [PubMed] [Google Scholar]
- 21.Lohr K, Moritz C, Contente A, Dobbelstein M. p21/CDKN1A mediates negative regulation of transcription by p53. J Biol Chem. 2003;278:32507–32516. doi: 10.1074/jbc.M212517200. [DOI] [PubMed] [Google Scholar]
- 22.Welch C, Chen Y, Stallings RL. MicroRNA-34a functions as a potential tumor suppressor by inducing apoptosis in neuroblastoma cells. Oncogene. 2007 Feb 12; doi: 10.1038/sj.onc.1210293. advance online publication. [DOI] [PubMed] [Google Scholar]
- 23.Calin GA, et al. MicroRNA profiling reveals distinct signatures in B cell chronic lymphocytic leukemias. Proc Natl Acad Sci USA. 2004;101:11755–11760. doi: 10.1073/pnas.0404432101. [DOI] [PMC free article] [PubMed] [Google Scholar]
- 24.Bagchi A, et al. CHD5 is a tumor suppressor at human 1p36. Cell. 2007;128:459–475. doi: 10.1016/j.cell.2006.11.052. [DOI] [PubMed] [Google Scholar]
- 25.Sutcliffe JE, Brehm A. Of flies and men; p53, a tumour suppressor. FEBS Lett. 2004;567:86–91. doi: 10.1016/j.febslet.2004.03.122. [DOI] [PubMed] [Google Scholar]
- 26.Ruby JG, et al. Large-scale sequencing reveals 21U-RNAs and additional microRNAs and endogenous siRNAs in C. elegans. Cell. 2006;127:1193–1207. doi: 10.1016/j.cell.2006.10.040. [DOI] [PubMed] [Google Scholar]
- 27.Raymond CK, Roberts BS, Garrett-Engele P, Lim LP, Johnson JM. Simple, quantitative primer-extension PCR assay for direct monitoring of microRNAs and short-interfering RNAs. RNA. 2005;11:1737–1744. doi: 10.1261/rna.2148705. [DOI] [PMC free article] [PubMed] [Google Scholar]
- 28.Jackson AL, et al. Expression profiling reveals off-target gene regulation by RNAi. Nature Biotechnol. 2003;21:635–637. doi: 10.1038/nbt831. [DOI] [PubMed] [Google Scholar]
- 29.Brummelkamp TR, Bernards R, Agami R. A system for stable expression of short interfering RNAs in mammalian cells. Science. 2002;296:550–553. doi: 10.1126/science.1068999. [DOI] [PubMed] [Google Scholar]
Associated Data
This section collects any data citations, data availability statements, or supplementary materials included in this article.