

Abstract
Deciphering the ways in which somatic mutations and germline susceptibility variants cooperate to promote cancer is challenging. Ewing sarcoma is characterized by fusions between EWSR1 and members of the ETS gene family, usually EWSR1-FLI1, leading to the generation of oncogenic transcription factors that bind DNA at GGAA motifs1–3. A recent genome-wide association study4 identified susceptibility variants near EGR2. Here we found that EGR2 knockdown inhibited proliferation, clonogenicity and spheroidal growth in vitro and induced regression of Ewing sarcoma xenografts. Targeted germline deep sequencing of the EGR2 locus in affected subjects and controls revealed 291 Ewing-associated SNPs. At rs79965208, the A risk allele connected adjacent GGAA repeats by converting an interspaced GGAT motif into a GGAA motif, thereby increasing the number of consecutive GGAA motifs and thus the EWSR1-FLI1–dependent enhancer activity of this sequence, with epigenetic characteristics of an active regulatory element. EWSR1-FLI1 preferentially bound to the A risk allele, which increased global and allele-specific EGR2 expression. Collectively, our findings establish cooperation between a dominant oncogene and a susceptibility variant that regulates a major driver of Ewing sarcomagenesis.
Keywords: EWSR1-FLI1, Ewing sarcoma, germline susceptibility, GGAA microsatellite, EGR2
Ewing sarcoma is an aggressive pediatric malignancy that likely arises from neural crest- or mesoderm-derived mesenchymal stem cells (MSCs)5,6. It is driven by oncogenic fusions between EWSR1 and genes in the ETS family (mostly FLI1)1,7. EWSR1-FLI1 binds DNA either at ETS-like consensus sites containing a GGAA core motif or, more specifically with respect to other ETS family members, at GGAA microsatellites, where the enhancer activity increases with the number of consecutive GGAA motifs2,3. Notably, ~40% of EWSR1-FLI1 binding occupancy maps to GGAA microsatellites8. Aside from EWSR1-FLI1, Ewing sarcoma is known for its paucity of recurrent somatic abnormalities9–11.
Epidemiological studies have documented striking disparities in the incidence of Ewing sarcoma across human populations12, implying a strong contribution of germline variation to Ewing sarcoma tumorigenesis. Our recent genome-wide association study (GWAS) identified three significant susceptibility loci with higher odds ratios (ORs) than commonly observed in adult cancers (OR > 1.5, compared with OR < 1.3 for adult cancers)4,13. However, the potential oncogenic cooperation between the major EWSR1-FLI1 somatic alteration and these Ewing sarcoma susceptibility loci remains to be elucidated. Here we focused on the chr10q21.3 susceptibility locus, which harbors two plausible candidate genes, ADO (2-aminoethanethiol dioxygenase), encoding a non-heme iron enzyme that converts cysteamine into taurine14, and EGR2 (early growth response 2; also known as KROX20), encoding a conserved zinc-finger transcription factor that promotes proliferation, differentiation and/or survival in different cell types, including neural crest–derived Schwann cells and mesoderm-derived osteoprogenitors15,16. Previous data showed that ADO and EGR2 are overexpressed in Ewing sarcoma compared with other solid tumors and that their elevated expression is associated with risk alleles4. EGR2 and, to a lesser extent, ADO are also strongly overexpressed in Ewing sarcoma relative to their expression in normal tissues (Fig. 1a and Supplementary Fig. 1). Comparative analysis of microarray data from seven pediatric soft tissue and brain tumor types showed that EGR2, but not ADO, clusters with established EWSR1-FLI1 target genes17 (Fig. 1b). To further explore the expression quantitative trait locus (eQTL) properties of the Ewing sarcoma chr10 susceptibility locus, we evaluated available genotype and matched expression data sets from Ewing sarcoma and other small-round-cell tumors, as well as from normal tissues4,18–23. Interestingly, the Ewing sarcoma risk-associated rs1848797, which was genotyped in all data sets, was associated with higher EGR2 and ADO expression only in Ewing sarcoma, and not in EWSR1-FLI1–negative tissues (Table 1, Supplementary Data and Supplementary Fig. 2). Moreover, ectopic EWSR1-FLI1 expression in human MSCs specifically induced EGR2 expression (Fig. 1c), whereas EWSR1-FLI1 knockdown by specific small interfering RNA (siRNA) consistently reduced EGR2 expression in four different Ewing sarcoma cell lines (Supplementary Fig. 3). Such regulation by EWSR1-FLI1 was not observed for ADO. These data strongly suggest that EGR2 and ADO are specifically regulated by eQTLs in Ewing sarcoma, but that only EGR2 is EWSR1-FLI1 dependent.
Figure 1. EGR2 overexpression is mediated by EWSR1-FLI1.
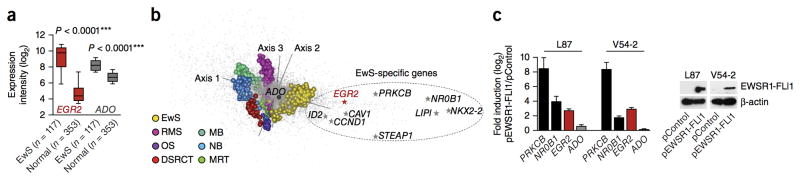
(a) EGR2 and ADO expression levels in Ewing sarcoma (EwS, GSE34620) and normal tissues (GSE3526). The normal-body atlas consists of 353 microarrays representing 63 individual tissue types (Supplementary Fig. 1). Data are shown as medians (horizontal bars) with ranges for the 25th–75th percentile (box) and 10th–90th percentile (whiskers). P values determined via two-tailed unpaired Student’s t-test with Welch’s correction. (b) Between-group analysis. Genes (gray dots) and tumor samples (colored spheres) are separated along three axes. EwS, Ewing sarcoma (n = 279); RMS, rhabdomyosarcoma (n = 121); OS, osteosarcoma (n = 25); DSRCT, desmoplastic small-round-cell tumor (n = 32); MB, medulloblastoma (n = 52); NB, neuroblastoma (n = 64); MRT, malignant rhabdoid tumor (n = 35). The main genes specifically overexpressed in Ewing sarcoma are indicated.
(c) Quantitative real-time PCR analysis of EGR2 and ADO expression in human MSC lines L87 and V54-2 after ectopic EWSR1-FLI1 expression (pEWSR1-FLI1) as compared with empty vector (pControl). Data are shown as the mean and s.e.m.; n ≥ 9 independent experiments. The EWSR1-FLI1-targets NR0B1 and PRKCB served as positive controls17,35. EWSR1-FLI1 expression was confirmed by immunoblot (loading control: β-actin).
Table 1. Overexpression of EGR2 and ADO is mediated by Ewing sarcoma-specific eQTLs.
eQTL analyses across tissue types identified Ewing sarcoma-specific correlations of EGR2 and ADO expression with the risk allele at rs1848797. The Broad GTEx database comprised 13 normal tissue types (≥ 60 samples per tissue type).
| P value correlation with rs1848797 | ||||
|---|---|---|---|---|
| Tissue type | n | EGR2 | ADO | |
| Malignant | Ewing sarcoma | 117 | 0.0077 | 0.0023 |
| Medulloblastoma | 283 | ns | ns | |
| Neuroblastoma | 74 | ns | ns | |
| AML | 106 | ns | ns | |
| Normal | LCL | 329 | ns | ns |
| Airway epithelium | 114 | ns | ns | |
| Broad GTEx | 1,421 | ns | ns | |
ns, not significant; AML, acute myeloid leukemia; LCL, lymphoblastoid cell lines.
Knockdown experiments showed that inhibition of EGR2, but not of ADO, impaired proliferation and clonogenicity of four different Ewing sarcoma cell lines, reduced cell cycle progression through S-phase and reduced cell viability (Fig. 2a, b and Supplementary Fig. 4). To confirm the contribution of EGR2 to Ewing sarcoma growth, we generated Ewing sarcoma cell lines with a doxycycline-inducible anti-EGR2 small-hairpin RNA (shRNA) expression system. Long-term EGR2 knockdown not only dramatically reduced anchorage-independent spheroidal growth in vitro but, even more strikingly, also induced regression of Ewing sarcoma xenografts in vivo (Fig. 2c, d). Consistent with the hypothesis that EGR2 acts downstream of EWSR1-FLI1, transcriptome profiling of Ewing sarcoma cells after knockdown of either gene showed highly significantly overlapping transcriptional signatures (Fig. 2e and Supplementary Data). Collectively, these data suggest that EGR2 is an EWSR1-FLI1–induced target gene critical for Ewing sarcoma tumorigenicity.
Figure 2. EGR2 is critical for the growth and tumorigenicity of Ewing sarcoma.
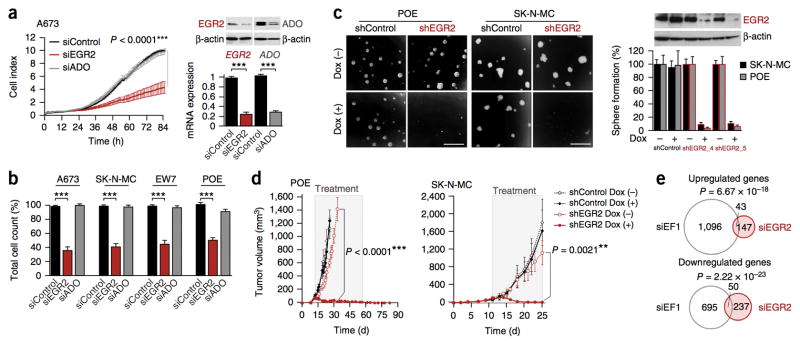
(a) xCELLigence proliferation kinetics of A673 cells. Data shown are the mean ± s.e.m. of results obtained with two different siRNAs against EGR2 and three different siRNAs against ADO; n ≥ 6 technical replicates. EGR2 or ADO knockdown was confirmed at 48 h by quantitative real-time PCR (mean ± s.e.m., n ≥ 4 independent experiments) and immunoblot (loading control: β-actin). (b) Validation of xCELLigence results by cell counting (including supernatant) 96 h after transfection of A673, SK-N-MC, EW7 and POE cells. Data are mean and s.e.m. of results obtained with two different siRNAs against EGR2 and three different siRNAs against ADO; n ≥ 3 independent experiments. (c) Left, phase-contrast images of sphere-formation assays (scale bars, 1 mm). Right, mean and s.e.m. of n ≥ 3 independent experiments performed with SK-N-MC and POE containing a doxycycline-inducible shRNA against EGR2 (shEGR2_4 or shEGR2_5). Also shown is a representative EGR2 immunoblot for POE cells (96-h doxycycline treatment; loading control, β-actin). (d) Growth curves for subcutaneously xenografted POE or SK-N-MC cells (shControl and shEGR2_4). When tumors reached a volume of 75–100 mm3, doxycycline and sucrose (Dox +) or sucrose alone (Dox −) was added to the drinking water (treatment). Mean ± s.e.m.; n ≥ 6 mice per group. P values determined via two-tailed unpaired Student’s t-test. (e) Size-proportional Venn diagrams of up- and downregulated genes 48 h after knockdown of EWSR1-FLI1 (siEF1) or EGR2 (siEGR2) in A673 and SK-N-MC cells (minimum log2 fold change ± 0.5, Benjamini-Hochberg–corrected P < 0.05). Fisher’s exact test.
As several reports have shown that EGR2 acts downstream of the epidermal growth factor (EGF) and fibroblast growth factor (FGF) pathway15,24,25, we explored a potential contribution of these pathways to Ewing sarcoma growth and EGR2 regulation. Whereas EGF receptors (EGFRs) are minimally expressed in Ewing sarcoma, some FGF receptors (FGFRs), particularly FGFR1, are highly expressed (Supplementary Fig. 5a). Consistently, bFGF, but not EGF, strongly induced both proliferation of and EGR2 expression in Ewing sarcoma cells (Supplementary Fig. 5b, c). These data indicate that EWSR1-FLI1 and FGF signaling converge to upregulate the expression of EGR2.
To fine-map the chr10 susceptibility locus and to identify variants that potentially contribute to EGR2 overexpression, we performed targeted deep sequencing across the chr10 susceptibility locus, including the flanking haplotype blocks, in the germline DNA of 343 individuals with Ewing sarcoma cases and 251 genetically matched controls (median target-region coverage ≥10X, 91.35%; median nucleotide coverage, 217X). Genetic matching was based on principal-component analysis4 of SNP array data (Supplementary Fig. 6). After quality control metrics had been applied to the sequencing data (for example, ≥10X coverage per position, genotype call rate ≥90% and compliance with Hardy-Weinberg equilibrium), 290 common SNPs (minor allele frequency > 0.05) were identified that were significantly associated with Ewing sarcoma (P < 0.05; Fig. 3a, Supplementary Data and Supplementary Fig. 7). These included all 14 sentinel SNPs reported in our previous GWAS4. Haplotype and linkage disequilibrium (LD) analysis showed that this locus consists of discrete subhaploblocks (Fig. 3a and Supplementary Data).
Figure 3. Fine-mapping and epigenetic profiling revealed candidate EGR2 regulatory elements.

(a) Top, Manhattan plot of 1,440 SNPs identified by targeted deep sequencing within the chr10 susceptibility locus and flanking haplotype blocks. rs10995305 was the most significant SNP associated with Ewing sarcoma at this locus (false discovery rate (FDR)-corrected P = 1.27 × 10⁻⁴). The blue lines indicate the recombination-rate estimates from the HapMap project36. Middle, LD plot of the chr10 susceptibility locus hotspot (chr10:64,449,549–64,756,872) based on the analysis of 290 significantly Ewing sarcoma–associated SNPs in 343 affected subjects (a subset of the original GWAS cohort4) and 251 controls. Bottom, epigenetic profile of the chr10 susceptibility locus hotspot in the Ewing sarcoma cell lines SK-N-MC, A673 and EW502. Displayed are signals from published ChIP-Seq or DNase-Seq data for RNA polymerase II (pol II), DNaseI hypersensitivity (HS), as well as EWSR1-FLI1 (EF1), H3K4me1 and H3K27ac in Ewing sarcoma cells transfected with either a control shRNA (shGFP) or a specific shRNA against EWSR1-FLI1 (shEF1), and FAIRE8,26,27. The read count is given on the left. mSat1 and mSat2 are GGAA microsatellites (Supplementary Fig. 8). (b,c) Normalized luciferase reporter signals in A673-TR-shEF1 and SK-N-MC-TR-shEF1 cells containing a doxycycline-inducible shRNA against EWSR1-FLI1. EWSR1-FLI1 knockdown was confirmed by quantitative real-time PCR and immunoblot (loading control: α-tubulin). Data are shown as means and s.e.m.; n ≥ 5 independent experiments.
To prioritize SNPs for functional assessment, we crossed our sequencing data with published chromatin immunoprecipitation (ChIP)-Seq, DNase-Seq and ENCODE data, with a particular focus on Ewing sarcoma cell lines8,26,27, as recent studies have suggested that most causal SNPs cluster in epigenetically active and cell-type-specific regulatory elements28,29 (Fig. 3a). We also included data on conserved EGR2 regulatory elements previously mapped in animal models30 (Fig. 3a and Supplementary Fig. 8). We observed activating chromatin marks, signals for formaldehyde-assisted isolation of regulatory elements (FAIRE) and/or DNaseI hypersensitivity at five main loci: two loci corresponding to known EGR2 regulatory elements (MSE (myelinating Schwann cell enhancer)30 and BoneE (bone enhancer) (unpublished data); Supplementary Fig. 8), one to the ADO promoter, and two to GGAA microsatellites (mSat1 and mSat2) that overlapped with EWSR1-FLI1 ChIP-Seq signals (Fig. 3a). Because the ADO promoter does not contain Ewing sarcoma–associated SNPs, it was not further investigated. Luciferase reporter assays indicated that BoneE and MSE had no or weak activity in Ewing sarcoma, respectively (Fig. 3b, c). In contrast, both GGAA microsatellites exhibited strong EWSR1-FLI1–dependent enhancer-like activity (Fig. 3b, c). This activity corresponded to EWSR1-FLI1–dependent activating chromatin marks H3K4me1 and H3K27ac (Fig. 3a) and was consistent with recent evidence suggesting that EWSR1-FLI1 can act as a pioneer transcription factor to create de novo enhancers at GGAA microsatellites27.
Because of its observed higher enhancer activity, relatively simpler structure compared with mSat1, and localization in the subhaploblock containing some of the most significant Ewing sarcoma–associated SNPs (Figs. 3a and 4a and Supplementary Fig. 9), we focused on mSat2 and carried out PCR-based targeted long-read (300/300 nt) deep resequencing of all samples to analyze its genetic architecture. This yielded 1,158 analyzable mSat2 sequences, which revealed another SNP, rs79965208, in strong LD (D′ = 0.97) with the nearby rs6479860, one of the strongest sentinel SNPs from our GWAS4 (Fig. 4a and Supplementary Data). The significant association of the A allele of rs79965208 with Ewing sarcoma (P = 0.022, logistic regression) was replicated in two independent cohorts, the first based on direct sequencing of this SNP in 156 additional Ewing sarcoma subjects and 184 controls of European descent (P = 6.15 × 10⁻³, logistic regression), and the second on imputation from the 1000 Genomes Project Phase 3 reference panel31 of 162 individuals with first primary Ewing sarcoma from the Childhood Cancer Survivor Study32 genotyped on Illumina HumanOmni5Exome arrays and 435 cancer-free controls from the Division of Cancer Epidemiology and Genetics (P = 9.33 × 10⁻⁶, logistic regression) (Supplementary Data).
Figure 4. Germline variation at mSat2 modulates EWSR1-FLI1-dependent EGR2 expression.

(a) Coordinates, epigenetic profile and sequence of the mSat2 locus. Consistent with previous studies, H3K4me1 and H3K27ac signals peaked adjacent to the repetitive GGAA mSat8,27. The P value reported for rs6479860 reflects the significance of its association with Ewing sarcoma. (b) Luciferase reporter signals of mSat2 with the T or A allele at rs79965208. Data are mean and s.e.m.; n ≥ 6 independent experiments. P values determined via two-tailed unpaired Student’s t-test. (c) EGR2 expression measured by quantitative real-time PCR in 117 Ewing samples (103 primary tumors and 14 cell lines). EGR2 expression was normalized to that of RPLP0 and is displayed as expression relative to that of the median sample (set as 1). Horizontal bars represent means, and whiskers represent the 95% confidence interval boundaries. P value determined via linear regression. (d) Allele fraction of reads mapping to rs79965208 generated in a ChIP-MiSeq experiment in the A/T Ewing cell line MHH-ES1 (Supplementary Fig. 10 and Supplementary Data). (e) Left, representative Integrative Genomics Viewer37 pile-up of reads covering the EGR2 3′ UTR rs61865883 in matched constitutional or tumor DNA and tumor-derived RNA. The sample EW012 exhibited transcriptional allelic imbalance of EGR2, whereas EW577 did not. Right, raw rs61865883 allele fractions of targeted RNA deep sequencing in 45 Ewing sarcomas heterozygous (A/T) for the transcribed EGR2 3′ UTR allelic marker rs61865883. Horizontal bars represent means, and whiskers show the 95% confidence interval boundaries. P values determined via parametric two-tailed Student’s t-test. (f) Regulatory model of EWSR1-FLI1 and mSat2 controlling EGR2 expression and proliferation of Ewing sarcoma cells in convergence with the FGF pathway.
Interestingly, rs79965208 converts a GGAT into a GGAA motif, thereby connecting two adjacent GGAA repeats (Fig. 4a). The first GGAA repeat is polymorphic and contains a median number of 11 GGAA motifs, whereas the second is not polymorphic and is composed of four GGAA motifs. The A allele at rs79965208 therefore increases the median number of consecutive GGAA motifs from 11 to 16.
The previously described threshold for exponentially increasing EWSR1-FLI1–dependent enhancer activity is >12 consecutive GGAA motifs3. In the current study, a significantly larger proportion of Ewing sarcoma mSat2 sequences contained >12 GGAA motifs than did controls (65.88% versus 54.99%, P = 2.10 × 10⁻⁶, two-tailed Fisher’s exact test). We subsequently examined the enhancer properties of mSat2 corresponding to the reference sequence (hg19) containing either the T or A allele at rs79965208 in a luciferase assay. Relative to the T allele, the A allele increased the EWSR1-FLI1–induced enhancer activity of mSat2 (Fig. 4b). This transcription-activation property was observed in two Ewing sarcoma cell lines and was strictly dependent on EWSR1-FLI1, as its doxycycline-induced knockdown abrogated luciferase activity (Fig. 4b).
In accordance with the reporter assays, the A allele was associated with significantly higher EGR2 expression in Ewing sarcoma tumors (Fig. 4c). Consistently, ChIP experiments in the A/T Ewing sarcoma cell line MHH-ES1 using a specific antibody to FLI1 followed by targeted deep sequencing of mSat2 identified significant enrichment of reads containing the A allele (Fig. 4d and Supplementary Fig. 10), indicating that EWSR1-FLI1 preferentially bound to the A allele of rs79965208. Moreover, taking advantage of a transcribed SNP in the 3′ UTR of EGR2 (rs61865883), we assessed allele-specific EGR2 expression via targeted RNA deep sequencing. Across 45 individuals with heterozygosity for rs61865883, the transcriptional allelic imbalance was significantly higher in 16 tumors heterozygous for rs79965208 (A/T) than in 29 tumors homozygous (A/A or T/T) for this locus (Fig. 4e). Collectively, our results show that EGR2 is a Ewing sarcoma susceptibility gene whose overexpression in tumors is mediated by EWSR1-FLI1 through a risk-conferring enhancer-like polymorphic GGAA microsatellite (Fig. 4f).
Importantly, we noted that the chr10 signal was strongly reduced when we performed association testing conditionally on rs79965208, which indicated that this SNP is a major functional variant at this locus. However, some association signal was still observed, so it remains plausible that other SNPs could also have a regulatory effect on EGR2 expression through other mechanisms (Supplementary Fig. 11). The relatively low EGR2 expression observed in some Ewing sarcoma cases, particularly in cases with the T/T genotype, suggests that EGR2 may not always be absolutely necessary for Ewing sarcoma growth, and that growth may thus rely on alternative ‘transformation-facilitating genes’, possibly linked to other Ewing sarcoma susceptibility loci. However, we could not test whether Ewing sarcoma cells with a T/T genotype at rs79965208 have decreased sensitivity to EGR2 knockdown, as the T/T genotype was not observed across 21 different Ewing sarcoma cell lines (Supplementary Data).
As the incidence of Ewing sarcoma is higher in Europeans than in Africans12, we investigated the frequency of the A allele at rs79965208 across human populations, as determined by the 1000 Genomes Project31 (Supplementary Data). Strikingly, the A risk allele is highly significantly more frequent in non-African human populations (mean, 0.64; range, 0.57–0.70; n = 1,886) than in Africans (0.25; n = 691) (P = 2.20 × 10⁻¹⁶, Fisher’s exact test), which suggests that rs79965208 underwent a recent expansion in non-Africans and that it might contribute to the variable susceptibility to Ewing sarcoma across populations.
To our knowledge, this constitutes one of the first reports of how a germline variant highly correlated with the reported GWAS signal can inform our understanding of a cancer-specific acquired genetic abnormality22. Furthermore, our findings are in line with predictions that causal variants are not necessarily among the most significant variations leading to the identification of the susceptibility loci, but rather are in strong LD with them33,34. Moreover, they illustrate the contribution of a common germline variant that alters one or more key biological pathways in Ewing sarcoma through the modification of transcription regulatory elements that mediate the effects of a dominant oncogene13.
Online Methods
Cell culture
Ewing sarcoma cell lines A673, SK-N-MC, RDES and SK-ES1 were obtained from the American Type Culture Collection (ATCC); lines MHH-ES1 and TC-71 were from the German Collection of Microorganisms and Cell Cultures (DSMZ); lines EW1, EW3, EW7, EW16, EW18, EW23, EW24 and ORS were from the International Agency for Research on Cancer (Lyon, France); lines STA-ET-1, STA-ET-3, and STA-ET-8 were from the Children’s Cancer Research Institute Vienna (kindly provided by H. Kovar); lines ES7, EW22 and POE were from the Institut Curie Research Centre (Paris, France); and line TC-32 was from University of Nantes (kindly provided by F. Redini). A673-TR-shEF1 and SK-N-MC–TR–shEF1 harbor a doxycycline-inducible shRNA against EWSR1-FLI1 (ref. 38). Neuroblastoma: SK-N-SH, IMR-32; breast cancer: MDA-MB-231; alveolar rhabdomyosarcoma: SJ-RH30 (from ATCC). Human MSC lines L87 and V54-2 were kindly provided by P. Nelson (University Hospital LMU)39,40. Cells were grown at 37°C in 5% CO2 in a humidified atmosphere in RPMI 1640 medium (Gibco) containing 10% FCS (Eurobio), 100 U/ml penicillin and 100 μg/ml streptomycin (Gibco). Cell line purity and authenticity were confirmed by deep sequencing of susceptibility loci and short tandem repeat profiling. Cells were checked routinely by PCR for the absence of mycoplasma.
Transient transfection
Cells were seeded at a density of 1 × 10⁵ to 2 × 10⁵ per well of a six-well plate in a volume of 2.1 ml medium. Cell numbers were adjusted accordingly for transfection in larger or smaller volumes, and cells were transfected with siRNA (15 nM) with RNAiMAX (Invitrogen). The Qiagen AllStars Negative Control non-targeting siRNA was used as a control. siRNAs are listed in the Supplementary Data. For transfection with plasmids, 3 × 10⁵ cells per well of a six-well plate were seeded in 2.5 ml medium and transfected with Lipofectamine LTX and Plus Reagent (Invitrogen). The pCDH1-MCS1-Puro (pControl) (System Biosciences) and the pCDH1-EWSR1-FLI1 (pEWSR1-FLI1) vectors were described previously3,35.
Doxycycline inducible shRNA constructs
Negative-control and specific shRNAs against EGR2 were purchased from Sigma-Aldrich (Supplementary Data) and cloned into the pLKO-Tet-On all-in-one system41 (Addgene). Lentivirus was produced in HEK293T cells (from ATCC). SK-N-MC and POE cells were infected with a multiplicity of infection of 10 and selected for 7 d using 1–2 μg/ml puromycin (Invitrogen). Puromycin-resistant clones were grown from single cells. Knockdown efficacy was assessed in individual clones by quantitative real-time PCR (qRT-PCR) 96 h after the addition of doxycycline (1 μg/ml).
RNA extraction, reverse transcription and qRT-PCR
RNA was extracted with the Nucleospin II kit (Macherey-Nagel) and reverse-transcribed using the High-Capacity cDNA Reverse Transcription Kit (Applied Biosystems). PCRs were performed either using TaqMan assays with qRT-PCR Mastermix Plus without UNG (Eurogentec) or using SYBR green (Applied Biosystems). Oligonucleotides were purchased from MWG Eurofins Genomics (Supplementary Data). Reactions were run on an ABI/PRISM 7500 instrument and analyzed using the 7500 system SDS software (Applied Biosystems).
DNA microarrays
RNA from A673 and SK-N-MC cells was extracted 48 h after transfection with siRNA. RNA quality was checked with a Bioanalyzer (Agilent). Total RNA (200 ng) was amplified and labeled using Affymetrix GeneChip Whole Transcript Sense Target Labeling Kit. Antisense copy RNA was hybridized on Affymetrix Human Gene 2.1 ST arrays. Data were normalized by means of Probe Logarithmic Intensity Error (PLIER) estimation and custom brainarray CDF (v16)42, are compliant with the MIAME guidelines, and were deposited at the Gene Expression Omnibus (GEO; GSE62090).
eQTL analyses
Microarray data retrieved from GEO were normalized by robust multiarray averaging using customized brainarray CDF (v18)42. Accession codes are listed in the Supplementary Data. Matched genotype data for rs1848797 were retrieved from the series-matrix files of the original studies, except for the neuroblastoma and LCL data sets, for which genotypes were kindly provided by J. Maris (Children’s Hospital of Philadelphia, Pennsylvania, USA) or by L. Liang (Harvard School of Public Health, Boston, Massachusetts, USA) and W. Cookson (Imperial College, London, UK). Additionally, the Broad GTEx database23 was assessed for associations of EGR2 and ADO expression with the genotypes at rs1848797 (data censoring: July 8, 2014; 13 normal tissue types with at least 60 samples per tissue type, amounting to 1,421 samples). P values of linear regressions are reported.
Between-group analysis (BGA)
BGA was performed as described35. In total, 279 Ewing sarcomas (GSE34620, GSE34800, GSE12102, and unpublished data), together with 32 desmoplastic small-round-cell tumors (unpublished data), 52 medulloblastomas (GSE12992 and unpublished data), 64 neuroblastomas (GSE12460 and unpublished data), 121 rhabdomyosarcomas (E-TABM-1202 and unpublished data), 35 malignant rhabdoid tumors (unpublished data), and 25 osteosarcomas (GSE14827), were included in the BGA, which was carried out with the made4 R package43. All microarray data were generated on Affymetrix HG-U133Plus2.0 arrays and simultaneously normalized using the gcrma package version 2.18.1 in R.
Immunoblots
Immunoblots were done with rabbit polyclonal anti-EGR2 (1/2,000, PRB-236P, Covance), mouse monoclonal anti-FLI1 (1:5,000, clone 7.3)44, rabbit polyclonal anti-FLI1 (1:250, RB-9295-PCL, Thermo Scientific), rabbit monoclonal anti-ADO (1:1,000, EPR6581, Abcam), mouse monoclonal anti-α-tubulin (1:10,000, DM1A, Sigma-Aldrich), and mouse monoclonal anti-β-actin (1:10,000, A-5316, Sigma-Aldrich). Then membranes were incubated with an anti-rabbit or anti-mouse immunoglobulin G horseradish peroxidase-coupled secondary antibody (1:3,000, NA934 or NXA931, respectively; Amersham Biosciences). Proteins were detected by enhanced chemiluminescence (Pierce).
Sequence alignments
Murine and human DNA sequences of EGR2 enhancers were aligned using Clustal Ω (v1.2.0)45.
Immunohistochemistry
Analyses were done on archived tumors derived from xenografted Ewing sarcoma cell lines (A673, TC-71, SK-ES1), an alveolar rhabdomyosarcoma cell line (SJ-RH30), and a neuroblastoma cell line (IMR-32) grown in immunocompromised mice. Sections were stained with polyclonal rabbit anti-EGR2 as the primary antibody (1:50, PRB-236P, Covance) and hematoxylin.
Proliferation assays
xCELLigence
Cells were counted in real time with an xCELLigence instrument (Roche/ACEA Biosciences) monitoring impedance across gold microelectrodes. 8.5 × 10³ cells per well of a 96-well plate were seeded in 200 μl medium containing transfection reagents (hexaplicates per group). Medium and transfection reagents were refreshed after 48 h. For Coulter counting, cells were plated in six-well plates and transfected immediately after seeding with siRNA. After 96 h, cells (including supernatant) were harvested and counted in a Vi-CELL XR Cell Viability Analyzer (Beckman Coulter) (duplicates per group). For Resazurin assay, 3 × 10³ to 5 × 10³ cells per well of a 96-well plate were seeded in 100 μl medium containing the desired growth factor. After 72–96 h, Resazurin (Sigma-Aldrich) was added (20 μg/ml) and cells were incubated for another 2–6 h, depending on the cell line. Fluorescence signals proportional to the number of cells were recorded in a FLUOstar Omega plate reader (BMG labtech SARL).
Analysis of cell cycle and apoptosis
Cell cycle phases were analyzed using propidium iodide (PI) (Sigma-Aldrich). 96 h after transfection with siRNA, cells (including supernatant) were harvested, fixed in 70% ethanol at 4°C, and stained with PI solution (40 μg/ml, with 100 μg/ml RNase A). For analysis of apoptosis, cells (including supernatant) were harvested 96 h after transfection and stained with the Annexin-V-FITC/PI Apoptosis Detection Kit II (Becton Dickinson). Samples were assayed on an LSR II flow cytometer (Becton Dickinson). Data were analyzed with FlowJo software (TreeStar Inc.).
Clonogenic growth assays
Assays were performed essentially as described46. Depending on the cell line, 1.5 × 10³ to 3 × 10³ cells per well of a 12-well plate were seeded in 1 ml medium containing 5% FCS for A673 cells and 10% FCS for SK-N-MC, EW7 and POE cells. Cells were transfected with siRNA 24 h after seeding and re-transfected every 96 h. After 9–14 d, colonies were methanol-fixed and stained with crystal violet. Colony number and area were quantified on scanned plates with ImageJ. Relative clonogenicity is reported as the product of the colony number and the average colony size.
Spheroidal growth assays
2 × 10² cells per well of a 96-well plate were seeded in 120 μl in an equal mix of 10% FCS-containing RPMI 1640 medium and AIM-V medium (Gibco) in plates covered with attachment-preventing poly-2-hydroxyethyl-metacrylate (20 mg/ml PolyHEMA, Sigma-Aldrich). Doxycycline (1 μg/ml) was added for induction of EGR2 knockdown. We used the following clones: SK-N-MC shControl#19, shEGR2_4#31, shEGR2_5#2, POE shControl21b, shEGR2_4#22, and shEGR2_5#2. After 9–11 d, spheres were documented by phase-contrast microscopy (four individual images per well; octaplicates per group). Images were analyzed with ImageJ. The relative sphere-formation capacity is reported as the product of the sphere number and the average sphere size.
DNA constructs and mutagenesis
Human elements mSat1, mSat2, MSE and BoneE were PCR cloned using primers listed in the Supplementary Data into the pGL3-luc vector (Promega) upstream of the SV40 minimal promoter. T-to-A mutagenesis of mSat2 at rs79965208 was done with the QuickChange Mutagenesis Kit (Clontech).
Reporter assays and constructs
A673-TR-shEF1 and SK-N-MC-TR-shEF1 (ref. 38) were transfected with pGL3-luc vectors and Renilla pGL3-Rluc (ratio, 100:1). After 4 h, transfection media were replaced by media with or without doxycycline (1 μg/ml). Cells were lysed after 48 h and assayed with a dual luciferase assay system (Promega). Firefly luciferase activity was normalized to Renilla luciferase activity.
Chromatin immunoprecipitation (ChIP)
ChIP was done with rabbit polyclonal anti-FLI1 (C19-X, Santa Cruz Biotechnology) or rabbit IgG control in MHH-ES1 cells using iDeal ChIP-Seq Kit for Transcription Factors (Diagenode). DNA was sheared to an average size of 500 bp to enable mSat2 PCR amplification followed by deep sequencing in an Illumina MiSeq instrument (>42,000X). ChIP efficacy was validated by qRT-PCR using a CCND1 EWSR1-FLI1 binding site47 (positive control) and an intronic CCND1 locus (negative control; Supplementary Fig. 10). Primers are listed in the Supplementary Data.
Xenotransplantation experiments and mice
8 × 10⁶ POE or 15 × 106 SK-N-MC cells, containing either a doxycycline-inducible negative control shRNA (POE shControl#21b or SK-N-MC shControl#19) or a specific shRNA against EGR2 (POE shEGR2_4#22 or SK-N-MC shEGR2_4#31) were injected subcutaneously in the flanks of 6-week-old female C.B17/SCID mice (Charles Rivers Laboratories) in an equal mix of PBS and Matrigel (BD Biosciences). When tumors reached a volume of 75–100 mm3, mice were randomly assigned to the control (5% sucrose in drinking water) or the treatment (doxycycline (2 mg/l) and 5% sucrose in drinking water) group. Tumor growth was monitored with a caliper every 2–3 d. Mice were killed once tumors reached a volume of 1,500 mm3 calculated as V = a × b2/2 with a being the largest diameter and b the smallest. Doxycycline-induced EGR2 knockdown was confirmed by qRT-PCR 72 h after the start of doxycycline treatment in aliquots of the injected cells that were grown in parallel in vitro. Experiments were conducted in accordance with the recommendations of the European Community (86/609/EEC), the French Competent Authority, and UKCCCR (guidelines for the welfare and use of animals in cancer research). The sample size was not predetermined.
Human samples
Ewing sarcoma patients from France have been referred to the Institut Curie Hospital for molecular diagnosis since 1990. All subjects included in this study had a specific EWSR1-ETS fusion. Constitutional DNA of adequate quality was available for 343 subjects. This study received approval by institutional review boards and ethics committees (Comité de Protection des Personnes Ile-de-France I). Consent was obtained through communication with patients or families either by the referring oncologists or by the Institut Curie Unité de Génétique Somatique. Genomic DNA was isolated from bone marrow or blood via proteinase K lysis and phenol chloroform extraction method. We included control samples from 251 French subjects originally obtained as part of the Cancer Genetic Markers of Susceptibility (CGEMS) prostate cancer project48. All control subjects were male and recruited in the geographical areas close to Paris, Nancy and Brest through participation in a systematic health-screening program funded by the French National Health Insurance. All controls were determined to be unaffected by cancer through medical examination and blood test for prostate-specific antigen. The sample size was not predetermined.
Analysis of population substructure
Principal-component analysis (PCA) was performed as described4 to select genetically matching cases and controls for sequencing and association testing. To ensure genetic homogeneity in populations of affected subjects and controls, we used an EM-fitted Gaussian mixture clustering method assuming one cluster and noise to exclude isolated subjects (Supplementary Fig. 6). Noise is initialized by the NNclean function in the prabclus R package, which determines whether data points are noise or part of a cluster on the basis of a Poisson process model. This was followed by definition of the partition between the core of the data (one cluster) and the noise using the mclustBIC function of the mclust R package. Clustering was carried out in two dimensions for cases versus controls on the basis of the relative contribution of the first two PCA vectors.
DNA capturing and next-generation sequencing
Illumina HiSeq2500 (non-repetitive regions)
DNA capturing of all three susceptibility loci4 was done with a customized Nextera target-enrichment system (Illumina). For all loci, the given risk haploblock and the adjacent 5′ and 3′ haploblocks were captured, for a total target size of 993 kb (library size, 500 bp; 2,614 Nextera probes with a predicted average coverage of the target regions of 95%: chr1:11,023,000–11,088,000 (171 probes); chr10:64,252,000–64,967,000 (1,882 probes); chr15:40,203,000–40,416,000 (561 probes)). Repetitive regions such as GGAA microsatellites were omitted in the Nextera design. Constitutional DNA was captured from 343 Ewing sarcoma cases and 251 controls. In addition, DNA from 14 Ewing sarcoma cell lines was captured. Massive parallel-end deep sequencing was done in an Illumina HiSeq2500 instrument (rapid mode; 150/150 nt) yielding a median capturing rate of 91.35% with at least 10X across samples and target regions and median read depth per sample of 217X (Supplementary Fig. 6).
Illumina MiSeq (GGAA microsatellites)
The mSat2 region was amplified by PCR with primers listed in the Supplementary Data and Phusion High-Fidelity DNA polymerase (Thermo Scientific). After barcoding (Fluidigm), massive parallel-end deep sequencing was done in an Illumina MiSeq instrument (300/300 nt). Paired-end reads were merged using SeqPrep tools using default parameters (median coverage, 124X).
Variant calling, genotyping, and statistical assessment
HiSeq-reads were mapped on hg19 (NCBI GhR36 build) using BWA 0.6.2 with up to 4% mismatches allowed. BAM files were preprocessed according to recommendations of the Genome Analysis Toolkit (GATK) using Samtools 1.8 (ref. 49), Picard tools 1.97, and GATK2.2.16 (ref. 50). Variant calling was done with GATK, focusing on single-nucleotide variants (SNVs) supported by ≥2 identical alternative reads at positions with ≥10X in 90% of the samples. Genotype calling was done with the GATK DepthOfCoverage function. SNVs were defined as homozygous if the alternative allele ratio (AAR) was <0.2 or >0.8, whereas heterozygous SNVs were defined by an AAR within ± 2 s.d. of the mean AAR of the non-homozygous SNVs. SNVs that had a minor allele frequency >0.05 and that did not depart from Hardy-Weinberg equilibrium in the entire cohort were considered for further analyses. Regional association results were plotted using LocusZoom51. The workflow is summarized in Supplementary Figure 7.
Association testing and analysis of LD
Statistical differences in genotype distributions were assessed with a logistic regression. Associations were adjusted for significant PCA eigenvectors (EV1, EV5 and EV6). P values were adjusted by false discovery rate. Significantly different SNVs were annotated with information available from dbSNPv137 and RefGene databases using ANNOVAR v2013. LD and haplotype analyses were done with PLINK and HaploView52,53 as described by Gabriel et al.54. Association testing conditional to rs79965208 was done with PLINK53 with a logistic regression including significant PCA eigenvectors (EV1, EV5 and EV6) and the ‘condition’ command option.
Analysis of mSat2 MiSeq reads
To avoid mapping errors, raw reads were aligned on specific ‘anchor’ sequences (Supplementary Data) flanking mSat2. We determined the sequence between these anchors using a custom script designed to report the two alleles of each sample, taking into account a PCR-based slippage bias generating n – 1 GGAA repeats co-occurring with n GGAA repeats and a lower PCR-amplification rate affecting long GGAA stretches (≥ 19 GGAA repeats). Only alleles supported by ≥10X were reported. Comparison of results with matched mSat2 Sanger sequences in 57 cases revealed an accuracy rate of our custom script and MiSeq analysis of 97.4%.
Replication of association results
A first replication of the initial rs79965208 association result was conducted in an independent sample of individuals of European descent, which was part of our preceding GWAS4. The pool of affected subjects included 156 individuals of European descent. Controls were 184 unaffected women from the French E3N cohort55. In this cohort, the mSat2 region containing rs79965208 was directly sequenced in an Illumina MiSeq instrument. A second replication of the association of rs79965208 with Ewing sarcoma was conducted in an independent sample of individuals of European descent from the United States. This group of affected subjects included 162 individuals identified from the Childhood Cancer Survivor Study (CCSS), a multi-institutional follow-up study of 5-year survivors of childhood cancer diagnosed between 1970 and 1986 (ref. 32). Subjects were genotyped on the Illumina HumanOmni5Exome array as part of a larger project within CCSS, with 4,052,581 unique polymorphic loci and 5,324 unique samples from unrelated individuals of European descent passing quality control thresholds (missing rate < 0.1, locus genotype concordance > 0.99 in 539 blinded duplicate samples, sample missing rate < 0.08, sample heterozygosity 0.11–0.16, and genotyped sex concordant with self-report). Controls included 435 individuals of European descent from the Division of Cancer Epidemiology and Genetics reference panel of cancer-free adults56. A region ±1 Mb of rs79965208 was imputed using the 1000 Genomes Project Phase 3 reference panel in IMPUTE2 (ref. 57). The rs79965208 SNP was well imputed (info score = 0.952). Associations were assessed using logistic regression models and adjusted for significant PCA eigenvectors (EV1, EV2 and EV9). The sample size was not predetermined.
Analysis of allele-specific expression
Allele-specific EGR2 expression was assessed via targeted RNA sequencing (Illumina HiSeq2500) in 45 individuals with Ewing sarcoma who were heterozygous in constitutional DNA for rs61865883 (located in the EGR2 3′ UTR), serving as transcribed allelic marker. Recurrent loss of heterozygosity at the EGR2 locus was ruled out previously4,11 and was further excluded by targeted DNA sequencing of 10 out of the 45 subjects for which matched tumor and constitutional DNA was available. For each of these 45 subjects, we statistically compared the raw rs61865883 allele fractions of 16 tumors heterozygous for rs79965208 (A/T) with those of 29 tumors that were homozygous for rs79965208 (A/A or T/T) using a parametric two-tailed Student’s t-test.
Analysis of ChIP-Seq, DNase-Seq and FAIRE-Seq data
Publicly available data were retrieved from the GEO. *.bed files from Patel et al.8 (GSE31838) were generated in FAIRE-Seq experiments in EW502 Ewing cells (GSM790218) and converted to hg19. ENCODE26 SK-N-MC DNase-Seq (GSM736570) and RNA Pol II ChIP-Seq (GSM1010793), together with the FAIRE-Seq data, were analyzed within the Nebula environment58 using Model-based Analysis of ChIP-Seq v1.4.2 (MACS)59 and converted to *.wig format for display in the UCSC Genome Browser60. Preprocessed ChIP-Seq data from Riggi et al.27 (GSE61944) were converted from the *.bigwig to the *.wig format using the UCSC bigWigToWig conversion tool. Samples used were: GSM1517544 SK-N-MC_shGFP_48h_FLI1, GSM1517553 SK-N-MC_shFLI1_48h_FLI1, GSM1517569 A673_shGFP_48h_FLI1, GSM1517572 A673_shFLI1_48h_FLI1, GSM1517548 SK-N-MC_shGFP_96h_H3K4me1, GSM1517557 SK-N-MC_shFLI1_96h_H3K4me1, GSM1517545 SK-N-MC_shGFP_48h_H3K27ac, and GSM1517554 SK-N-MC_shFLI1_48h_H3K27ac.
Supplementary Material
Acknowledgments
T.G.P.G. is supported by a grant from the German Research Foundation (DFG GR3728/2-1), the Daimler and Benz Foundation in cooperation with the Reinhard Frank Foundation, by LMU Munich’s Institutional Strategy LMUexcellent within the framework of the German Excellence Initiative and by the ‘Mehr LEBEN für krebskranke Kinder – Bettina-Bräu-Stiftung’. D.S. is supported by the Institut Curie–SIRIC (Site de Recherche Intégrée en Cancérologie) program. F.C.-A. is supported by a grant from the Asociación Pablo Ugarte and Instituto de Salud Carlos III RTICC RD12/0036/0027. D.G.C. is supported by a grant from the InfoSarcomes association. The Childhood Cancer Survivor Study is supported by the National Cancer Institute (CA55727, G.T. Armstrong), with funding for genotyping from the Intramural Research Program of the National Institutes of Health, National Cancer Institute. This work was supported by grants from the Institut Curie; the INSERM; the ANR-10-EQPX-03 from the Agence Nationale de la Recherche (Investissements d’Avenir); ANR10-INBS-09-08 from the Canceropôle Ile-de-France; the Ligue Nationale Contre le Cancer (Equipe labellisée); the Institut National du Cancer (PLBIO14-237); the European PROVABES (ERA-649 NET TRANSCAN JTC-2011); ASSET (FP7-HEALTH-2010-259348), and EEC (HEALTH-F2-2013-602856) projects; the Société Française des Cancers de l’Enfant. The following associations supported this work: Courir pour Mathieu, Dans les pas du Géant, Olivier Chape, Les Bagouzamanon, Enfants et Santé, and les Amis de Claire. The Charnay laboratory was financed by the INSERM, the CNRS, the Ministère de la Recherche et Technologie, and the Fondation pour la Recherche Médicale. It has received support under the program “Investissements d’Avenir” launched by the French Government and implemented by the ANR, with the references ANR-10-LABX-54 MEMOLIFE and ANR-11-IDEX-0001-02 PSL* Research University. We thank J. Maris for providing genotype information for the neuroblastoma data set, and thank L. Liang and W. Cookson for providing access to genotype data of the LCL data set. We also thank the following clinicians and pathologists for providing samples used in this work: I. Aerts, P. Anract, C. Bergeron, L. Boccon-Gibod, F. Boman, F. Bourdeaut, C. Bouvier, R. Bouvier, L. Brugières, E. Cassagnau, J. Champigneulle, C. Cordonnier, J. M. Coindre, N. Corradini, A. Coulomb-Lhermine, A. De Muret, G. De Pinieux, A.S. Defachelles, A. Deville, F. Dijoud, F. Doz, C. Dufour, K. Fernandez, N. Gaspard, L. Galmiche-Rolland, C. Glorion, A. Gomez-Brouchet, J.M. Guinebretière, H. Jouan, C. Jeanne-Pasquier, B. Kantelip, F. Labrousse, V. Laithier, F. Larousserie, G. Leverger, C. Linassier, P. Mary, G. Margueritte, E. Mascard, A. Moreau, J. Michon, C. Michot, F. Millot, Y. Musizzano, M. Munzer, B. Narciso, O. Oberlin, D. Orbach, H. Pacquement, Y. Perel, B. Petit, M. Peuchmaur, J.Y. Pierga, C. Piguet, S. Piperno-Neumann, E. Plouvier, D. Ranchere-Vince, J. Rivel, C. Rouleau, H. Rubie, H. Sartelet, G. Schleiermacher, C. Schmitt, N. Sirvent, D. Sommelet, P. Terrier, R. Tichit, J. Vannier, J. M. Vignaud, and V. Verkarre. We also thank D. Darmon for technical assistance, S. Grossetete-Lalami for bioinformatic assistance, and V.R. Buchholz and E. Butt for critical reading of the manuscript.
Footnotes
URLs. https://www.addgene.org/21915/; http://www.gtexportal.org/home/; http://www.r-project.org/; https://github.com/jstjohn/SeqPrep; http://picard.sourceforge.net; http://www.clustal.org/omega/.
Accession codes. Primary microarray data are compliant with the MIAME guidelines and were deposited at the Gene Expression Omnibus (GEO) under accession GSE62090. Referenced accessions: GSE34620, GSE3526, GSE15347, GSE40364, GSE8052, GSE37384, GSE3960, GSE34800, GSE12102, GSE12992, GSE12460, E-TABM-1202, GSE14827, GSE36133, GSM790218, GSM736570, GSM1010793, GSM1517544, GSM1517553, GSM1517569, GSM1517572, GSM1517548, GSM1517557, GSM1517545, and GSM1517554.
Competing financial interests
The authors declare no competing financial interests.
Author Contributions
T.G.P.G. coordinated and designed the study, performed all functional experiments, analyzed the sequencing data, performed bioinformatic analyses, wrote the paper, designed the figures and helped in grant applications. V. Bernard processed the sequencing data and performed bioinformatic analyses. P.G.-H. participated in study design, cloned enhancer elements and contributed to data analysis. V.R. performed all sequencing experiments and helped analyze the bioinformatic data. D.S. contributed to the in vivo experiments, performed the ChIP-MiSeq experiments and provided experimental protocols. M.M.A., F.C.-A., A.H.J. and S.Z. helped in functional experiments. O.M., F.T. and C.L. provided statistical advice and helped in the bioinformatic analyses. G. Perot assisted in generation of the shRNA constructs. M.C.L.D., O.O. and P.M.-B. provided Ewing sarcoma samples and annotation. G. Pierron, S.R. and E.L. provided and prepared Ewing sarcoma samples. T.R.-F. coordinated and supervised sequencing experiments. V. Boeva helped analyze ChIP-Seq data. J.A. provided the A673-TR-shEF1 and SK-N-MC-TR-shEF1 cell lines. A.S.V. performed principal-component analysis clustering of Ewing sarcoma subjects and controls. G.C.-T. and O.C. provided DNA from healthy controls. D.G.C. and S.J.C. provided genetic and statistical guidance. S.B., L.M.M., M.J.M. and S.J.C. provided data for the CCSS replication cohort and performed imputation analyses. P.C. provided advice on analyses concerning EGR2 and laboratory infrastructure. O.D. initiated, designed and supervised the study; provided biological and genetic guidance; analyzed the data; wrote the paper together with T.G.P.G.; and provided laboratory infrastructure and financial support. All authors read and approved the final manuscript.
References
- 1.Delattre O, et al. Gene fusion with an ETS DNA-binding domain caused by chromosome translocation in human tumors. Nature. 1992;359:162–165. doi: 10.1038/359162a0. [DOI] [PubMed] [Google Scholar]
- 2.Gangwal K, et al. Microsatellites as EWS/FLI response elements in Ewing’s sarcoma. Proc Natl Acad Sci U S A. 2008;105:10149–10154. doi: 10.1073/pnas.0801073105. [DOI] [PMC free article] [PubMed] [Google Scholar]
- 3.Guillon N, et al. The oncogenic EWS-FLI1 protein binds in vivo GGAA microsatellite sequences with potential transcriptional activation function. PloS One. 2009;4:e4932. doi: 10.1371/journal.pone.0004932. [DOI] [PMC free article] [PubMed] [Google Scholar]
- 4.Postel-Vinay S, et al. Common variants near TARDBP and EGR2 are associated with susceptibility to Ewing sarcoma. Nat Genet. 2012;44:323–327. doi: 10.1038/ng.1085. [DOI] [PubMed] [Google Scholar]
- 5.Von Levetzow C, et al. Modeling initiation of Ewing sarcoma in human neural crest cells. PloS One. 2011;6:e19305. doi: 10.1371/journal.pone.0019305. [DOI] [PMC free article] [PubMed] [Google Scholar]
- 6.Tirode F, et al. Mesenchymal stem cell features of Ewing tumors. Cancer Cell. 2007;11:421–429. doi: 10.1016/j.ccr.2007.02.027. [DOI] [PubMed] [Google Scholar]
- 7.Delattre O, et al. The Ewing family of tumors--a subgroup of small-round-cell tumors defined by specific chimeric transcripts. N Engl J Med. 1994;331:294–299. doi: 10.1056/NEJM199408043310503. [DOI] [PubMed] [Google Scholar]
- 8.Patel M, et al. Tumor-specific retargeting of an oncogenic transcription factor chimera results in dysregulation of chromatin and transcription. Genome Res. 2012;22:259–270. doi: 10.1101/gr.125666.111. [DOI] [PMC free article] [PubMed] [Google Scholar]
- 9.Brohl AS, et al. The genomic landscape of the Ewing Sarcoma family of tumors reveals recurrent STAG2 mutation. PLoS Genet. 2014;10:e1004475. doi: 10.1371/journal.pgen.1004475. [DOI] [PMC free article] [PubMed] [Google Scholar]
- 10.Crompton BD, et al. The genomic landscape of pediatric ewing sarcoma. Cancer Discov. 2014;4:1326–1341. doi: 10.1158/2159-8290.CD-13-1037. [DOI] [PubMed] [Google Scholar]
- 11.Tirode F, et al. Genomic Landscape of Ewing Sarcoma Defines an Aggressive Subtype with Co-Association of STAG2 and TP53 Mutations. Cancer Discov. 2014;4:1342–1353. doi: 10.1158/2159-8290.CD-14-0622. [DOI] [PMC free article] [PubMed] [Google Scholar]
- 12.Worch J, et al. Racial differences in the incidence of mesenchymal tumors associated with EWSR1 translocation. Cancer Epidemiol Biomark Prev. 2011;20:449–453. doi: 10.1158/1055-9965.EPI-10-1170. [DOI] [PMC free article] [PubMed] [Google Scholar]
- 13.Chung CC, Chanock SJ. Current status of genome-wide association studies in cancer. Hum Genet. 2011;130:59–78. doi: 10.1007/s00439-011-1030-9. [DOI] [PubMed] [Google Scholar]
- 14.Dominy JE, Jr, et al. Discovery and characterization of a second mammalian thiol dioxygenase, cysteamine dioxygenase. J Biol Chem. 2007;282:25189–25198. doi: 10.1074/jbc.M703089200. [DOI] [PubMed] [Google Scholar]
- 15.Chandra A, Lan S, Zhu J, Siclari VA, Qin L. Epidermal growth factor receptor (EGFR) signaling promotes proliferation and survival in osteoprogenitors by increasing early growth response 2 (EGR2) expression. J Biol Chem. 2013;288:20488–20498. doi: 10.1074/jbc.M112.447250. [DOI] [PMC free article] [PubMed] [Google Scholar]
- 16.Topilko P, et al. Krox-20 controls myelination in the peripheral nervous system. Nature. 1994;371:796–799. doi: 10.1038/371796a0. [DOI] [PubMed] [Google Scholar]
- 17.Mackintosh C, Madoz-Gúrpide J, Ordóñez JL, Osuna D, Herrero-Martín D. The molecular pathogenesis of Ewing’s sarcoma. Cancer Biol Ther. 2010;9:655–667. doi: 10.4161/cbt.9.9.11511. [DOI] [PubMed] [Google Scholar]
- 18.Gao C, et al. HEFT: eQTL analysis of many thousands of expressed genes while simultaneously controlling for hidden factors. Bioinformatics. 2014;30:369–376. doi: 10.1093/bioinformatics/btt690. [DOI] [PMC free article] [PubMed] [Google Scholar]
- 19.Radtke I, et al. Genomic analysis reveals few genetic alterations in pediatric acute myeloid leukemia. Proc Natl Acad Sci U S A. 2009;106:12944–12949. doi: 10.1073/pnas.0903142106. [DOI] [PMC free article] [PubMed] [Google Scholar]
- 20.Moffatt MF, et al. Genetic variants regulating ORMDL3 expression contribute to the risk of childhood asthma. Nature. 2007;448:470–473. doi: 10.1038/nature06014. [DOI] [PubMed] [Google Scholar]
- 21.Northcott PA, et al. Subgroup-specific structural variation across 1,000 medulloblastoma genomes. Nature. 2012;488:49–56. doi: 10.1038/nature11327. [DOI] [PMC free article] [PubMed] [Google Scholar]
- 22.Wang K, et al. Integrative genomics identifies LMO1 as a neuroblastoma oncogene. Nature. 2011;469:216–220. doi: 10.1038/nature09609. [DOI] [PMC free article] [PubMed] [Google Scholar]
- 23.GTEx Consortium. The Genotype-Tissue Expression (GTEx) project. Nat Genet. 2013;45:580–585. doi: 10.1038/ng.2653. [DOI] [PMC free article] [PubMed] [Google Scholar]
- 24.Labalette C, et al. Hindbrain patterning requires fine-tuning of early krox20 transcription by Sprouty 4. Development. 2011;138:317–326. doi: 10.1242/dev.057299. [DOI] [PubMed] [Google Scholar]
- 25.Weisinger K, Kayam G, Missulawin-Drillman T, Sela-Donenfeld D. Analysis of expression and function of FGF-MAPK signaling components in the hindbrain reveals a central role for FGF3 in the regulation of Krox20, mediated by Pea3. Dev Biol. 2010;344:881–895. doi: 10.1016/j.ydbio.2010.06.001. [DOI] [PubMed] [Google Scholar]
- 26.ENCODE Project Consortium et al. An integrated encyclopedia of DNA elements in the human genome. Nature. 2012;489:57–74. doi: 10.1038/nature11247. [DOI] [PMC free article] [PubMed] [Google Scholar]
- 27.Riggi N, et al. EWS-FLI1 Utilizes Divergent Chromatin Remodeling Mechanisms to Directly Activate or Repress Enhancer Elements in Ewing Sarcoma. Cancer Cell. 2014;26:668–681. doi: 10.1016/j.ccell.2014.10.004. [DOI] [PMC free article] [PubMed] [Google Scholar]
- 28.Ernst J, et al. Mapping and analysis of chromatin state dynamics in nine human cell types. Nature. 2011;473:43–49. doi: 10.1038/nature09906. [DOI] [PMC free article] [PubMed] [Google Scholar]
- 29.Maurano MT, et al. Systematic localization of common disease-associated variation in regulatory DNA. Science. 2012;337:1190–1195. doi: 10.1126/science.1222794. [DOI] [PMC free article] [PubMed] [Google Scholar]
- 30.Ghislain J, et al. Characterisation of cis-acting sequences reveals a biphasic, axon-dependent regulation of Krox20 during Schwann cell development. Development. 2002;129:155–166. doi: 10.1242/dev.129.1.155. [DOI] [PubMed] [Google Scholar]
- 31.1000 Genomes Project Consortium et al. An integrated map of genetic variation from 1,092 human genomes. Nature. 2012;491:56–65. doi: 10.1038/nature11632. [DOI] [PMC free article] [PubMed] [Google Scholar]
- 32.Robison LL, et al. The Childhood Cancer Survivor Study: a National Cancer Institute-supported resource for outcome and intervention research. J Clin Oncol. 2009;27:2308–2318. doi: 10.1200/JCO.2009.22.3339. [DOI] [PMC free article] [PubMed] [Google Scholar]
- 33.Edwards SL, Beesley J, French JD, Dunning AM. Beyond GWASs: illuminating the dark road from association to function. Am J Hum Genet. 2013;93:779–797. doi: 10.1016/j.ajhg.2013.10.012. [DOI] [PMC free article] [PubMed] [Google Scholar]
- 34.Faye LL, Machiela MJ, Kraft P, Bull SB, Sun L. Re-ranking sequencing variants in the post-GWAS era for accurate causal variant identification. PLoS Genet. 2013;9:e1003609. doi: 10.1371/journal.pgen.1003609. [DOI] [PMC free article] [PubMed] [Google Scholar]
- 35.Surdez D, et al. Targeting the EWSR1-FLI1 oncogene-induced protein kinase PKC-β abolishes ewing sarcoma growth. Cancer Res. 2012;72:4494–4503. doi: 10.1158/0008-5472.CAN-12-0371. [DOI] [PubMed] [Google Scholar]
- 36.International HapMap 3 Consortium et al. Integrating common and rare genetic variation in diverse human populations. Nature. 2010;467:52–58. doi: 10.1038/nature09298. [DOI] [PMC free article] [PubMed] [Google Scholar]
- 37.Robinson JT, et al. Integrative genomics viewer. Nat Biotechnol. 2011;29:24–26. doi: 10.1038/nbt.1754. [DOI] [PMC free article] [PubMed] [Google Scholar]
- 38.Carrillo J, et al. Cholecystokinin down-regulation by RNA interference impairs Ewing tumor growth. Clin Cancer Res. 2007;13:2429–2440. doi: 10.1158/1078-0432.CCR-06-1762. [DOI] [PubMed] [Google Scholar]
- 39.Conrad C, Gottgens B, Kinston S, Ellwart J, Huss R. GATA transcription in a small rhodamine 123(low)CD34(+) subpopulation of a peripheral blood-derived CD34(-)CD105(+) mesenchymal cell line. Exp Hematol. 2002;30:887–895. doi: 10.1016/s0301-472x(02)00865-2. [DOI] [PubMed] [Google Scholar]
- 40.Thalmeier K, et al. Establishment of two permanent human bone marrow stromal cell lines with long-term post irradiation feeder capacity. Blood. 1994;83:1799–1807. [PubMed] [Google Scholar]
- 41.Wiederschain D, et al. Single-vector inducible lentiviral RNAi system for oncology target validation. Cell Cycle. 2009;8:498–504. doi: 10.4161/cc.8.3.7701. [DOI] [PubMed] [Google Scholar]
- 42.Dai M, et al. Evolving gene/transcript definitions significantly alter the interpretation of GeneChip data. Nucleic Acids Res. 2005;33:e175. doi: 10.1093/nar/gni179. [DOI] [PMC free article] [PubMed] [Google Scholar]
- 43.Culhane AC, Thioulouse J, Perrière G, Higgins DG. MADE4: an R package for multivariate analysis of gene expression data. Bioinformatics. 2005;21:2789–2790. doi: 10.1093/bioinformatics/bti394. [DOI] [PubMed] [Google Scholar]
- 44.Melot T, et al. Production and characterization of mouse monoclonal antibodies to wild-type and oncogenic FLI-1 proteins. Hybridoma. 1997;16:457–464. doi: 10.1089/hyb.1997.16.457. [DOI] [PubMed] [Google Scholar]
- 45.Sievers F, et al. Fast, scalable generation of high-quality protein multiple sequence alignments using Clustal Omega. Mol Syst Biol. 2011;7:539. doi: 10.1038/msb.2011.75. [DOI] [PMC free article] [PubMed] [Google Scholar]
- 46.Franken NAP, Rodermond HM, Stap J, Haveman J, van Bree C. Clonogenic assay of cells in vitro. Nat Protoc. 2006;1:2315–2319. doi: 10.1038/nprot.2006.339. [DOI] [PubMed] [Google Scholar]
- 47.Boeva V, et al. De novo motif identification improves the accuracy of predicting transcription factor binding sites in ChIP-Seq data analysis. Nucleic Acids Res. 2010;38:e126. doi: 10.1093/nar/gkq217. [DOI] [PMC free article] [PubMed] [Google Scholar]
- 48.Yeager M, et al. Genome-wide association study of prostate cancer identifies a second risk locus at 8q24. Nat Genet. 2007;39:645–649. doi: 10.1038/ng2022. [DOI] [PubMed] [Google Scholar]
- 49.Li H, et al. The Sequence Alignment/Map format and SAMtools. Bioinformatics. 2009;25:2078–2079. doi: 10.1093/bioinformatics/btp352. [DOI] [PMC free article] [PubMed] [Google Scholar]
- 50.McKenna A, et al. The Genome Analysis Toolkit: a MapReduce framework for analyzing next-generation DNA sequencing data. Genome Res. 2010;20:1297–1303. doi: 10.1101/gr.107524.110. [DOI] [PMC free article] [PubMed] [Google Scholar]
- 51.Pruim RJ, et al. LocusZoom: regional visualization of genome-wide association scan results. Bioinformtics. 2010;26:2336–2337. doi: 10.1093/bioinformatics/btq419. [DOI] [PMC free article] [PubMed] [Google Scholar]
- 52.Barrett JC, Fry B, Maller J, Daly MJ. Haploview: analysis and visualization of LD and haplotype maps. Bioinformatics. 2005;21:263–265. doi: 10.1093/bioinformatics/bth457. [DOI] [PubMed] [Google Scholar]
- 53.Purcell S, et al. PLINK: a tool set for whole-genome association and population-based linkage analyses. Am J Hum Genet. 2007;81:559–575. doi: 10.1086/519795. [DOI] [PMC free article] [PubMed] [Google Scholar]
- 54.Gabriel SB, et al. The structure of haplotype blocks in the human genome. Science. 2002;296:2225–2229. doi: 10.1126/science.1069424. [DOI] [PubMed] [Google Scholar]
- 55.Clavel-Chapelon F, et al. E3N, a French cohort study on cancer risk factors. E3N Group. Etude Epidémiologique auprès de femmes de l’Education Nationale. Eur J Cancer Prev ECP. 1997;6:473–478. doi: 10.1097/00008469-199710000-00007. [DOI] [PubMed] [Google Scholar]
- 56.Wang Z, et al. Improved imputation of common and uncommon SNPs with a new reference set. Nat Genet. 2012;44:6–7. doi: 10.1038/ng.1044. [DOI] [PMC free article] [PubMed] [Google Scholar]
- 57.Howie BN, Donnelly P, Marchini J. A flexible and accurate genotype imputation method for the next generation of genome-wide association studies. PLoS Genet. 2009;5:e1000529. doi: 10.1371/journal.pgen.1000529. [DOI] [PMC free article] [PubMed] [Google Scholar]
- 58.Boeva V, Lermine A, Barette C, Guillouf C, Barillot E. Nebula--a web-server for advanced ChIP-seq data analysis. Bioinformatics. 2012;28:2517–2519. doi: 10.1093/bioinformatics/bts463. [DOI] [PubMed] [Google Scholar]
- 59.Zhang Y, et al. Model-based analysis of ChIP-Seq (MACS) Genome Biol. 2008;9:R137. doi: 10.1186/gb-2008-9-9-r137. [DOI] [PMC free article] [PubMed] [Google Scholar]
- 60.Meyer LR, et al. The UCSC Genome Browser database: extensions and updates 2013. Nucleic Acids Res. 2013;41:D64–69. doi: 10.1093/nar/gks1048. [DOI] [PMC free article] [PubMed] [Google Scholar]
Associated Data
This section collects any data citations, data availability statements, or supplementary materials included in this article.