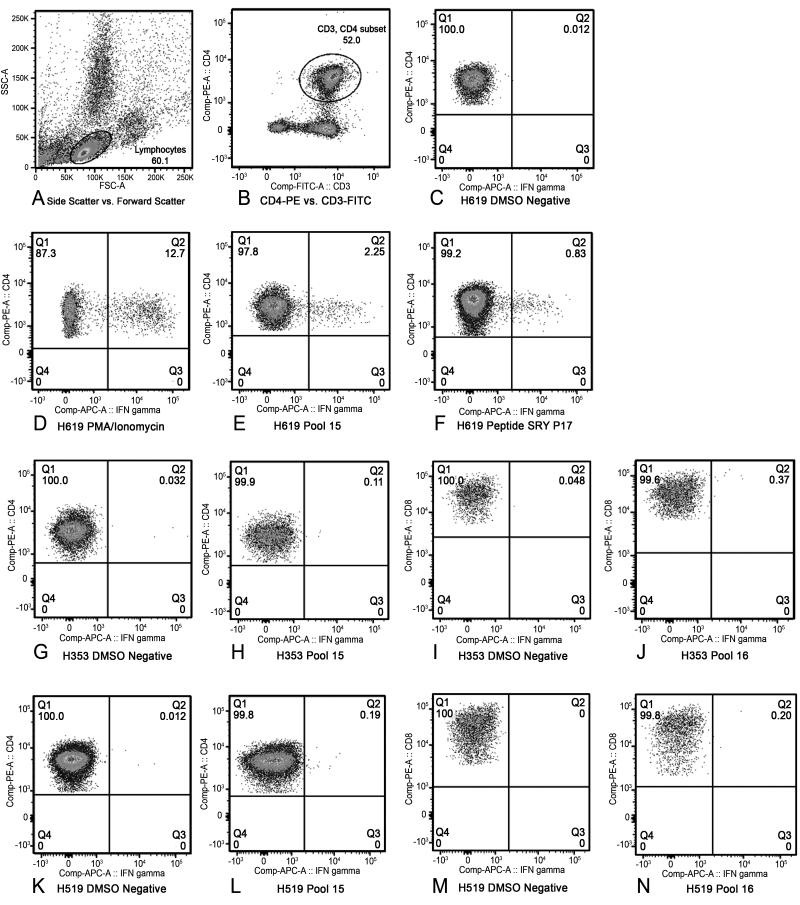
Figure 4. Three-color intracellular cytokine staining for interferon-γ to confirm ELISpot results.
For each sample, a lymphocyte gate was drawn in the forward scatter and side scatter plot (A). All samples were stained with CD3-FITC, and either CD4-PE or CD8-PE. The CD4 or CD8+ T cells were gated from the lymphocyte gate as shown (B). All samples underwent intracellular cytokine staining for interferon-γ (APC). The percentage of interferon-γ-expressing CD4+ or CD8+ T cells were then determined by placing a gate with an adequate proximity to the DMSO-negative control (C) and maintaining that same gate for all samples tested. A positive response was defined as greater than or equal to 0.1% interferon-γ-expressing CD3+CD4+ or CD3+CD8+ T cells as long as the DMSO negative control for that sample remained below 0.05%. Phorbol myristate acetate (PMA) at 100 ng/mL and Ionomycin at 1 μg/mL was used as a positive control (D). The percentage of interferon-γ CD4+ T cells of H619 responding to pool 15 (E) and peptide SRY P17 (F). The percentage of interferon-γ CD4+ T cells of D3 (H353) responding to pool 15 (G-H) and percentage of interferon-γ CD8+ T cells responding to pool 16 (I-J). The percentage of interferon-γ CD4+ T cells of R3 (H519) responding to pool 15 (K-L) and percentage of interferon-γ CD8+ T cells responding to pool 16 (M-N). The remainder of the data is listed in table format (Table 2).

