Abstract
Purpose
To evaluate free-breathing chemical shift-encoded (CSE) magnetic resonance imaging (MRI) for quantification of hepatic proton density fat-fraction (PDFF). A secondary purpose was to evaluate hepatic R2* values measured using free-breathing quantitative CSE-MRI.
Materials and Methods
Fifty patients (mean age, 56 years) were prospectively recruited and underwent the following four acquisitions to measure PDFF and R2*; 1) conventional breath-hold CSE-MRI (BH-CSE); 2) respiratory-gated CSEMRI using respiratory bellows (BL-CSE); 3) respiratory-gated CSE-MRI using navigator echoes (NV-CSE); and 4) single voxel MR spectroscopy (MRS) as the reference standard for PDFF. Image quality was evaluated by two radiologists. MRI-PDFF measured from the three CSE-MRI methods were compared with MRS-PDFF using linear regression. The PDFF and R2* values were compared using two one-sided t-test to evaluate statistical equivalence.
Results
There was no significant difference in the image quality scores among the three CSE-MRI methods for either PDFF (P = 1.000) or R2* maps (P = 0.359–1.000). Correlation coefficients (95% confidence interval [CI]) for the PDFF comparisons were 0.98 (0.96–0.99) for BH-, 0.99 (0.97–0.99) for BL-, and 0.99 (0.98–0.99) for NV-CSE. The statistical equivalence test revealed that the mean difference in PDFF and R2* between any two of the three CSE-MRI methods was less than ±1 percentage point (pp) and ±5 s−1, respectively (P < 0.046).
Conclusion
Respiratory-gated CSE-MRI with respiratory bellows or navigator echo are feasible methods to quantify liver PDFF and R2* and are as valid as the standard breath-hold technique.
Hepatic steatosis is the abnormal accumulation of intracellular fat in hepatocytes, primarily in the form of triglycerides. Similar to alcoholic fatty liver disease, nonalcoholic fatty liver disease (NAFLD) can progress to inflammation and fibrosis, eventually resulting in cirrhosis.1 Fortunately, with intervention, isolated steatosis is reversible, and reduction in liver fat may diminish many of its associated risks. Weight loss, through exercise and diet, are central to improvement of obesity-related fatty liver disease.
An accurate and precise method to detect and monitor hepatic steatosis is required for the management of patients with NAFLD. Nontargeted percutaneous liver biopsy is the current reference standard to detect hepatic steatosis and definitely diagnose NAFLD.2,3 However, repeated biopsy is undesirable for longitudinal treatment monitoring.4,5 Hence, many imaging-based methods have been proposed for liver fat quantification, including ultrasound,6 computed tomography,7,8 and magnetic resonance imaging (MRI).9 Among these, confounder-corrected chemical shift-encoded (CSE) MRI using multiecho gradient echo MRI is perhaps the most promising noninvasive technique.10–12
An interesting and useful byproduct of confounder-corrected PDFF estimation is the simultaneous estimation of R2* maps of the liver. R2* is a well-established quantitative imaging biomarker of liver iron, and simultaneous estimation of PDFF and R2* provides a fat-corrected estimate of R2* that correlates closely with iron content in the liver.13 Quantification of liver iron is of interest because iron overload has been associated with NAFLD and the metabolic syndrome, and increases the risk of liver damage and the development of hepatocellular carcinoma.14,15
In order to obtain whole-liver coverage, current chemical shift-encoded MRI requires breath-holding for ∼20 seconds. Previous research has shown that patients with lung disease or congestive heart failure could not hold their breath as long as outpatients without lung/heart disease.16 A separate study demonstrated that patients with chronic lung disease could only hold their breath at end-expiration for a mean time of 10 seconds.17 The presence of motion artifacts can corrupt the ability of quantitative imaging reconstructions to provide accurate PDFF and R2* maps for the diagnosis and monitoring of NAFLD or liver iron deposition.
Respiratory-gated 3D T1-weighted MRI can be performed during free-breathing within reasonable scan times.18 Hence, the main purpose of this study was to evaluate free-breathing CSE-MRI for quantification of hepatic PDFF. A secondary purpose was to evaluate hepatic R2* values measured using free-breathing quantitative CSE-MRI.
Materials and Methods
Patients
This prospective study was performed after obtaining approval from our local Institutional Review Board. A total of 50 patients (mean [range] age of 56 [21–89] years; 20 men and 30 women) who were scheduled for routine clinical abdominal MRI were prospectively recruited after obtaining informed written consent. Exclusion criteria were: 1) patients with contraindications to MRI; 2) age <18 years. Indications for MRI were assessment of the liver fat (n = 19, 38%), evaluation of liver tumor (n = 5, 10%), cirrhosis with/without hepatocellular carcinoma (n = 12, 24%), hemochromatosis (n = 1, 2%), and others (n = 13, 26%).
MRI and Spectroscopy
All imaging was performed on a clinical 3T scanner (MR750, GE Healthcare, Waukesha, WI) using a 32-channel phased array body coil. The following four quantitative acquisitions were performed in all subjects: 1) conventional breath-hold CSE-MRI fat quantification method (BH-CSE); 2) respiratory-gated CSE-MRI with respiratory bellows (BL-CSE); 3) respiratory-gated CSE-MRI with navigator echoes (NV-CSE); and 4) single voxel multiecho T2-corrected STEAM spectroscopy (MRS) as the reference standard for PDFF.
The entire liver was imaged using a 3D volume oriented in the axial plane for all three CSE-MRI scans. Phase encoding for BL-CSE and NV-CSE was set left–right to reduce respiratory motion-related artifact in the liver, but in the anterior–posterior direction for BH-CSE to reduce scan time. Other acquisition parameters were the same for all three CSE-MRI acquisitions: TE = 1.2, 2.2, 3.2, 4.3, 5.3, 6.3 msec acquired in two shots of three echoes each, TR = 8.0 msec, flip angle = 3° to minimize T1-related bias,19 acquisition matrix = 256 × 144 × 32, field of view (FOV) = 40 × 32 × 26 cm, reconstructed slice thickness = 8 mm. An autocalibrated parallel imaging method was used to accelerate the acquisition with a factor of 2 for both phase and slice encoding direction in all three CSE-MRIs, resulting in an effective acceleration of ∼2.8.20 Scan time was 16 seconds for BHCSE, and ∼1 minute and 20 seconds for BL and NV, depending on the breathing pattern. BH-CSE was scanned at the end-expiration.
For respiratory gating with NV-CSE, the diaphragm position was updated every ∼200 msec by real-time processing of the navigator echo. The navigator consisted of a 2D pencil-beam excitation placed in the superior–inferior direction, centered on the right hemidiaphragm, using a 10° flip angle, 20 cm length, 2 cm width, and 256 readout points. When the diaphragm position, as measured by two consecutive navigator echoes, fell within a predetermined acceptance window, the data from the imaging block between the two navigator echoes were used for image reconstruction. Respiratory gating with BL-CSE was performed using the signal from the respiratory bellows where the maximum position value corresponded to end-expiration and the minimum position value corresponded to end-inspiration. The acceptance window was defined as the positions above the prescribed respiratory position based on a rolling histogram accumulated over a 10-second period that was updated every two TRs.
For reconstruction of PDFF maps, an online reconstruction algorithm was used to perform R2* correction,21 spectral modeling of fat,22 and correction for eddy currents 23 and noise related bias19 to create quantitative PDFF and R2* maps of the entire liver.
For MRS, a 2.0 × 2.0 × 2.0 cm3 voxel was placed in the posterior lobe of the liver, avoiding major blood vessels. MRS parameters included: TE = 10, 15, 20, 25, 30 msec to enable T2 correction, TR = 3500 msec to minimize T1 bias, one signal average, 2048 points, and a spectral width of ±2.5 kHz, acquired in a single 21-second breath-hold. Fat-quantification from MRS data was performed using an in-house fitting routine that accounts for the spectral complexity of the fat signal as well as MRS T2 decay.24
Quantitative and Qualitative Assessment
Image quality of PDFF and R2* maps was visually evaluated by consensus reading of two radiologists (U.M. and P.B.) with 13 and 8 years' experience in liver imaging, respectively. A 3-point scale was used for the image quality assessment; 3 = good, no difficulty to find a place for PDFF measurements in the liver; 2 = fair, some artifact in the liver that may interfere with finding the place of measurements; 1 = poor, severe artifacts in the liver.
In addition, a radiologist (U.M.) with 13 years' experience in liver imaging placed regions of interest (ROIs) in the anterior, posterior, and lateral lobes of the liver. A circular ROI with a size of ∼3.0 cm2 was placed in the liver on PDFF and R2* maps in the axial plane. During the ROI placement, special attention was paid to avoid partial volume effects at the liver edge, obvious artifacts, or contamination of large vessels. For each ROI location, a second ROI was then placed in an adjacent slice to average the measurement over two slices.
The PDFF measured in the posterior lobe was compared with that of MRS, which served as the reference standard (Fig. 1). ROIs in the posterior lobe were co-registered with the MRS voxel as best as possible. However, the placement of the ROI was manually adjusted if any obvious image artifacts such as ghosting were identified at that location.
Figure 1.
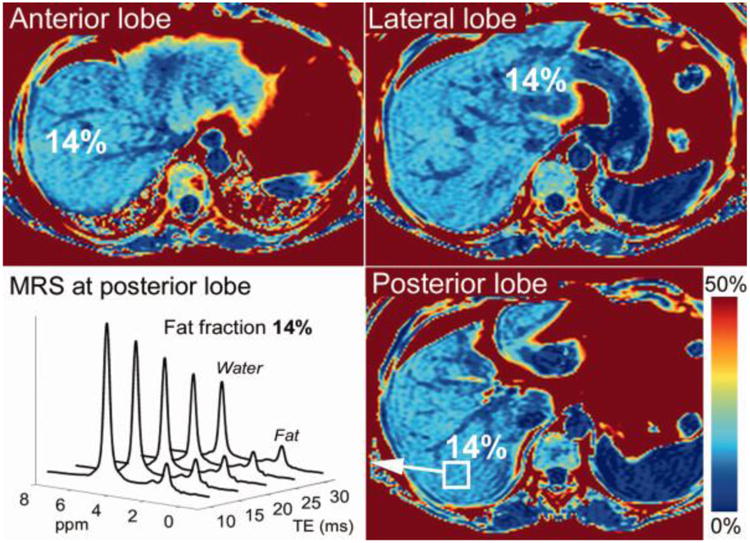
Example PDFF maps acquired using breath-held CSE-MRI and corresponding MR spectrum acquired in a patient with 14% PDFF. MRI-PDFF values measured in different lobes are shown. MR spectroscopy was performed in the posterior lobe and compared to the imaging results obtained from the ROI placed in the posterior lobe.
Statistical Analyses
The results for image quality assessment were analyzed using the McNemar test, to compare the three CSE-MRI methods.
MRI-PDFF from the PDFF maps in the posterior lobe was compared with MRS-PDFF using linear regression and correlation coefficients, including 95% confidence intervals (CIs). We also tested the ability of the three CSE-MRI methods to discriminate those patients with or without clinically significant steatosis, defined as a threshold PDFF value of 5.56% by MRS, as determined from the Dallas Heart Study.25 The sensitivity, specificity, and accuracy of the PDFF determined with CSE-MRI methods were calculated using this predefined threshold.
Correlation coefficients with 95% CIs in PDFF and R2* values between each pair of BH-, BL-, and NV-CSEs were also calculated. Intraindividual differences were plotted as Bland-Altman plots. To test the equivalence of the measured results from the 3 CSE-MRI methods, two one-sided paired t-tests were used, assuming clinically acceptable difference of ±1pp for PDFF and ±5 s−1 for R2* measurements. Here, pp refers to the “percent point” that is the unit for the arithmetic difference of two PDFF values expressed as percentages, eg, given two absolute PDFF values of 24% and 20%, the difference was shown as 4pp.
The correlation coefficients were interpreted as no correlation for 0–0.20, fair correlation for 0.21–0.40, moderate correlation for 0.41–0.70, substantial for 0.71–0.90, and strong correlation for 0.91–1.0. P < 0.05 was considered statistically significant. All statistical analyses were performed using MedCalc (MedCalc Software, Ostend, Belgium) and JMP software v. 10 (SAS Institute, Cary, NC).
Results
Image Quality of PDFF and R2* Maps
Figure 2 shows representative images of PDFF maps and R2* maps acquired with BH-, BL-, and NV-CSE. There were no significant differences in the image quality scores among the three CSE-MRI techniques for either PDFF (P = 1.000) or the R2* map (P = 0.359–1.000) (Fig. 3) For the PDFF maps, image quality was rated as good in 29 patients for BH-CSE, 31 patients for BL-CSE, and 30 patients for NV-CSE. The numbers of patients with PDFF maps rated as “poor” were 0, 3, and 1 for BH-, BL-, and NV-CSE, respectively. For the R2* maps, image quality was good in 21, 25, and 23 patients for BH-, BL-, and NVCSE, respectively. The number of patients with R2* maps rated as “poor” were 2, 8, and 10 for BH-, BL-, NV-CSE, respectively, indicating that motion artifacts were more prevalent on the R2* maps using free-breathing methods than on PDFF maps.
Figure 2.
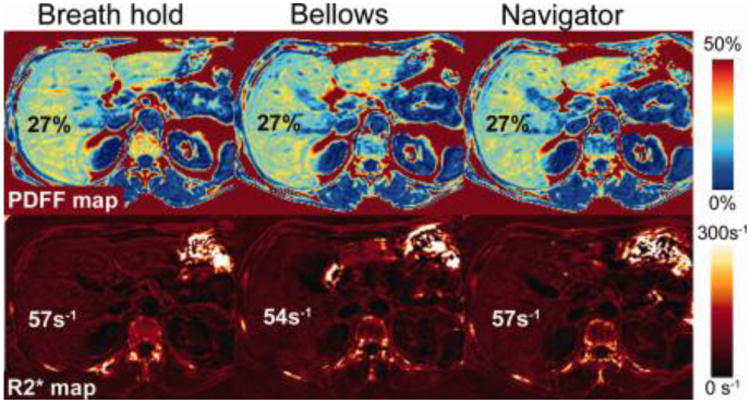
Example of the CSE-MRI PDFF maps (top) and R2* maps (bottom) acquired with breath-holding (left), respiratory-gating with respiratory bellows (center), and navigator echoes (right) in one subject. Very similar image quality and quantitative values were observed between the three methods. MRS-PDFF was 25%.
Figure 3.
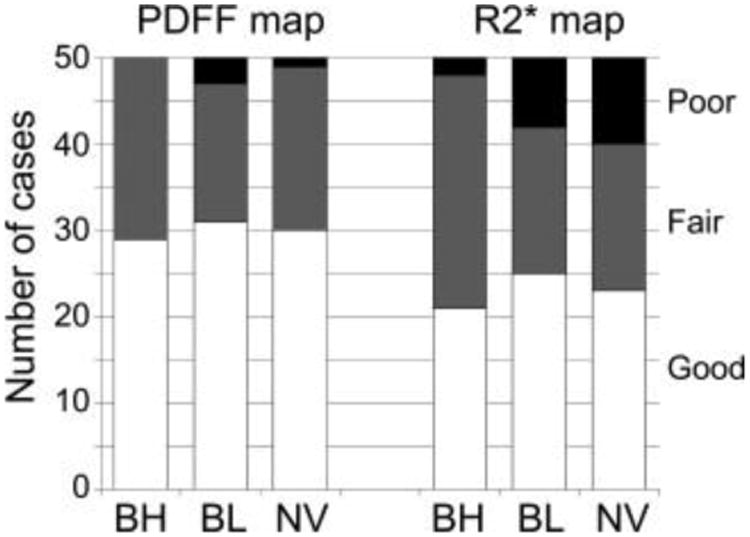
Summary of image quality assessment for PDFF and R2* maps. More than half of the PDFF maps were rated as “good image quality.” Although poor quality was seen more often in PDFF maps with respiratory-gated methods, the image quality scores were not significantly different (P = 1.000). Similarly, poor-quality R2* maps were more common with respiratory-gating methods than breath-hold methods, but the difference was not significant (P = 0.359–1.000).
PDFF of CSE-MRI Techniques Compared With MRS
The PDFF and R2* values in the 50 patients ranged from 1.6 to 34.6% (median, 4.1%) and 18.5 to 172.0 s−1 (median, 47.1 s−1), respectively, based on BH-CSE. The correlations between PDFF measurements using the three different CSE-MRI techniques and MRS were all strong (Fig. 4). Correlation coefficients were 0.980 (95% CI, 0.964–0.9898) for BH-, 0.986 (0.974–0.992) for BL-, and 0.989 (0.981–0.994) for NV-CSE. Using a PDFF value of 5.56% as measured by MRS as the threshold to diagnose clinically significant steatosis, 18 out of 50 patients were found to have clinically significant steatosis. The accuracy (95% CI) for identifying the patients with and without clinically significant steatosis were 46/50 (92% [81–98%]), 45/50 (90% [78–97%]), and 47/50 (94% [83–99%]) for BH-, BL-, and NV-CSE, respectively (Table 1).
Figure 4.
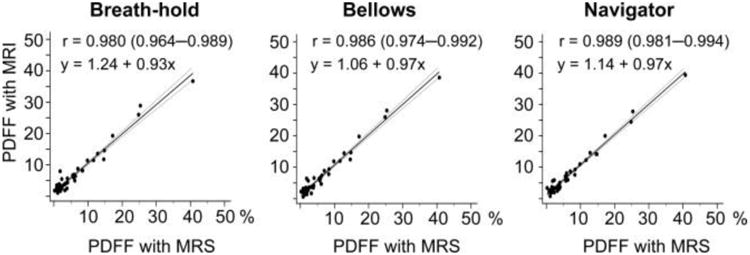
Excellent correlation and agreement was observed between PDFF measured using MRS and the three CSE-MRI methods. Correlation between fat fractions derived by BH-, BL-, and BV-CSE versus the reference standard MRS. Correlations were all strong with correlation coefficients (r) ranging from 0.986 to 0.980. The equations in the second row represent linear regression.
Table 1. Sensitivity, Specificity, and Accuracy of PDFF Determined With MRI in the Detection of Clinically Relevant Steatosis.
| Sensitivity [95% CI] | Specificity [95% CI] | Accuracy [95% CI] | |
|---|---|---|---|
| Breath-hold | 94 [73–100]% (17/18) | 91 [75–98]% (29/32) | 92 [81–98]% (46/50) |
| Bellows | 94 [73–100]% (17/18) | 90 [71–96]% (28/32) | 90 [78–97]% (45/50) |
| Navigator | 100 [81–100]% (18/18) | 91 [75–98]% (29/32) | 94 [83–99]% (47/50) |
Numbers in parentheses are numbers of patients. Sensitivity, specificity, and accuracy of MRI fat fraction for the detection of steatosis was calculated using a reference threshold fat fraction of 5.56%, based on MRS PDFF as the reference standard.
PDFF and R2* Values Compared Between Three CSE-MRI Techniques
The correlations in PDFF measured using the three CSEMRI techniques among themselves were also strong (correlation coefficient = 0.987–0.994 in anterior lobes, 0.992–0.994 in posterior lobes, and 0.978–0.989 in lateral lobes) (Table 2). The difference between any two of the three CSE-MRI techniques was significantly less than ±1pp in every lobe (−0.03–0.65pp, P < 0.046), suggesting equivalence in PDFF measured by the three CSE-MRI techniques. (Fig. 5; Table 2).
Table 2. Agreement of the Chemical Shift Method-Based PDFF Between Breath-Hold (BH) and Free Breathing Technique With Bellows (BL) or Navigator Echoes (NV).
| BH vs. BL | BL vs. NV | NV vs. BH | |
|---|---|---|---|
| Anterior lobe | |||
| Correlation coefficient [95% CI] | 0.994 [0.990–0.997] | 0.992 [0.986–0.996] | 0.987 [0.977–0.993] |
| Mean difference [90% CI] (pp) | −0.04 [−0.25–0.16] | 0.07 [−0.16–0.29] | −0.03 [−0.32–0.26] |
| P value for equivalent test | <0.001 | <0.001 | <0.001 |
| Posterior lobe | |||
| Correlation coefficient [95% CI] | 0.994 [0.988–0.996] | 0.994 [0.989–0.996] | 0.992 [0.985–0.995] |
| Mean difference [90% CI] (pp) | −0.02 [−0.23–0.20] | −0.07 [−0.28–0.13] | 0.08 [−0.14–0.34] |
| P value for equivalent test | <0.001 | <0.001 | <0.001 |
| Lateral lobe | |||
| Correlation coefficient [95% CI] | 0.989 [0.980–0.994] | 0.978 [0.961–0.988] | 0.978 [0.961–0.988] |
| Mean difference [90% CI] (pp) | −0.10 [−034–0.14] | −0.54 [−0.90–−0.21] | 0.65 [0.30–0.99] |
| P value for equivalent test | <0.001 | 0.019 | 0.046 |
Difference in PDFF is shown as mean (standard deviation) with a unit of percentage point (pp). Two one-sided paired t-test is used to show “equality” of the results from each sequence, ie: P < 0.05 suggests no more than 1pp difference in PDFF between the paired sequences. Confidence interval (CI) is shown as 90% CI, because one-sided t-test with alpha of 0.05 was done twice for both sides.
Figure 5.
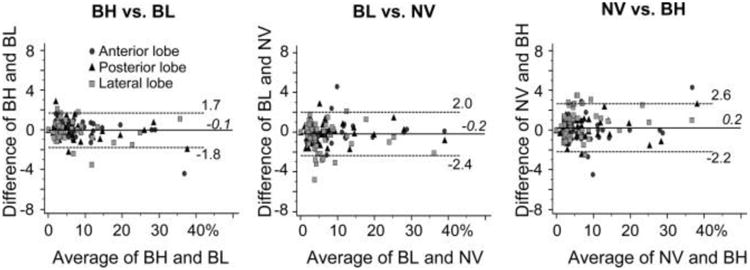
Bland-Altman plots showing the intraindividual difference in fat fraction between two of the three CSE-MRI techniques with either breath-hold (BH), respiratory-gating with bellows (BL), or navigator echoes (NV). Statistical equalities within ±1 point are shown in each liver lobe (P < 0.046)
The measured R2* values of the three CSE-MRI techniques also had strong correlations (Table 3). The mean difference between any two of the three R2* maps were within ±5 s−1 in all three liver lobes (P < 0.028, Fig. 6; Table 3).
Table 3.
Agreement of the R2* Measurements Between Breath-Hold (BH) and Free-Breathing Technique With Bellows (BL) or Navigator Echoes (NV).
| BH vs. BL | BL vs. NV | NV vs. BH | |
|---|---|---|---|
| Anterior lobe | |||
| Correlation coefficient [95% CI] | 0.841 [0.731–0.908] | 0.8376 [0.726–0.906] | 0.963 [0.935–0.979] |
| Mean difference [90% CI] (s−1) | −0.39 [−1.88–1.09] | −0.41 [−2.14–1.31] | 0.80 [−1.07–2.69] |
| P value for equivalent test | <0.001 | <0.001 | <0.001 |
| Posterior lobe | |||
| Correlation coefficient [95% CI] | 0.708 [0.526–0.828] | 0.621 [0.403–0.772] | 0.939 [0.893–0.965] |
| Mean difference [90% CI] (s−1) | 0.32 [−1.06–1.70] | −1.83 [−4.54–0.88] | 1.51 [−0.31–3.33] |
| P value for equivalent test | <0.001 | <0.028 | 0.001 |
| Lateral lobe | |||
| Correlation coefficient [95% CI] | 0.894 [0.816–0.940] | 0.868 [0.774–0.925] | 0.955 [0.922–0.974] |
| Mean difference [90% CI] (s−1) | 1.30 [–0.55–3.17] | −1.81 [−4.28–0.67] | 0.50 [−1.67–2.68] |
| P value for equivalent test | <0.001 | <0.018 | <0.001 |
Difference is shown as mean (standard deviation). Two one-sided paired t-test is used to show “equality” of the results from each sequence, ie: P < 0.05 suggests no more than 5 s−1 difference in R2* measurements between the paired sequences. Confidence interval (CI) is shown as 90% CI, because one-sided t-test with alpha of 0.05 was done twice for both sides.
Figure 6.
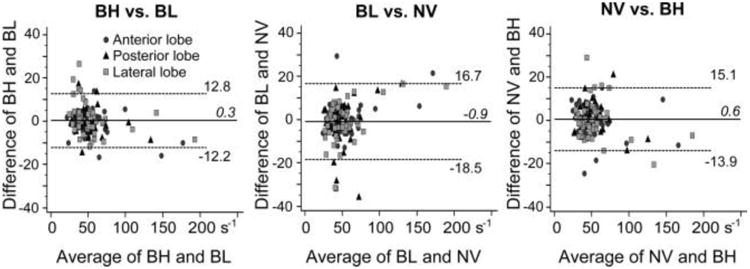
Bland-Altman plots showing the intraindividual difference in R2* values between two of the three CSE-MRI techniques with either breath-hold (BH), respiratory-gating with bellows (BL), or navigator echoes (NV). Statistical equalities within ±5 s−1 are shown in each liver lobe (P < 0.028).
Discussion
In this work we have demonstrated the feasibility of two free-breathing quantitative CSE-MRI methods using respiratory bellows or navigator echoes to quantify PDFF and R2* in the liver. Both respiratory-gated imaging methods and breath-held CSE-MRI had strong correlation and agreement with MRS to quantify PDFF, demonstrating that PDFF and R2* measurements using all three methods were equivalent. In our study, although R2* maps with BL- and NV-CSE suffered from some motion-related artifacts, no significant differences in image quality assessment were observed between breath-hold and respiratory-gated techniques.
Our results demonstrate the feasibility of using free-breathing quantitative CSE-MRI methods, with either navigator echoes or bellows for patients who are unable to hold their breath. The measurements with respiratory-gated CSEMRI were as valid as breath-hold CSE-MRI.
Although there was no statistical difference in image qualities between the three CSE-MRI acquisitions, poor image quality in PDFF maps was observed in three patients for BL-CSE and one patient for NV-CSE, whereas image quality was acceptable for all BH-CSE acquisitions. A possible explanation for the image degradation in these patients might be an irregular respiratory cycle and high respiratory rate. Irregular respiratory cycles may lead to inappropriate respiratory-gating using bellows or navigator echoes. Further, unexpectedly high respiration rates may cause a failure in update of respiratory monitoring. Another explanation could be operator error when placing the respiratory bellows or using the navigator prescription. In our results, no patients had severely degraded image quality for either BH- and NV-CSE, suggesting operator-related errors rather than patient-related factors. Considering the potential degradation of image quality, use of the respiratory-gated CSE-MRI method is recommended for patients who are not expected to perform good breath-holds such as children and others who cannot follow breath-holding commands. For patients capable of holding their breath, we still recommend the conventional breath-held scan to reduce total acquisition time and to minimize the risk of poor image quality.
Radial k-space sampling is an interesting alternative that some groups have demonstrated to minimize respiratory motion-related artifacts.26 This has been demonstrated during free breathing using no respiratory gating. While scanning with this method, patients are usually required to keep their respiration shallow to minimize total motion. Previous studies have shown the advantages of this method for free-breathing T1-weighted imaging without respiratory gating in patients who had not been able to hold their breath appropriately in a prior scan 27 and in pediatric patients under sedation.28 The image quality of the radial free-breathing approach, although promising, had worse image quality compared to acquisitions performed in subjects capable of excellent breath-holds.29 Quantitative CSE MRI methods using radial k-space sampling has not been reported, to the best of our knowledge.
There are several limitations of this study. One limitation is the lack of a direct validation of PDFF across the entire liver using biopsy. However, biopsy sampling across the entire liver is clearly not feasible and a single biopsy is unlikely to provide adequate representation of fat fraction of the entire liver because of poor sampling variability.4,5 For this study we used MRS, which is widely accepted as a noninvasive reference standard to quantify fat in the liver. For this reason pathological assessment is probably not necessary to validate the free-breathing imaging-based PDFF mapping techniques.9,30,31 Consensus reading, rather than independent reading, might be a concern of reader-based bias. However, the grading of image quality in this study was easy and straightforward in most cases, therefore we believe that the results of the consensus reading are objective and reproducible.
The subjects in this study were mostly outpatient adults, who typically do not fail breath-holding, resulting in equivalency of respiratory-gated CSE-MRI and breath-held CSI-MRI. However, it is tempting to speculate that the respiratory-gated CSE-MRI outperforms the breath-held technique in patients who frequently fail to hold their breath for the entire scan, such as children and seriously ill and/or old patients. Another potential limitation may be pencil beam navigator echoes used to monitor positions of the diaphragm. Since the navigator pencil beam excites signal in the liver, saturation effects are a potential concern. A small navigator flip angle (10°) was used to minimize possible saturation effects, and no such artifacts were observed. Further studies with navigator echoes acquired with varying flip angles to investigate this potential confounder are needed.
In conclusion, we have demonstrated the feasibility of two respiratory-gated CSE-MRI methods, using respiratory bellows or navigator echoes, to quantify PDFF in the liver. Our results demonstrate that measurement of PDFF and R2* using these sequences is as valid as conventional quantitative breath-hold CSE-MRI.
Acknowledgments
We thank all of the MRI technologists in the University of Wisconsin Department of Radiology for their contributions to this study. We also thank Nathan Artz, PhD, for support.
References
- 1.Angulo P, Keach JC, Batts KP, Lindor KD. Independent predictors of liver fibrosis in patients with nonalcoholic steatohepatitis. Hepatology. 1999;30:1356–1362. doi: 10.1002/hep.510300604. [DOI] [PubMed] [Google Scholar]
- 2.Brunt EM, Janney CG, Di Bisceglie AM, Neuschwander-Tetri BA, Bacon BR. Nonalcoholic steatohepatitis: a proposal for grading and staging the histological lesions. Am J Gastroenterol. 1999;94:2467–2474. doi: 10.1111/j.1572-0241.1999.01377.x. [DOI] [PubMed] [Google Scholar]
- 3.Kleiner DE, Brunt EM, Van Natta M, et al. Design and validation of a histological scoring system for nonalcoholic fatty liver disease. Hepatology. 2005;41:1313–1321. doi: 10.1002/hep.20701. [DOI] [PubMed] [Google Scholar]
- 4.Bedossa P, Dargere D, Paradis V. Sampling variability of liver fibrosis in chronic hepatitis C. Hepatology. 2003;38:1449–1457. doi: 10.1016/j.hep.2003.09.022. [DOI] [PubMed] [Google Scholar]
- 5.Ratziu V, Charlotte F, Heurtier A, et al. Sampling variability of liver biopsy in nonalcoholic fatty liver disease. Gastroenterology. 2005;128:1898–1906. doi: 10.1053/j.gastro.2005.03.084. [DOI] [PubMed] [Google Scholar]
- 6.Mishra P, Younossi ZM. Abdominal ultrasound for diagnosis of nonalcoholic fatty liver disease (NAFLD) Am J Gastroenterol. 2007;102:2716–2717. doi: 10.1111/j.1572-0241.2007.01520.x. [DOI] [PubMed] [Google Scholar]
- 7.Kodama Y, Ng CS, Wu TT, et al. Comparison of CT methods for determining the fat content of the liver. AJR Am J Roentgenol. 2007;188:1307–1312. doi: 10.2214/AJR.06.0992. [DOI] [PubMed] [Google Scholar]
- 8.Artz NS, Hines CD, Brunner ST, et al. Quantification of hepatic steatosis with dual-energy computed tomography: comparison with tissue reference standards and quantitative magnetic resonance imaging in the ob/ob mouse. Invest Radiol. 2012;47:603–610. doi: 10.1097/RLI.0b013e318261fad0. [DOI] [PMC free article] [PubMed] [Google Scholar]
- 9.Reeder SB, Cruite I, Hamilton G, Sirlin CB. Quantitative assessment of liver fat with magnetic resonance imaging and spectroscopy. J Magn Reson Imaging. 2011;34:729–749. doi: 10.1002/jmri.22580. [DOI] [PMC free article] [PubMed] [Google Scholar]
- 10.Reeder SB, Hu HH, Sirlin CB. Proton density fat-fraction: a standardized MR-based biomarker of tissue fat concentration. J Magn Reson Imaging. 2012;36:1011–1014. doi: 10.1002/jmri.23741. [DOI] [PMC free article] [PubMed] [Google Scholar]
- 11.Yokoo T, Bydder M, Hamilton G, et al. Nonalcoholic fatty liver disease: diagnostic and fat-grading accuracy of low-flip-angle multiecho gradient-recalled-echo MR imaging at 1.5 T. Radiology. 2009;251:67–76. doi: 10.1148/radiol.2511080666. [DOI] [PMC free article] [PubMed] [Google Scholar]
- 12.Reeder SB. Emerging quantitative magnetic resonance imaging biomarkers of hepatic steatosis. Hepatology. 2013;58:1877–1880. doi: 10.1002/hep.26543. [DOI] [PMC free article] [PubMed] [Google Scholar]
- 13.Hernando D, Kramer JH, Reeder SB. Multipeak fat-corrected complex R2* relaxometry: theory, optimization, and clinical validation. Magn Reson Med. 2013;70:1319–1331. doi: 10.1002/mrm.24593. [DOI] [PMC free article] [PubMed] [Google Scholar]
- 14.Dongiovanni P, Fracanzani AL, Fargion S, Valenti L. Iron in fatty liver and in the metabolic syndrome: a promising therapeutic target. J Hepatol. 2011;55:920–932. doi: 10.1016/j.jhep.2011.05.008. [DOI] [PubMed] [Google Scholar]
- 15.Kew MC. Hepatic iron overload and hepatocellular carcinoma. Liver Cancer. 2014;3:31–40. doi: 10.1159/000343856. [DOI] [PMC free article] [PubMed] [Google Scholar]
- 16.Marks B, Mitchell DG, Simelaro JP. Breath-holding in healthy and pulmonary-compromised populations: effects of hyperventilation and oxygen inspiration. J Magn Reson Imaging. 1997;7:595–597. doi: 10.1002/jmri.1880070323. [DOI] [PubMed] [Google Scholar]
- 17.Gay SB, Sistrom CL, Holder CA, Suratt PM. Breath-holding capability of adults. Implications for spiral computed tomography, fast-acquisition magnetic resonance imaging, and angiography. Invest Radiol. 1994;29:848–851. [PubMed] [Google Scholar]
- 18.Asbach P, Warmuth C, Stemmer A, et al. High spatial resolution T1-weighted MR imaging of liver and biliary tract during uptake phase of a hepatocyte-specific contrast medium. Invest Radiol. 2008;43:809–815. doi: 10.1097/RLI.0b013e318186242b. [DOI] [PubMed] [Google Scholar]
- 19.Liu CY, McKenzie CA, Yu H, Brittain JH, Reeder SB. Fat quantification with IDEAL gradient echo imaging: correction of bias from T(1) and noise. Magn Reson Med. 2007;58:354–364. doi: 10.1002/mrm.21301. [DOI] [PubMed] [Google Scholar]
- 20.Brau AC, Beatty PJ, Skare S, Bammer R. Comparison of reconstruction accuracy and efficiency among autocalibrating data-driven parallel imaging methods. Magn Reson Med. 2008;59:382–395. doi: 10.1002/mrm.21481. [DOI] [PMC free article] [PubMed] [Google Scholar]
- 21.Yu H, McKenzie CA, Shimakawa A, et al. Multiecho reconstruction for simultaneous water-fat decomposition and T2* estimation. J Magn Reson Imaging. 2007;26:1153–1161. doi: 10.1002/jmri.21090. [DOI] [PubMed] [Google Scholar]
- 22.Yu H, Shimakawa A, McKenzie CA, Brodsky E, Brittain JH, Reeder SB. Multiecho water-fat separation and simultaneous R2* estimation with multifrequency fat spectrum modeling. Magn Reson Med. 2008;60:1122–1134. doi: 10.1002/mrm.21737. [DOI] [PMC free article] [PubMed] [Google Scholar]
- 23.Yu H, Shimakawa A, Hines CD, et al. Combination of complex-based and magnitude-based multiecho water-fat separation for accurate quantification of fat-fraction. Magn Reson Med. 2011;66:199–206. doi: 10.1002/mrm.22840. [DOI] [PMC free article] [PubMed] [Google Scholar]
- 24.Hernando D, Artz NS, Hamilton G, Roldan-Alzate A, Reeder S. Fully automated processing of multi-echo spectroscopy data for liver fat quantification; Proc 22th Annual Meeting ISMRM; Milan. 2014; abstract 2884. [Google Scholar]
- 25.Szczepaniak LS, Nurenberg P, Leonard D, et al. Magnetic resonance spectroscopy to measure hepatic triglyceride content: prevalence of hepatic steatosis in the general population. Am J Physiol Endocrinol Metab. 2005;288:E462–468. doi: 10.1152/ajpendo.00064.2004. [DOI] [PubMed] [Google Scholar]
- 26.Chandarana H, Block TK, Rosenkrantz AB, et al. Free-breathing radial 3D fat-suppressed T1-weighted gradient echo sequence: a viable alternative for contrast-enhanced liver imaging in patients unable to suspend respiration. Invest Radiol. 2011;46:648–653. doi: 10.1097/RLI.0b013e31821eea45. [DOI] [PubMed] [Google Scholar]
- 27.Reiner CS, Neville AM, Nazeer HK, et al. Contrast-enhanced free-breathing 3D T1-weighted gradient-echo sequence for hepatobiliary MRI in patients with breath-holding difficulties. Eur Radiol. 2013;23:3087–3093. doi: 10.1007/s00330-013-2910-2. [DOI] [PubMed] [Google Scholar]
- 28.Chandarana H, Block KT, Winfeld MJ, et al. Free-breathing contrast-enhanced T1-weighted gradient-echo imaging with radial k-space sampling for paediatric abdominopelvic MRI. Eur Radiol. 2014;24:320–326. doi: 10.1007/s00330-013-3026-4. [DOI] [PubMed] [Google Scholar]
- 29.Azevedo RM, de Campos RO, Ramalho M, Heredia V, Dale BM, Semelka RC. Free-breathing 3D T1-weighted gradient-echo sequence with radial data sampling in abdominal MRI: preliminary observations. AJR Am J Roentgenol. 2011;197:650–657. doi: 10.2214/AJR.10.5881. [DOI] [PubMed] [Google Scholar]
- 30.Kuhn JP, Hernando D, Mensel B, et al. Quantitative chemical shift-encoded MRI is an accurate method to quantify hepatic steatosis. J Magn Reson Imaging. 2014;39:1494–1501. doi: 10.1002/jmri.24289. [DOI] [PMC free article] [PubMed] [Google Scholar]
- 31.Yokoo T, Shiehmorteza M, Hamilton G, et al. Estimation of hepatic proton-density fat fraction by using MR imaging at 3.0 T. Radiology. 2011;258:749–759. doi: 10.1148/radiol.10100659. [DOI] [PMC free article] [PubMed] [Google Scholar]


