

Abstract
Late gadolinium enhanced (LGE) cardiac magnetic resonance (CMR) imaging can detect the presence of myocardial infarction from ischemic cardiomyopathies (ICM). However, it is more challenging to detect diffuse myocardial fibrosis from non-ischemic cardiomyopathy (NICM) with this technique due to more subtle and heterogeneous enhancement of the myocardium. This study investigates whether high-resolution LGE CMR can detect age-related myocardial fibrosis using quantitative texture analysis with histological validation. LGE CMR of twenty-four rat hearts (twelve 6-week-old and twelve 2-year-old) was performed using a 7 Tesla MRI scanner. Picrosirius red was used as the histopathology reference for collagen staining. Fibrosis in the myocardium was quantified with standard deviation (SD) threshold methods from the LGE CMR images and 3D contrast texture maps that were computed from grey level co-occurrence matrix of the CMR images. There was a significant increase of collagen fibers in the aged compared to the young rat histology slices (2.60±0.27 %LV vs. 1.24±0.29 %LV, p<0.01). Both LGE CMR and texture images showed a significant increase of myocardial fibrosis in the elderly compared to the young rats. Fibrosis in the LGE CMR images correlated strongly with histology with the 3 SD threshold (r=0.84, y=0.99x+0.00). Similarly, fibrosis in the contrast texture maps correlated with the histology using the 4 SD threshold (r=0.89, y=1.01x+0.00). High resolution ex-vivo LGE CMR can detect the presence of diffuse fibrosis that naturally developed in elderly rat hearts. Our results suggest that texture analysis may improve the assessment of myocardial fibrosis in LGE CMR images.
Keywords: diffuse myocardial fibrosis, gadolinium, magnetic resonance imaging, texture analysis, computer quantification, aging
Graphical Abstract
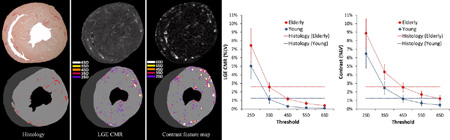
This study assessed age-related diffuse myocardial fibrosis in two different age rat groups using quantitative texture analysis of high resolution ex-vivo late gadolinium enhancement (LGE) cardiac magnetic resonance (CMR) imaging. Results were compared with histological references. There was a significant increase of collagen fibers (%LV fibrosis) in the LGE CMR and contrast texture images of the elderly compared to the young group. Our results suggest that texture analysis may improve the assessment of subtle age-related myocardial fibrosis from LGE CMR images with a higher separability and increased SNR.
INTRODUCTION
The presence of myocardial fibrosis is associated with the development of cardiomyopathies [1] and has been shown to increase with age [2–4]. Myocardial fibrosis in nonischemic cardiomyopathy (NICM) may alter the morphology and function of the myocardium and lead to adverse cardiac outcomes [5–7]. Non-invasive imaging methods are therefore desirable for the detection and quantification of fibrosis in the myocardium and to stratify the risk of sudden cardiac events.
Currently, myocardial infarction or scar from ischemic cardiomyopathies (ICM) is identified by late gadolinium enhancement (LGE) cardiac magnetic resonance (CMR) imaging [8]. The combination of the contrast agent kinetics and the jeopardized cellular structure of the myocardium result in signal enhancement in the diseased area. Ex-vivo imaging of myocardial infarction can be performed at a near-cellular level and closely match with histologic myocardial fibrosis [9]. Myocardial infarctions are focal, and are seen as concentrated patches of enhancement in LGE CMR images. However in the presence of diffuse fibrosis, there is an intermingling of healthy and diseased myocardial cells accompanied by an increased extracellular space, which results in subtle non-uniform regions of enhancement across the myocardium in LGE CMR images. It has therefore been challenging to quantify the level of fibrosis in the myocardium from NICM using conventional approaches. For example, clinicians relied on the visual appearance of enhanced regions in LGE CMR images to characterize diffuse myocardial fibrosis, using qualitative descriptions such as: “patchy foci, heterogeneous, multifocal, and non-specific” [1]. Standard quantification methods, such as signal enhancement thresholding, used to detect focal myocardial scars in ICM, may not work for diffuse fibrosis in LGE CMR images [10–13]. Other quantification methods of diffuse fibrosis relied on the non-focal aspect of diffuse fibrosis [14]. More recently, descriptors based on acquisition parameters such as the pre- or post-contrast T1 and extracellular volume fraction (ECV) imaging techniques have emerged to measure diffuse myocardial fibrosis from various etiologies [10–13, 15–20]. There are an increasing number of studies assessing the reliability of these methods to detect diffuse myocardial fibrosis. The advantage of these methods is the absolute scale to measure these myocardial tissue properties. CMR diffusion tensor imaging (DTI) has been explored in patients with heart failure to characterize the myocardial microstructure in the presence of diffuse fibrosis [21]. Alternatively, T2 measurements have been successful in detecting diffuse myocardial fibrosis [22]. However, in former studies when the acquisition methods are not available, an image based analysis method to identify diffuse myocardial fibrosis could be beneficial.
Quantitative texture measures from CMR image have previously been applied to characterize the structural complexity of the myocardium that changes in the presence of disease. Eftestol et al. [23] found texture analysis in the infarct area combined with LV ejection fraction measurement could discriminate patients at higher risks of developing arrhythmia. Kotu et al. [24] studied how texture analysis could segment myocardium infarct region from remote myocardium and as well distinguish higher risk patients with implantable cardioverter defibrillator for the treatment of ischemic cardiomyopathies. More recently, Thornhill et al. [25] applied texture analysis to LGE CMR of patients with hypertrophic cardiomyopathy and found distinct texture features could discriminate those patients from healthy volunteers, even without the presence of significant hyper-enhancement in the myocardium. However, all these studies lacked histological validation.
The specific aim of this study was to determine whether quantitative texture analysis of LGE CMR images can detect subtle myocardial fibrosis.We hypothesize that computational texture analysis of the LGE CMR images may improve the assessment of more subtle and heterogeneous myocardial fibrosis and may discriminate elderly from young hearts.
METHODS
Animal Model
The animal study was approved by the National Institute of Health Animal Care and Use Committee. Twelve 2-year-old F344 Brown Norway male rat (National Institute of Aging, Bethesda, MD) and twelve 6-week-old Sprague Dawley male rats Charles Rivers Laboratories Inc., Wilmington, MA) were used.
Once the rats were anesthetized with 1–5% isoflurane mixed with oxygen, Gadolinium diethylenetriamine pentaacetic acid (Gd-DTPA, Magnevist, Schering Berlin, Germany) contrast agent at a concentration of 0.6 mL/kg was administered intravenously. The rats were given potassium chloride 10 minutes after administration of the contrast agent to freeze the in-vivo myocardial distribution of gadolinium for subsequent ex-vivo imaging. Immediately, excised hearts were immersed in fomblin perfluoro-polyether (Solvay Solexis, West Deptford, NJ) for CMR imaging. Hearts were then fixed in a 10% Formalin solution for histology processing after the image acquisition.
Image Acquisition
A 7T Vertical Bruker BioSpin small animal scanner (Billerica, MA) was used to obtain the images. A 3D gradient echo image acquisition sequence was performed with a repetition time of 20 ms, an echo time of 3.5 ms, and a flip angle of 30°. The field of view was 1.9–2.0×1.9×1.9cm3, the matrix size was 256–320×256×256 with a pixel bandwidth of 325Hz. The resulting voxel size was ~75×75×75 µm3. For each heart, five to seven 3D images were acquired consecutively over a 3-hour period. Each image acquisition lasted 20 minutes without averaging. Three volumes were manually selected, based on their similarity with each other, and averaged to improve the signal to noise ratio for each individual heart.
Histology
Upon completion of the scanning process, all the fixed hearts were embedded in paraffin and cut in 5 µm sections in the short-axis (SA) plane from the apex to the base. Picrosirius red stain, which binds specifically to collagen fibrils (type I, II and III) [26], was used to evaluate fibrosis content in the myocardium. Slices were then digitized with a Leica MZFLIII microscope (Wetzlar, Germany) with a 10× objective lens.
Image Analysis
Histology Images
Histological image processing was done with a custom software developed with the Interactive Data Language (IDL, Exelis Visual Information Solutions, Boulder, CO). The slice with the most collagen, assessed visually, was chosen for myocardial fibrosis quantification. Quantification of collagen content from the histology images was performed with a multichannel thresholding method based on the color and illumination contents similar to Yabusaki et al. [27]. The histology image slices were first converted from red-green-blue (RGB) to huesaturation-value (HSV) channels [28]. In the HSV color space, the H channel is defined by a color wheel with primary colors associated to specific angles around the center: 0° = red, 120° = green, 240° = blue (Figure-1). The S channel describes the amount of white in a color given by the H. As S increases, the distance to the center of the wheel increases and less amount of white gets mixed with the given color. The V channel specifies the shading of a color in H, with a completely black color associated to 0.
Figure-1.

Schematic representation of the color transformation from the RGB to the HSV space.
The conversion of the color space from RGB to HSV is described in Foley et al. [28]. The RGB values are normalized between 0 and 1, and the values of H are cycling from 0° to 360°. The Foley et al. equations are:
| (1) |
The V channel contains the illumination component of an image and depicts the lighting variation across such an image. Therefore, the information contained in this channel is discarded from our segmentation process. The myocardium region of interest (ROI) segmentation was performed by removal of the white shades in the background. Since the S channel contains the amount of white in a color, a threshold of 0.2 was applied to this channel to eliminate the background pixels. To further isolate red stained collagen fibers in the myocardial ROI, two thresholds, one close to 0° and another close to 360 °, were used to pick up the color red in the H channel, and a threshold close to 1 was used for the S channel. The results of fibrosis quantification were expressed as the percent area of the left-ventricle (%LV) myocardium.
LGE CMR Images
Analysis of the LGE CMR images was performed with custom computer software developed in IDL with a graphical user interface for volume re-slicing and segmentation tasks. LGE CMR images were resliced in the SA direction from each 3D data volume to match the histological sections. The quantification of fibrosis content was performed by first manually tracing the LV endocardial and epicardial contour ROI on the re-sliced LGE CMR images, excluding epicardial fat and ventricular cavity blood pool. To determine the best thresholds for quantifying the amount of fibrosis within the myocardial ROI, a remote region was manually selected to estimate the mean and standard deviation (SD) of the normal myocardial signal intensity (SI). Semi-automated 2 to 6 SD thresholds above the mean SI were then applied to measure the distribution of bright pixel enhancement in the myocardial ROI and evaluate the amount of diffuse fibrosis in the LGE CMR and texture images quantitatively. The results were compared to the myocardial collagen content measured from the reference histology images to determine the best threshold for CMR and texture image quantification.
Texture Analysis
Three dimensional texture analysis was performed in the LGE CMR image volume using the grey level co-occurrence matrix (GLCM) from which texture features were derived following Haralick’s method [29]. Contrast texture maps of the myocardium were created by computing the GLCM for each pixel (Figure-2). Quantization of the signal intensity was performed to standardize the comparison of intensity distribution and to improve the computational time. Signal intensity histogram was computed from the myocardial ROI, in which the most prominent distribution was detected as the remote myocardium since it has the largest region in the image. Quantization was then performed by alignment of the peak of the remote myocardial distribution among all rat hearts.
Figure-2.

3D pixel-wise texture map is obtained by computing the GLCM for every pixel in the myocardial region. To derive the GLCM with a spatial distance of one, neighboring pixel pairs in thirteen directions (red arrow) are compared per pixel. The probability of occurrence of signal intensity pairs in a 3×3×3 neighbor region surrounding a position was computed to construct the GLCM for each direction. The final texture value for each pixel is obtained by averaging the contrast feature computed from the thirteen GLCMs.
Next, the 3D GLCM were computed in the image volume based on the extension of the 2D GLCM as defined by Haralick [29] to evaluate the probability of signal intensity occurrence among neighboring pixel pairs. For an image I with signal intensity range [0, N], a set of GLCM of size N × N are derived for every pixel in the myocardial ROI to account for all possible signal intensity relationship among the adjacent neighbors. The GLCM initially contains the number of occurrence of pixel pairs with intensity values (i,j) within a given distance and orientation, defined by a displacement vector (Δx,Δy,Δz), from each other. The L1-norm is used to avoid signal intensity interpolation and a distance of 1 is used in all directions. The GLCM is, in this state, similar to a histogram of occurrence of intensity pairs (i,j) for all neighboring pixels within the myocardial ROI, with neighbors defined by the displacement vector. The final GLCM is obtained after normalization of the matrix to obtain the probability of occurrences Pi,j for a given pixel I at location (x,y):
| (2) |
Since the intensity values in paired neighboring pixels are interchangeable, i.e. (i,j) is considered the same as the intensity pair (j,i), only half of the twenty-six connected pixel neighbors need to be considered and the GLCM is made symmetrical. Therefore, a total of thirteen directions are computed, defined by four in-plane displacement (ΔxΔyΔz) = [(1,0,0), (1,1,0), (0,1,0), (−1,1,0)] and that correspond to the orientations 0°, 45°,90° and 135° from the considered position, and as well by the out-of-plane displacements (ΔxΔyΔz) = [(0,0,1), (1,0,1), (1,1,1), (0,1,1), (−1,1,1), (−1,0,1),(−1,-1,1), (0,-1,1), (1,-1,1)]. After obtaining the thirteen GLCM, the standard contrast texture feature [29], was computed in each direction and then averaged for all pixels in the myocardial ROI:
| (3) |
As in the LGE CMR image, myocardial fibrosis content in the contrast texture enhanced images was quantified with 2 to 6 SD thresholds in the same myocardial ROIs and compared to the histology reference.
Statistical Analysis
Results are presented as mean ± SD of the %LV in the myocardial ROI for group comparisons. The correspondence of collagen content estimation between histology slices versus LGE CMR and contrast texture images were performed with linear regression and Bland-Altman analysis. A two-tailed student t-test was used to determine if significant differences were present between different quantification techniques and the two age groups (p<0.05).
RESULTS
The elderly rats weighed 570±56 grams and were significantly heavier than the young rats at 291±76 grams (p<0.01).
Histology Analysis
Histology images showed an increase of collagen fibers in the aged hearts compared to the younger ones (Figure-3). The fibrous collagen distribution was not typical of ischemic cardiomyopathies [30]. Rather, the presence of interstitial fibrosis was evident in the aging hearts where an increase of collagen fibers was observed in sporadic locations, intermingled with healthy cardiomyocytes (Figure-4). Perivascular fibrosis was also apparent in the myocardium where collagen fibers surrounded the intramyocardial blood vessels (Figure-4). Quantification of the red-stained collagen fibers in histology images was possible with the HSV segmentation method (Figure-5).
Figure-3.

Picrosirius red-stained histology images show an increase of collagen content (stained red) in the elderly rat (left) compared to the young rat (right).
Figure-4.

Magnification of a picrosirius red-stained histology slice from an elderly rat heart showing (a) interstitial and (b) perivascular fibrosis. Diffuse interstitial fibrosis appears as an intermingling of pink-salmon color healthy cardiomyocytes and red-stained collagen fibers.
Figure-5.

Segmentation of the histology slices was done after transforming the RGB channels into HSV color space. The illuminance variation of the image can be clearly seen in the V channel of the decomposed HSV images. The magnified picrosirius red-stained histology image shows our segmentation can depict detailed red-color collagen content in the myocardium.
Overall, the red-stained collagen structures occupied approximately 2.60±0.27% LV in the elderly rat hearts, compared to 1.24±0.29% LV in the young rats (p<0.01). These were in a similar range of myocardial collagen content as quantified in previous picrosirius studies [31–33].
LGE CMR and Texture Image Analysis
There was a general agreement of signal enhancement in the matched SA slices of the LGE CMR images that visually corresponded well with location of red-stained collagen fibers in the histology slices for both the elderly and the young rat heats (Figure-6 and Figure-7 respectively). Figure-8 shows an example of myocardial fibrosis quantification on the LGE CMR, and the contrast texture images for one of the elderly rats. Different SI thresholds are compared to the histology segmentation. There is a correspondence but not complete correspondence of pixel enhancement between the LGE CMR and the contrast texture images as quantified by different thresholds (Figure-8).
Figure-6.

The appearance of collagen fibers in an elderly rat histology slices (top) matches well with the signal enhanced regions in the LGE CMR images (middle) and the corresponding contrast texture images (bottom). Regions of interstitial diffuse myocardial fibrosis identified in histology (white arrows) are enhanced in the matched LGE CMR and contrast texture images. Perivascular myocardial fibrosis in histology (black arrows) was also enhanced in LGE CMR and in the contrast texture image. The corresponding contrast texture images show a further increased signal enhancement in locations of myocardial fibrosis.
Figure-7.

The appearance of collagen fibers in a young rat histology slices (top) also matches closely with the signal enhancement in the LGE CMR images (middle) and contrast texture images (bottom). However, there are fewer amounts of collagen fibers compared to the elderly rat in Figure-6, and they appeared primarily in the perivascular regions (black arrows).
Figure-8.

Example of myocardial fibrosis quantification in histology (left), segmented LGE CMR (middle), and segmented contrast texture (right) images. The bottom row shows there is a high, but not complete, correspondence of signal enhanced pixels between CMR and the contrast texture images as quantified by different SD thresholds. There was a slight over segmentation in the lumen area of the LGE CMR and the contrast texture images when compared to histology due to residual contrast in the lumen.
For the LGE CMR images, our comparison showed the 3 SD threshold produced the closest estimation of fibrosis content to that obtained with histology quantification and was therefore retained for subsequent comparisons (Figure-9). For the elderly group, collagen content was estimated at 2.56±0.52%LV in the LGE CMR images compared to 2.60±0.27% LV fibrosis from the histology (p=NS). In the young rat hearts, fibrosis was estimated at 1.11±0.47% LV compared to 1.24±0.29% LV obtained from the histology (p=NS). With the 3 SD method, linear regression analysis showed a good correlation between LGE CMR and histology quantification for the group overall (r=0.84, y=0.99+0.00, Figure-10).
Figure-9.

Myocardial collagen content in the elderly versus young rats as estimated by various standard deviation (SD) thresholds from LGE CMR (left) and contrast texture (right) images. Dashed lines show collagen estimation from the matched histology references. The optimal threshold values for LGE CMR were obtained with the 3 SD threshold and with the 4 SD for the contrast texture images.
Figure-10.

Collagen estimation with the 3 SD threshold for LGE CMR images (left) and the 4 SD threshold for the contrast texture images (right) compared to the histology quantification. Linear regression and Bland-Altman analysis showed excellent correlation without significant bias for both LGE CMR and contrast texture images. Dashed lines indicate mean ± two standard deviation in the Bland-Altman analysis.
For the texture images, our data showed the 4 SD threshold applied to the contrast texture feature images resulted in fibrosis estimation that was closest to the histology quantification (Figure-9). In the elderly rat hearts, collagen content was estimated at 2.60±0.54% LV in the contrast feature images compared to 2.60±0.27% LV fibrosis from the histology (p=NS). For the young rat group, fibrosis estimation in the contrast texture feature images was 1.17±0.42% LV compared to 1.24±0.29% LV from the histology (p=NS). For the group overall, linear regression analysis showed a good correlation of fibrosis quantification from the contrast texture feature images compared to the histology reference (r=0.89, y=1.01x+0.00, Figure-10).
Table-1 summarizes the percent difference of fibrosis estimation between elderly and young rat hearts using different threshold levels. There is a larger difference and separation between the two groups using the contrast texture maps compared to the LGE CMR images with the 3 SD to 6 SD thresholds. Furthermore, there was a significant increase in SNR (21.9%, p<0.001) measured from the bright fibrotic pixels in the contrast texture maps compared to the LGE CMR images (SNR=10.76 and 8.83 respectively).
Table-1.
The discrimination between the elderly and the young rat hearts is improved with the contrast texture maps quantification using 3SD to 6SD thresholds when compared to the LGE CMR images. The amount of myocardial fibrosis estimation is expressed in %LV.
| Contrast Texture | (% LV) | 2SD | 3SD | 4SD | 5SD | 6SD |
| Elderly | 8.81% | 4.37% | 2.60% | 1.76% | 1.30% | |
| Young | 6.46% | 2.45% | 1.17% | 0.67% | 0.46% | |
| Difference | 2.35% | 1.92% | 1.43% | 1.10% | 0.84% | |
| LGE CMR | (% LV) | 2SD | 3SD | 4SD | 5SD | 6SD |
| Elderly | 7.43% | 2.56% | 1.16% | 0.64% | 0.39% | |
| Young | 5.00% | 1.11% | 0.30% | 0.13% | 0.07% | |
| Difference | 2.43% | 1.45% | 0.86% | 0.51% | 0.32% | |
DISCUSSION
This study demonstrated that high resolution ex-vivo LGE CMR can detect the presence of age-related interstitial and perivascular myocardial fibrosis in hearts with differing level of collagen content. A significant increase of myocardial fibrosis was found in the elderly group compared to the young rats as shown in our CMR and histology data. Our results show that the signal enhanced regions identified on the LGE CMR images correspond to the fibrosis on the histology. Likewise, the texture analysis also correlated well with fibrosis by histology.
Previous studies have shown that gadolinium contrast agent can delineate myocardial infarction and fibrosis at a near cellular level [9]. We extend this finding to less focal and more subtle, myocardial fibrosis present in the elderly rat hearts. Diffuse fibrosis present in the heart, from various etiologies, has been identified with CMR T1 mapping, ECV, and DTI methods [10, 13, 15–21, 34]. Moreover the increase of collagen content in the aging heart has been studied in animal models [3, 34–37] and patients [3, 12, 38] using these emerging CMR imaging techniques. It was found that T1, ECV, and various diffusion parameters in the myocardium have a strong association with age. An elderly animal model was therefore chosen in our study to examine a more subtle increase of diffuse fibrosis in the myocardium. Using high resolution ex-vivo LGE CMR imaging with histopathological correlation, our study indicates that there is a significant increase of patchy interstitial and perivascular fibrosis present in the aged hearts. The increase of diffuse myocardial fibrosis in the older rat hearts compared to the young could be influenced by different factors such as increased sedentary periods, lower metabolism or obesity, which can potentially be attributed to the process of aging. It was important to this study that the increase of fibrosis in our animal model developed naturally without direct intervention. This is consistent with previous studies that link higher amount of fibrosis with aging in animal models. The elderly animal model allowed us to study texture analysis in the presence of more dispersed fibrosis, which is currently challenging to assess with LGE CMR images.
The location of infiltrative collagen fibers as stained by the picrosirius red in the histology references corresponded well with the location of enhanced SI in the myocardium on the LGE CMR images qualitatively. We further showed that the estimation of collagen content in the histology images, as measured by the HSV method, correlated well with the detection and location of myocardial fibrosis on the LGE CMR images. This correlation reflects the accumulation of gadolinium contrast agent in the extracellular matrix, which in turn indicates an increased presence of collagen fibers. As Schelbert et al. mentioned in the previous study [9], Gd-DTPA accumulates in regions of slight collagen accumulation, a feature critical when imaging particular non-ischemic cardiomyopathies where there is absence of focal alteration to the cellular structure of the myocardium. Our study further confirms that subtle and dispersed accumulation of collagen fibers in the myocardium can be detected with high resolution LGE CMR imaging.
Depending on different clinical and imaging applications, quantification of myocardial fibrosis in LGE CMR images has been performed with SI thresholding that differs among studies [39–42]. We presented a comparative assessment for the amount of fibrosis using various levels of threshold and showed all thresholds achieved a high accuracy separating the two groups. However, there was an increased separation of the two age groups in the contrast texture image quantification compared to the LGE CMR images for all threshold comparison (Figure-9). With a lower threshold setting such as the 2 SD method, the LGE CMR and contrast texture images had a tendency to overestimate fibrosis content as compared to the histology (Figure-9). Our results showed the 3 SD threshold applied to the LGE CMR images gave the closest estimation of collagen content to what was estimated in the histology images. These results were consistent with previous findings by Mikami et al.[43] and as well by Moravsky et al. [39] that compared various levels of threshold applied to LGE CMR images with the presence of diffuse fibrosis in hypertrophic cardiomyopathy patients. Moravsky et al. stated that LGE CMR at higher SDs represents the denser fibrosis that probably consists of replacement fibrosis but also the denser interstitial fibrosis.
For the contrast texture feature images, our results show that the 4 SD method resulted in the best correlation with histology. We infer this increase of threshold value is due to the effectiveness of the GLCM computation to improve differential SI enhancement patterns among neighboring pixels. The contrast texture feature measures textural complexity in a given region by weighing the difference of signal intensity amongst neighbor pixels. Such texture extraction and pattern enhancement process can encapsulate more diffuse pixels with bright and dark neighbors next to each other than just the amount of bright pixels in the image. It not only enhances pixel locations where confluent gadolinium enhancement is present, but also the immediate neighboring regions where pixels are more subtly enhanced. Qualitative analysis of the LGE CMR and the contrast texture images (Figure-6) shows a strong association of enhanced pixels with the location of red-stained collagen fibers in the histology slices. The signal and contrast level of these bright pixel enhancement regions are markedly enhanced in the contrast texture image which have a significantly higher SNR compared to the LGE images. Texture measures can thus be exploited as indicators for the presence of a more complex collagen fibers distribution as depicted by both diffuse and confluent gadolinium enhancement patterns in the myocardium. Furthermore, since texture analysis computes local pixel-to-pixel signal variation, it is less prone to the influence of image artifacts caused by radiofrequency field inhomogeneity.
There are advantages to using LGE CMR images to detect myocardial fibrosis. The significance of signal enhancement found in the myocardium from this modality has been extensively validated and reproduced in many studies including multi-center studies. Acquisition protocols have been extensively tested and precise guidelines have been developed [44]. LGE CMR images are clinically used to diagnose ischemic cardiomyopathies and have been shown to exhibit identifiable enhancement patterns in non-ischemic cardiomyopathies [45].We have demonstrated that both LGE CMR and contrast texture images could successfully discriminate the elderly from the young rat hearts. The subtle but visible increase of red-stained collagen fibers was assessed visually as well as quantitatively in histology images. This increase of fibrosis content was also quantified in LGE CMR images and texture images. Quantification of diffuse fibrosis in LGE CMR images can be challenging in a clinical setting due to an inherent lower spatial resolution. Texture analysis may thus improve the detection of more complex signal enhancement patterns and signal intensity differences of neighboring pixels in the presence of diffuse fibrosis. Although we present texture analysis as a means to quantify myocardial fibrosis on LGE CMR images, this analysis method may also be applied to other types of CMR images, such as T1 or ECV maps, for tissue characterization and classification.
There are limitations to the current study. Picrosirius red staining allowed the delineation of collagen fibers more closely than would be possible with LGE CMR imaging technique. The lumen was not red stained in the histological images and thus discounted from the HSV segmentation. However the vessel lumen was enhanced by the contrast agent and accounted for false positive fibrosis content in LGE CMR images. Since the amount of diffuse fibrosis in the myocardium is much smaller than focal scars as in myocardium infarctions, these intrinsic differences are not to be overlooked when comparing diffuse fibrosis between different imaging modalities. This might account for part of the overestimation of the collagen content in LGE CMR and texture images compared to the histological reference. However, this overestimation is consistent throughout all cases in this study and does not impair the enhancement of diffuse fibrosis with texture analysis.
Partial voluming is a well-documented effect that is unavoidable and affects all quantitative analysis of diffuse fibrosis in LGE CMR images due to relatively subtle regional voxel enhancement [9, 46]. The morphological changes of myocardial tissue during histological processing may account for some of the anatomical discrepancy and misalignment between LGE CMR images and the histological slices. In spite of these discrepancies there was visual agreement in the general myocardial structure in LGE CMR images and in the stained histology slices.
Finally, the presence of collagen fibers was assessed with picrosirius red stain under bright light in our study. Polarized light could potentially provide more details about the structures and compositions of the diffuse myocardial fibrosis by exploiting the birefringence property of the stained collagen [47, 48].
The analysis of texture features in this study was performed with the contrast texture feature, which was extracted from the GLCM as computed from the LGE CMR images. This feature alone offered the best visual and quantitative assessment of diffuse myocardial fibrosis, compared to other GLCM features. Other texture features and classification methods may be explored in future studies to improve the detection of complex intensity patterns associated with diffuse myocardial fibrosis in LGE CMR images under different image resolution.
CONCLUSIONS
We demonstrated that high resolution LGE CMR images can detect the presence of subtle age-related myocardial fibrosis in ex-vivo rat hearts of different aged groups. Texture feature analysis of those images may add additional value to the assessment of fibrosis in the myocardium. A significant increase of myocardial fibrosis was found in the elderly group compared to the young rats in this study. Our results show both signal intensity and contrast texture analysis of the LGE CMR images can separate the two age groups of rats with great accuracy, although the SNR was increased for the contrast texture maps. The quantification of fibrosis on both LGE CMR and histology data correlates well. This is the first CMR imaging study that confirms diffuse myocardial fibrosis that occurs due to aging can result in a complex signal intensity pattern in high resolution LGE images and that texture analysis can be successful in identifying fibrotic myocardial regions. These techniques may be useful for analyzing LGE CMR images in patients with various cardiomyopathies but this will require further studies.
SUMMARY.
Late gadolinium enhanced (LGE) cardiac magnetic resonance (CMR) imaging can detect the presence of myocardial infarction from ischemic cardiomyopathies (ICM). However, it is more challenging to detect diffuse myocardial fibrosis from nonischemic cardiomyopathy (NICM) with this technique due to more subtle and heterogeneous enhancement of the myocardium. It was shown that ex-vivo LGE CMR imaging can identify myocardial fibrosis from ICM at nearly a cellular level. However, the signal enhancement obtained with the presence of collagen fibers across the myocardium in NICM is more subtle than with focal scars present in the ICM. This study investigates whether high-resolution LGE CMR can detect age-related diffuse myocardial fibrosis using quantitative texture analysis. Results are compared to histological slices for validation.
LGE CMR of twenty-four rat hearts (twelve 6-week-old and twelve 2-year-old) was performed using a 7 Tesla MRI scanner. All hearts were harvested 10 minutes after intravenous injection of gadolinium-DTPA and immediately subjected to CMR imaging. Picrosirius red stained myocardial sections and light microscopy were used as the histopathology reference for collagen assessment. Fibrosis in the myocardium was quantified with standard deviation (SD) threshold methods from the LGE CMR images and 3D contrast texture maps that were computed from grey level co-occurrence matrix of the CMR images.
There was a significant increase of collagen fibers in the aged compared to the young rat histology slices (2.60±0.27 %LV vs. 1.24±0.29 %LV, p<0.01). Both LGE CMR and texture images showed a significant increase of myocardial fibrosis in the elderly compared to the young rats. Separation of the two groups was excellent among various levels of SD threshold. Fibrosis in the LGE CMR images correlated strongly with histology with the 3 SD threshold (r=0.84, y=0.99x+0.00). Similarly, fibrosis in the contrast texture maps correlated with the histology using the 4 SD threshold (r=0.89, y=1.01x+0.00).
This study demonstrates that high resolution ex-vivo LGE CMR can detect the presence of subtle myocardial fibrosis present in various aged hearts. The variation of fibrosis content in the different-aged rat groups was successfully assessed with both LGE CMR and texture analysis and compared to histology reference measurements. Our results suggest that texture analysis can discriminate the elderly from the young rat groups and may improve the assessment of myocardial fibrosis in LGE CMR images.
HIGHLIGHTS.
High-resolution LGE CMR imaging can detect age-related myocardial fibrosis.
There was a significant increase of collagen in the aged versus the young rat hearts.
Quantitative LGE and texture analysis correlated well with histology measurements.
Texture analysis may improve the myocardial fibrosis assessment in LGE CMR images.
Acknowledgements
Funded by the Intramural Research Program of National Heart Lung and Blood Institute, Ecole Polytechnique of Montreal and Fonds de Recherche Nature et Technologie du Quebec.
Abbreviations
- CMR
cardiac magnetic resonance
- DTI
diffusion tensor imaging
- DTPA
diethylenetriamine pentaacetic acid
- ECV
extracellular volume fraction
- Gd
Gadolinium
- GLCM
grey level co-occurrence matrix
- HSV
hue-saturation-value
- ICM
ischemic cardiomyopathies
- LGE
late gadolinium enhancement
- LV
left ventricular
- NICM
non-ischemic cardiomyopathy
- NS
not statically significant
- ROI
region of interest
- SA
short-axis
- SI
signal intensity
- SD
standard deviation
Footnotes
Publisher's Disclaimer: This is a PDF file of an unedited manuscript that has been accepted for publication. As a service to our customers we are providing this early version of the manuscript. The manuscript will undergo copyediting, typesetting, and review of the resulting proof before it is published in its final citable form. Please note that during the production process errors may be discovered which could affect the content, and all legal disclaimers that apply to the journal pertain.
Conflict of Interest Disclosures: None
REFERENCES
- 1.Mewton N, Liu CY, Croisille P, Bluemke D, Lima JA. Assessment of myocardial fibrosis with cardiovascular magnetic resonance. J Am Coll Cardiol. 2011;57:891–903. doi: 10.1016/j.jacc.2010.11.013. [DOI] [PMC free article] [PubMed] [Google Scholar]
- 2.Cheng S, Fernandes VR, Bluemke DA, McClelland RL, Kronmal RA, Lima JA. Age-related left ventricular remodeling and associated risk for cardiovascular outcomes: the Multi-Ethnic Study of Atherosclerosis. Circ Cardiovasc Imaging. 2009;2:191–198. doi: 10.1161/CIRCIMAGING.108.819938. [DOI] [PMC free article] [PubMed] [Google Scholar]
- 3.Neilan TG, Coelho-Filho OR, Shah RV, Abbasi SA, Heydari B, Watanabe E, Chen Y, Mandry D, Pierre-Mongeon F, Blankstein R, Kwong RY, Jerosch-Herold M. Myocardial extracellular volume fraction from T1 measurements in healthy volunteers and mice: relationship to aging and cardiac dimensions. JACC Cardiovasc Imaging. 2013;6:672–683. doi: 10.1016/j.jcmg.2012.09.020. [DOI] [PMC free article] [PubMed] [Google Scholar]
- 4.Eghbali M, Robinson TF, Seifter S, Blumenfeld OO. Collagen accumulation in heart ventricles as a function of growth and aging. Cardiovasc Res. 1989;23:723–729. doi: 10.1093/cvr/23.8.723. [DOI] [PubMed] [Google Scholar]
- 5.Ellims AH, Iles LM, Ling LH, Hare JL, Kaye DM, Taylor AJ. Diffuse myocardial fibrosis in hypertrophic cardiomyopathy can be identified by cardiovascular magnetic resonance, and is associated with left ventricular diastolic dysfunction. J Cardiovasc Magn Reson. 2012;14:76. doi: 10.1186/1532-429X-14-76. [DOI] [PMC free article] [PubMed] [Google Scholar]
- 6.Bluemke DA. MRI of nonischemic cardiomyopathy. AJR Am J Roentgenol. 2010;195:935–940. doi: 10.2214/AJR.10.4222. [DOI] [PMC free article] [PubMed] [Google Scholar]
- 7.Shirani J, Pick R, Roberts WC, Maron BJ. Morphology and significance of the left ventricular collagen network in young patients with hypertrophic cardiomyopathy and sudden cardiac death. J Am Coll Cardiol. 2000;35:36–44. doi: 10.1016/s0735-1097(99)00492-1. [DOI] [PubMed] [Google Scholar]
- 8.Kim RJ, Fieno DS, Parrish TB, Harris K, Chen EL, Simonetti O, Bundy J, Finn JP, Klocke FJ, Judd RM. Relationship of MRI delayed contrast enhancement to irreversible injury, infarct age, and contractile function. Circulation. 1999;100:1992–2002. doi: 10.1161/01.cir.100.19.1992. [DOI] [PubMed] [Google Scholar]
- 9.Schelbert EB, Hsu LY, Anderson SA, Mohanty BD, Karim SM, Kellman P, Aletras AH, Arai AE. Late gadolinium-enhancement cardiac magnetic resonance identifies postinfarction myocardial fibrosis and the border zone at the near cellular level in ex vivo rat heart. Circ Cardiovasc Imaging. 2010;3:743–752. doi: 10.1161/CIRCIMAGING.108.835793. [DOI] [PMC free article] [PubMed] [Google Scholar]
- 10.Messroghli DR, Nordmeyer S, Dietrich T, Dirsch O, Kaschina E, Savvatis K, Klein COhID, Berger F, Kuehne T. Assessment of diffuse myocardial fibrosis in rats using small-animal Look-Locker inversion recovery T1 mapping. Circ Cardiovasc Imaging. 2011;4:636–640. doi: 10.1161/CIRCIMAGING.111.966796. [DOI] [PubMed] [Google Scholar]
- 11.Salerno M, Kramer CM. Advances in parametric mapping with CMR imaging. JACC Cardiovasc Imaging. 2013;6:806–822. doi: 10.1016/j.jcmg.2013.05.005. [DOI] [PMC free article] [PubMed] [Google Scholar]
- 12.Ugander M, Oki AJ, Hsu LY, Kellman P, Greiser A, Aletras AH, Sibley CT, Chen MY, Bandettini WP, Arai AE. Extracellular volume imaging by magnetic resonance imaging provides insights into overt and sub-clinical myocardial pathology. Eur Heart J. 2012;33:1268–1278. doi: 10.1093/eurheartj/ehr481. [DOI] [PMC free article] [PubMed] [Google Scholar]
- 13.Broberg CS, Chugh SS, Conklin C, Sahn DJ, Jerosch-Herold M. Quantification of diffuse myocardial fibrosis and its association with myocardial dysfunction in congenital heart disease. Circ Cardiovasc Imaging. 2010;3:727–734. doi: 10.1161/CIRCIMAGING.108.842096. [DOI] [PMC free article] [PubMed] [Google Scholar]
- 14.Setser RM, Bexell DG, O’Donnell TP, Stillman AE, Lieber ML, Schoenhagen P, White RD. Quantitative assessment of myocardial scar in delayed enhancement magnetic resonance imaging. J Magn Reson Imaging. 2003;18:434–441. doi: 10.1002/jmri.10391. [DOI] [PubMed] [Google Scholar]
- 15.Sado DM, Flett AS, Banypersad SM, White SK, Maestrini V, Quarta G, Lachmann RH, Murphy E, Mehta A, Hughes DA, McKenna WJ, Taylor AM, Hausenloy DJ, Hawkins PN, Elliott PM, Moon JC. Cardiovascular magnetic resonance measurement of myocardial extracellular volume in health and disease. Heart. 2012;98:1436–1441. doi: 10.1136/heartjnl-2012-302346. [DOI] [PubMed] [Google Scholar]
- 16.Flett AS, Hayward MP, Ashworth MT, Hansen MS, Taylor AM, Elliott PM, McGregor C, Moon JC. Equilibrium contrast cardiovascular magnetic resonance for the measurement of diffuse myocardial fibrosis: preliminary validation in humans. Circulation. 2010;122:138–144. doi: 10.1161/CIRCULATIONAHA.109.930636. [DOI] [PubMed] [Google Scholar]
- 17.Iles L, Pfluger H, Phrommintikul A, Cherayath J, Aksit P, Gupta SN, Kaye DM, Taylor AJ. Evaluation of diffuse myocardial fibrosis in heart failure with cardiac magnetic resonance contrast-enhanced T1 mapping. J Am Coll Cardiol. 2008;52:1574–1580. doi: 10.1016/j.jacc.2008.06.049. [DOI] [PubMed] [Google Scholar]
- 18.Kellman P, Wilson JR, Xue H, Bandettini WP, Shanbhag SM, Druey KM, Ugander M, Arai AE. Extracellular volume fraction mapping in the myocardium, part 2: initial clinical experience. J Cardiovasc Magn Reson. 2012;14:64. doi: 10.1186/1532-429X-14-64. [DOI] [PMC free article] [PubMed] [Google Scholar]
- 19.Su MY, Wu VC, Yu HY, Lin YH, Kuo CC, Liu KL, Wang SM, Chueh SC, Lin LY, Wu KD, Tseng WY. Contrast-enhanced MRI index of diffuse myocardial fibrosis is increased in primary aldosteronism. J Magn Reson Imaging. 2012;35:1349–1355. doi: 10.1002/jmri.23592. [DOI] [PubMed] [Google Scholar]
- 20.Sibley CT, Noureldin RA, Gai N, Nacif MS, Liu S, Turkbey EB, Mudd JO, van der Geest RJ, Lima JA, Halushka MK, Bluemke DA. T1 Mapping in cardiomyopathy at cardiac MR: comparison with endomyocardial biopsy. Radiology. 2012;265:724–732. doi: 10.1148/radiol.12112721. [DOI] [PMC free article] [PubMed] [Google Scholar]
- 21.Abdullah OM, Drakos SG, Diakos NA, Wever-Pinzon O, Kfoury AG, Stehlik J, Selzman CH, Reid BB, Brunisholz K, Verma DR, Myrick C, Sachse FB, Li DY, Hsu EW. Characterization of diffuse fibrosis in the failing human heart via diffusion tensor imaging and quantitative histological validation. NMR Biomed. 2014;27:1378–1386. doi: 10.1002/nbm.3200. [DOI] [PMC free article] [PubMed] [Google Scholar]
- 22.Bun SS, Kober F, Jacquier A, Espinosa L, Kalifa J, Bonzi MF, Kopp F, Lalevee N, Zaffran S, Deharo JC, Cozzone PJ, Bernard M. Value of in vivo T2 measurement for myocardial fibrosis assessment in diabetic mice at 11.75 T. Invest Radiol. 2012;47:319–323. doi: 10.1097/RLI.0b013e318243e062. [DOI] [PubMed] [Google Scholar]
- 23.Eftestol T, Woie L, Engan K, Kvaloy JT, Nilsen DWT, Orn S. Texture Analysis to Assess Risk of Serious Arrhythmias after Myocardial Infarction. 2012 Computing in Cardiology (Cinc) 2012;39:365–368. [Google Scholar]
- 24.Kotu LP, Engan K, Skretting K, Maloy F, Orn S, Woie L, Eftestol T. Probability mapping of scarred myocardium using texture and intensity features in CMR images. Biomed Eng Online. 2013;12:91. doi: 10.1186/1475-925X-12-91. [DOI] [PMC free article] [PubMed] [Google Scholar]
- 25.Thornhill RE, Cocker M, Dwivedi G, Dennie C, Fuller L, Dick A, Ruddy T, Pena E. Quantitative texture features as objective metrics of enhancement heterogeneity in hypertrophic cardiomyopathy. J Cardiovasc Magn Reson. 2014;16:P351. [Google Scholar]
- 26.Lopez-De Leon A, Rojkind M. A simple micromethod for collagen and total protein determination in formalin-fixed paraffin-embedded sections. J Histochem Cytochem. 1985;33:737–743. doi: 10.1177/33.8.2410480. [DOI] [PubMed] [Google Scholar]
- 27.Yabusaki K, Faits T, McMullen E, Figueiredo JL, Aikawa M, Aikawa E. A novel quantitative approach for eliminating sample-to-sample variation using a hue saturation value analysis program. Plos One. 2014;9:e89627. doi: 10.1371/journal.pone.0089627. [DOI] [PMC free article] [PubMed] [Google Scholar]
- 28.Foley JD, VanDam A. Fundamentals of interactive computer graphics. Addison-Wesley Longman Publishing Co., Inc.; 1982. [Google Scholar]
- 29.Haralick RM, Shanmugan K, Dinstein I. Textural Features for Image Classification, Systems, Man and Cybernetics. IEEE Transactions on, SMC-3. 1973:610–621. [Google Scholar]
- 30.Reimer KA, Lowe JE, Rasmussen MM, Jennings RB. The wavefront phenomenon of ischemic cell death. 1. Myocardial infarct size vs duration of coronary occlusion in dogs. Circulation. 1977;56:786–794. doi: 10.1161/01.cir.56.5.786. [DOI] [PubMed] [Google Scholar]
- 31.Ding WY, Liu L, Wang ZH, Tang MX, Ti Y, Han L, Zhang L, Zhang Y, Zhong M, Zhang W. FP-receptor gene silencing ameliorates myocardial fibrosis and protects from diabetic cardiomyopathy. J Mol Med (Berl) 2014;92:629–640. doi: 10.1007/s00109-013-1119-9. [DOI] [PubMed] [Google Scholar]
- 32.Caudron J, Mulder P, Nicol L, Richard V, Thuillez C, Dacher JN. MR relaxometry and perfusion of the myocardium in spontaneously hypertensive rat: correlation with histopathology and effect of anti-hypertensive therapy. Eur Radiol. 2013;23:1871–1881. doi: 10.1007/s00330-013-2801-6. [DOI] [PubMed] [Google Scholar]
- 33.Ishizu T, Seo Y, Kameda Y, Kawamura R, Kimura T, Shimojo N, Xu D, Murakoshi N, Aonuma K. Left ventricular strain and transmural distribution of structural remodeling in hypertensive heart disease. Hypertension. 2014;63:500–506. doi: 10.1161/HYPERTENSIONAHA.113.02149. [DOI] [PubMed] [Google Scholar]
- 34.Li W, Lu M, Banerjee S, Zhong J, Ye A, Molter J, Yu X. Ex vivo diffusion tensor MRI reflects microscopic structural remodeling associated with aging and disease progression in normal and cardiomyopathic Syrian hamsters. NMR Biomed. 2009;22:819–825. doi: 10.1002/nbm.1394. [DOI] [PMC free article] [PubMed] [Google Scholar]
- 35.Anversa P, Capasso JM. Cellular basis of aging in the mammalian heart. Scanning Microsc. 1991;5:1065–1073. discussion 1073–1064. [PubMed] [Google Scholar]
- 36.Sangaralingham SJ, Ritman EL, McKie PM, Ichiki T, Lerman A, Scott CG, Martin FL, Harders GE, Bellavia D, Burnett JC., Jr Cardiac micro-computed tomography imaging of the aging coronary vasculature. Circ Cardiovasc Imaging. 2012;5:518–524. doi: 10.1161/CIRCIMAGING.112.973057. [DOI] [PMC free article] [PubMed] [Google Scholar]
- 37.Walker EM, Jr, Nillas MS, Mangiarua EI, Cansino S, Morrison RG, Perdue RR, Triest WE, Wright GL, Studeny M, Wehner P, Rice KM, Blough ER. Age-associated changes in hearts of male Fischer 344/Brown Norway F1 rats. Ann Clin Lab Sci. 2006;36:427–438. [PubMed] [Google Scholar]
- 38.Liu CY, Liu YC, Wu C, Armstrong A, Volpe GJ, van der Geest RJ, Liu Y, Hundley WG, Gomes AS, Liu S, Nacif M, Bluemke DA, Lima JA. Evaluation of age-related interstitial myocardial fibrosis with cardiac magnetic resonance contrast-enhanced T1 mapping: MESA (Multi-Ethnic Study of Atherosclerosis) J Am Coll Cardiol. 2013;62:1280–1287. doi: 10.1016/j.jacc.2013.05.078. [DOI] [PMC free article] [PubMed] [Google Scholar]
- 39.Moravsky G, Ofek E, Rakowski H, Butany J, Williams L, Ralph-Edwards A, Wintersperger BJ, Crean A. Myocardial fibrosis in hypertrophic cardiomyopathy: accurate reflection of histopathological findings by CMR. JACC Cardiovasc Imaging. 2013;6:587–596. doi: 10.1016/j.jcmg.2012.09.018. [DOI] [PubMed] [Google Scholar]
- 40.Flett AS, Hasleton J, Cook C, Hausenloy D, Quarta G, Ariti C, Muthurangu V, Moon JC. Evaluation of techniques for the quantification of myocardial scar of differing etiology using cardiac magnetic resonance. JACC Cardiovasc Imaging. 2011;4:150–156. doi: 10.1016/j.jcmg.2010.11.015. [DOI] [PubMed] [Google Scholar]
- 41.Beek AM, Bondarenko O, Afsharzada F, van Rossum AC. Quantification of late gadolinium enhanced CMR in viability assessment in chronic ischemic heart disease: a comparison to functional outcome. J Cardiovasc Magn Reson. 2009;11:6. doi: 10.1186/1532-429X-11-6. [DOI] [PMC free article] [PubMed] [Google Scholar]
- 42.Baron N, Kachenoura N, Cluzel P, Frouin F, Herment A, Grenier P, Montalescot G, Beygui F. Comparison of various methods for quantitative evaluation of myocardial infarct volume from magnetic resonance delayed enhancement data. Int J Cardiol. 2013;167:739–744. doi: 10.1016/j.ijcard.2012.03.056. [DOI] [PubMed] [Google Scholar]
- 43.Mikami Y, Kolman L, Joncas SX, Stirrat J, Scholl D, Rajchl M, Lydell CP, Weeks SG, Howarth AG, White JA. Accuracy and reproducibility of semi-automated late gadolinium enhancement quantification techniques in patients with hypertrophic cardiomyopathy. J Cardiovasc Magn Reson. 2014;16:85. doi: 10.1186/s12968-014-0085-x. [DOI] [PMC free article] [PubMed] [Google Scholar]
- 44.Ambale-Venkatesh B, Lima JA. Cardiac MRI: a central prognostic tool in myocardial fibrosis. Nature reviews. Cardiology. 2015;12:18–29. doi: 10.1038/nrcardio.2014.159. [DOI] [PubMed] [Google Scholar]
- 45.Mahrholdt H, Wagner A, Judd RM, Sechtem U, Kim RJ. Delayed enhancement cardiovascular magnetic resonance assessment of non-ischaemic cardiomyopathies. Eur Heart J. 2005;26:1461–1474. doi: 10.1093/eurheartj/ehi258. [DOI] [PubMed] [Google Scholar]
- 46.Hsu LY, Natanzon A, Kellman P, Hirsch GA, Aletras AH, Arai AE. Quantitative myocardial infarction on delayed enhancement MRI. Part I: Animal validation of an automated feature analysis and combined thresholding infarct sizing algorithm. J Magn Reson Imaging. 2006;23:298–308. doi: 10.1002/jmri.20496. [DOI] [PubMed] [Google Scholar]
- 47.Whittaker P, Kloner RA, Boughner DR, Pickering JG. Quantitative assessment of myocardial collagen with picrosirius red staining and circularly polarized light. Basic Res Cardiol. 1994;89:397–410. doi: 10.1007/BF00788278. [DOI] [PubMed] [Google Scholar]
- 48.de Jong S, van Veen TA, de Bakker JM, van Rijen HV. Monitoring cardiac fibrosis: a technical challenge. Neth Heart J. 2012;20:44–48. doi: 10.1007/s12471-011-0226-x. [DOI] [PMC free article] [PubMed] [Google Scholar]