

Abstract
Regular physical activity is effective in reducing visceral white adipose tissue (AT) inflammation and oxidative stress, and these changes are commonly associated with reduced adiposity. However, the impact of multiple periods of physical activity, intercalated by periods of inactivity, i.e., intermittent physical activity, on markers of AT inflammation and oxidative stress is unknown. In the present study, 5-wk-old male C57BL/6 mice were randomized into three groups (n = 10/group): sedentary, regular physical activity, and intermittent physical activity, for 24 wk. All animals were singly housed and fed a diet containing 45% kcal from fat. Regularly active mice had access to voluntary running wheels throughout the study period, whereas intermittently active mice had access to running wheels for 3-wk intervals (i.e., 3 wk on/3 wk off) throughout the study. At death, regular and intermittent physical activity was associated with similar reductions in visceral AT mass (approximately −24%, P < 0.05) relative to sedentary. However, regularly, but not intermittently, active mice exhibited decreased expression of visceral AT genes related to inflammation (e.g., monocyte chemoattractant protein 1), immune cell infiltration (e.g., CD68, CD11c, F4/80, CD11b/CD18), oxidative stress (e.g., p47 phagocyte oxidase), and endoplasmic reticulum stress (e.g., CCAAT enhancer-binding protein homologous protein; all P < 0.05). Furthermore, regular, but not intermittent, physical activity was associated with a trend toward improvement in glucose tolerance (P = 0.059). Collectively, these findings suggest that intermittent physical activity over a prolonged period of time may lead to a reduction in adiposity but with retention of a sedentary obese white AT and metabolic phenotype.
Keywords: obesity, exercise, weight cycling, fat, gene expression, inflammation, ER stress
more than one-third of American adults are obese, and the prevalence of obesity has more than doubled in the past 50 years (24a). Obesity is an important risk factor for insulin resistance, which plays a key pathogenic role in the development of Type 2 diabetes and cardiovascular disease (11, 30). However, the mechanisms that link obesity and insulin resistance remain poorly understood. Visceral white adipose tissue (AT) dysfunction is a characteristic feature of obesity-related insulin resistance, and evidence implicates AT inflammation as a causal link between obesity and insulin resistance (10). Obesity is associated with infiltration of immune cells into AT, thus contributing to AT inflammation and secretion of inflammatory cytokines (13). Accordingly, it is not surprising that interventions that reduce adiposity, such as exercise and diet restriction, are effective in reducing white AT inflammation and oxidative stress (8, 21, 22). However, human data suggest that individuals who lose weight are frequently unable to maintain this weight loss (39). These repeated oscillations in weight, commonly referred to as weight cycling, are shown to increase the risk for development of Type 2 diabetes and cardiovascular disease in some studies (9, 12, 38). Furthermore, recent experimental data from rodents demonstrate that weight cycling, induced by changes in caloric intake, promotes AT inflammation (2).
Although current evidence indicates that oscillations in body weight resulting from diet changes are detrimental to metabolic and AT function in mice (2), whether multiple periods of physical activity, intercalated by periods of inactivity, also lead to weight cycling and AT dysfunction is unknown. There is evidence from rodent (7, 18, 27) and human (25) studies that cessation of physical activity for 7–10 days is sufficient to increase visceral adiposity. It is not uncommon for humans to transition repetitively from periods of high physical activity to periods of inactivity and vice versa over their lifespan. These oscillations in physical activity levels can be driven by many environmental and psychosocial factors, including changes in seasons or job demands (e.g., grant deadlines in the case of academicians). Accordingly, to begin understanding the metabolic consequences of alternating periods of activity and inactivity, we designed a mouse protocol to “mimic” oscillations in physical activity levels that humans often encounter in life. Specifically, intermittently active mice had access to running wheels for 3-wk intervals (i.e., 3 wk on/3 wk off) throughout a 24-wk period. First, we hypothesized that intermittent physical activity would result in corresponding oscillations in body weight, not unlike “yo-yo dieting.” Second, although regular exercise exerts strong anti-inflammatory and antioxidant effects on AT (5, 6, 8, 15, 16, 20, 36), we hypothesized that intermittent physical activity—and thus associated fluctuations in body weight—would not lead to an improved AT phenotype. In particular, we sought to examine in visceral white AT markers of inflammatory adipokines, oxidative stress, endoplasmic reticulum (ER) stress, and immune cell infiltration. To determine if the observed effects of intermittent physical activity were specific to AT, the same mRNA markers were assessed in the liver, another metabolically active tissue.
METHODS
Experimental design.
Male C57BL/6 mice (n = 30), from The Jackson Laboratory (Bar Harbor, MA), arrived to our facility at 4 wk of age and after 1 wk of acclimatization, were randomized to three groups (n = 10/group): sedentary, regular physical activity, and intermittent physical activity, for 24 wk. All mice were singly housed under standard temperature conditions (∼22°C) and humidity with a light cycle from 0700 to 1900 and a dark cycle from 1900 to 0700. All mice were fed a diet containing 45% kcal from fat (Product #D12451; Research Diets, New Brunswick, NJ) ad libitum. Regularly active mice had access to voluntary running wheels throughout the 24-wk study period, whereas intermittently active mice had access to running wheels for 3-wk intervals (i.e., 3 wk on/3 wk off) throughout the study period (four total cycles, with each cycle ending with inactivity). Running wheels were connected to a Sigma BC509 cycling computer (Product #CP244A02; Jenson USA, www.JensonUSA) for determination of weekly running distance. Food intake and body weight were also assessed weekly throughout the study. At 29 wk of age, mice were euthanized via CO2 inhalation, and tissues were harvested for downstream analysis. Before death, the wheels of the regularly active mice and food from all mice were removed from the cages for ∼12 h. All animal protocols were approved by the University of Missouri Institutional Animal Care and Use Committee.
Fasting blood parameters.
Glucose, cholesterol, triglycerides, and nonesterified fatty acid assays were performed by a commercial laboratory (Comparative Clinical Pathology Services, Columbia, MO) on an Olympus AU680 automated chemistry analyzer (Beckman-Coulter, Brea, CA) using assays, according to the manufacturer's guidelines. Plasma insulin concentrations were determined using a commercially available, mouse-specific ELISA (Alpco Diagnostics, Salem, NH). The whole-blood samples were analyzed for HbA1c using a boronate affinity HPLC method, ultra2 (Trinity Biotech, Kansas City, MO). This method measures all glycated Hb by binding to the cis-diol groups of the glucose bound to Hb. The method is standardized following the National Glycohemoglobin Standardization Program to report HbA1c specifically.
Glucose-tolerance tests.
Glucose-tolerance tests were performed at 17 wk of age. In brief, after an overnight fast, blood glucose was measured from the tail vein. The tail was nicked, and blood was sampled by a hand-held glucometer (AlphaTRAK; Abbott Laboratories, Abbott Park, IL). A baseline measure of blood glucose was taken before giving a sterile solution of 50% dextrose (2 g/kg body wt) via intraperitoneal injection, as performed previously (35, 36a). Glucose measures were taken, 15, 30, 45, 60, and 120 min after the glucose injection. Glucose area under curve from baseline was calculated.
Histological assessments.
Formalin-fixed samples were processed through paraffin embedment, sectioned at 5 μm, and stained with hematoxylin and eosin for morphometric determinations, as described previously (20). Liver samples were stained with Oil Red O. Sections were evaluated via an Olympus BX60 photomicroscope (Olympus, Melville, NY), and images were taken at ×10 (AT) or ×20 (liver) magnification via SPOT Insight digital camera (Diagnostic Instruments, Sterling Heights, MI). Adipocyte size was calculated based on 100 adipocytes/animal from three, ×10 fields of view, as performed previously (28). In brief, cross-sectional areas of the adipocytes were obtained from perimeter tracings using ImageJ software [National Institutes of Health (NIH) public domain; NIH, Bethesda, MD]. Separate slides were stained with Mac-2 antibody (CL8942AP; Cedarlane, Burlington, ON, Canada), a macrophage marker, for the analysis of crown-like structures (28). Quantification was done by counting the number of Mac-2-positive, crown-like structures per ×10 field (28). The average of three fields was used per animal. All procedures were performed by an investigator, blinded to the treatment groups.
Liver triglycerides.
Intrahepatic triacylglycerol (TG) concentration was determined using a commercially available kit (Wako L-Type TG M; Wako Pure Chemical Industries, Osaka, Japan). A BioTek uQUANT microplate spectrophotometer (Biotek Instruments, Winooski, VT) was used to analyze the absorbance set at a wavelength of 582 nm. Data are expressed as milligrams TG/wet weight gram of liver, as described previously (36).
Citrate synthase activity.
Citrate synthase activity in soleus muscle was determined by the methods of Srere et al. (31). In brief, soleus homogenates were incubated in the presence of oxaloacetate, acetyl-CoA, and DTNB. Spectrophotometric detection of reduced DTNB at a wavelength of 412 nm served as an index of enzyme activity.
RNA extraction and quantitative real-time RT-PCR.
Retroperitoneal AT and liver samples were homogenized in TRIzol solution using a tissue homogenizer (TissueLyser LT; Qiagen, Valencia, CA). Total RNA was isolated, according to Qiagen's RNeasy lipid tissue protocol, and assayed using a Nanodrop spectrophotometer (Thermo Scientific, Wilmington, DE) to assess purity and concentration. First-strand cDNA was synthesized from total RNA using the High Capacity cDNA Reverse Transcription Kit (Applied Biosystems, Carlsbad, CA). Quantitative real-time PCR was performed as described previously (8) using the StepOnePlus sequence detection system (Applied Biosystems). Primer sequences (Table 1) were designed using the National Center for Biotechnology Information Primer Design tool. All primers were purchased from Integrated DNA Technologies (Coralville, IA). A 20-μl reaction mixture containing 10 μl iTaq Universal SYBR Green Supermix (Bio-Rad Laboratories, Hercules, CA) and the appropriate concentrations of gene-specific primers, plus 4 μl cDNA template, were loaded in each well of a 96-well plate. All PCR reactions were performed in duplicate. PCR was performed with thermal conditions as follows: 95°C for 10 min, followed by 40 cycles of 95°C for 15 s and 60°C for 45 s. A dissociation melt-curve analysis was performed to verify the specificity of the PCR products. 18S and RPS13 were used as housekeeping control genes. 18S and RPS13 cycle thresholds (CT) were not different among the three groups of animals; thus the average between 18S and RPS13 was used as housekeeping control. mRNA expression values are presented as 2ΔCT, whereby ΔCT = housekeeping CT − gene-of-interest CT (8). mRNA levels were normalized to the sedentary group, which was always set at 1.
Table 1.
Forward and reverse primer sequences for quantitative real-time PCR
| Primer Sequence (5′ → 3′) |
|||
|---|---|---|---|
| Gene Description | Protein Name | Forward | Reverse |
| 18S Ribosomal RNA | 18S | TCAAGAACGAAAGTCGGAGG | GGACATCTAAGGGCATCAC |
| Ribosomal protein S13 | RSP13 | TGCCGTTTCCTACCTCGTTC | CACGTCGTCAGACGTCAACT |
| Tumor necrosis factor-α | TNF-α | AGCCGATGGGTTGTACCTTG | ATAGCAAATCGGCTGACGGT |
| Interleukin 6 | IL-6 | TCCAGTTGCCTTCTTGGGAC | AGTCTCCTCTCCGGACTTGT |
| Monocyte chemoattractant protein 1 | MCP1 | GGCTGGAGAGCTACAAGAGG | GGTCAGCACAGACCTCTCTC |
| Interferon-γ | IFN-γ | AGCAAGGCGAAAAAGGATGC | TCATTGAATGCTTGGCGCTG |
| Chemokine (C–C motif) receptor 2 | CCR2 | ACACTCCTGGCTGGAAAAGAAG | GGCATTTACAGGTATGGCTCCT |
| Chemokine (C–C motif) ligand 5 | RANTES | TCCCTGTCATTGCTTGCTCT | ATTTTCCCAGGACCGAGTGG |
| Leptin | Leptin | CCTATTGATGGGTCTGCCCG | TGAGCGCTACCTGCATAGAC |
| Adiponectin | Adipoq | GCACTGGCAAGTTCTACTGCAA | GTAGGTGAAGAGAACGGCCTTGT |
| CD68 antigen | CD68 | TGTTCAGCTCCAAGCCCAAA | GTACCGTCACAACCTCCCTG |
| Integrin α X | CD11c | ATGCCACTGTCTGCCTTCAT | GTCTCCTTGAAGATGGCCCG |
| EGF-like module-containing mucin-like hormone receptor-like 1 | F4/80 | GGGTATCATGAGTTGATGGCAGT | CCTTGGTGCATGAAACTCCT |
| Integrin α M | CD11b/CD18 | AGCTTGGCTTTTTCAAGCGG | AAAGGCCGTTACTGAGGTGG |
| Cytochrome b-245, α polypeptide | p22phox | ACTCTATCGCTGCAGGTGTG | AAGCTTCACCACAGAGGTCAG |
| Neutrophil cytosolic factor 1 | p47phox | GGCACAAAGGACAATCCATCG | TTCCGTTTGGTGCTCTCTGT |
| DNA damage-inducible transcript 3 | CHOP | ATGTTGAAGATGAGCGGGTG | TGGAACACTCTCTCCTCAGGT |
| Heat shock protein 5 | GRP78 | TGTGTGTGAGACCAGAACCG | GCAGTCAGGCAGGAGTCTTA |
Statistical analysis.
One-way ANOVA was used to compare the means of the three independent groups of animals (sedentary, regularly active, and intermittently active mice) for all dependent variables and followed by a least-significant difference post hoc test for pair-wise comparisons. All data are presented as means ± SE. For all statistical tests, the alpha level was set at 0.05. All statistical analyses were performed with SPSS V22.0.
RESULTS
As shown in Fig. 1A, mice with continuous access to running wheels increased running distance throughout the first 3 wk of the study (peak running distance ∼150 km/wk at 8 wk of age), and then running distance gradually declined to ∼11 km/wk by 29 wk of age. Mice with intermittent access to running wheels also exhibited a decline in running distance over time; however, during the periods of wheel access, the running distance in intermittently active mice was greater than that of regularly active mice. The total running distance over the 24-wk period was 1,417 ± 153 km for regularly active mice and 1,042 ± 102 km for intermittently active mice (P = 0.056). Regular physical activity attenuated the age and high-fat, diet-related increase in body weight relative to sedentary mice (Fig. 1B). Intermittent physical activity appeared to produce mild fluctuations in body weight, but these fluctuations subsided over time, resulting in the attenuation of body weight similar to that of mice engaged in regular physical activity (Fig. 1B). As shown in Fig. 1C, regularly active mice ate more food than sedentary mice. Food intake of intermittently active mice “cycled” in parallel with their activity levels. That is, in periods of activity, they ate a similar amount to that of regularly active mice, whereas in periods of inactivity, they ate a similar amount to that of sedentary mice. Accordingly, the average food intake over the course of the 24-wk period for the intermittently active mice was in between the regularly active and sedentary mice (see Fig. 1C).
Fig. 1.

Weekly running distance (A), body weight (B), and food intake (C) in sedentary mice and mice engaged in regular vs. intermittent physical activity. C, inset: average food intake over the 24-wk period. Values are expressed as means ± SE. *P < 0.05, difference from sedentary.
As illustrated in Fig. 2A, final body weights were ∼12% lower in the regular (P < 0.05) and intermittent (trending P = 0.069) physically active mice compared with the sedentary mice, but regular and intermittent exercisers were not different from each other (P > 0.05). Additionally, both regular and intermittent physically active mice had reduced visceral white (i.e., retroperitoneal and epididymal) and brown AT mass compared with sedentary mice (P < 0.05; Fig. 2, B, C, and E). As markers of training adaptation, heart weight-to-body weight ratio was increased with both regular and intermittent physical activity (P < 0.05; Fig. 2F), and citrate synthase activity in the soleus muscle tended to be higher in both groups of physical activity but did not reach statistical significance (P > 0.05; Fig. 2G). In addition, regular physical activity was associated with improved glucose tolerance (Fig. 2I) relative to intermittently active mice. Glucose tolerance of intermittently active mice was similar to that of sedentary obese mice (P = 0.6; Fig. 2I). As summarized in Table 2, compared with sedentary mice, regular and intermittent physical activity similarly reduced fasting plasma LDL cholesterol (P < 0.05). However, regular but not intermittent physical activity reduced fasting plasma insulin (P < 0.05).
Fig. 2.

Final body weights (A), tissue weights (B–F), soleus citrate synthase (CS) activity (G), and glucose tolerance (H and I) in sedentary mice and mice engaged in regular vs. intermittent physical activity. Values are expressed as means ± SE. *P < 0.05, difference from sedentary; #P < 0.05, difference from intermittent physical activity. AT, adipose tissue; AUC, area under curve.
Table 2.
Fasting blood characteristics
| Variable | Sedentary | Regular Physical Activity | Intermittent Physical Activity |
|---|---|---|---|
| Total cholesterol, mg/dl | 152.1 ± 13.1 | 125.0 ± 13.8 | 121.0 ± 13.2 |
| LDL cholesterol, mg/dl | 6.9 ± 0.9 | 4.1 ± 0.5* | 4.4 ± 1.0* |
| HDL cholesterol, mg/dl | 56.8 ± 3.2 | 54.7 ± 6.2 | 50.6 ± 3.6 |
| Triglycerides, mg/dl | 96.5 ± 6.5 | 83.4 ± 8.8 | 77.9 ± 9.4 |
| NEFA, mmol/l | 1.06 ± 0.07 | 0.91 ± 0.10 | 1.01 ± 0.15 |
| Insulin, ng/ml | 1.08 ± 0.26 | 0.42 ± 0.11* | 0.58 ± 0.25 |
| Glucose, mg/dl | 273.8 ± 30.2 | 220.3 ± 37.8 | 204.5 ± 41.6 |
| % HbA1c | 4.42 ± 0.10 | 4.62 ± 0.04 | 4.58 ± 0.06 |
NEFA, nonesterified fatty acids.
P < 0.05, difference from sedentary mice. Values are expressed as means ± SE.
Figure 3 summarizes the effects of regular and intermittent physical activity on retroperitoneal AT gene expression and AT mass. Regular physical activity was associated with reduced retroperitoneal AT mass and reduced mRNA levels of genes related to inflammation [e.g., monocyte chemoattractant protein 1 (MCP1)], immune cell infiltration (e.g., CD68, CD11c, F4/80, CD11b/CD18), oxidative stress [e.g., p47 phagocyte oxidase (phox)], and ER stress [e.g., CCAAT enhancer-binding protein homologous protein (CHOP)] compared with sedentary mice. Similar nonsignificant trends were observed for mRNA levels of other markers of inflammation, oxidative stress, and ER stress [e.g., IFN-γ, CCR2, regulated on activation, normal T cell expressed and secreted (RANTES), Leptin, p22phox, and glucose-regulated protein 78 (GRP78); Fig. 4]. In contrast, although intermittent physical activity was also associated with reduced retroperitoneal AT mass, as in the continuously active group, this weight loss was not accompanied by a reduction in expression of several inflammatory, oxidative, and ER stress markers (P > 0.05 compared with sedentary group; Fig. 3).
Fig. 3.

Association of retroperitoneal AT mass and mRNA levels of adipokine/cytokine-, immune cell-, oxidative stress-, and endoplasmic reticulum stress-related genes in sedentary mice and mice engaged in regular vs. intermittent physical activity. Values are expressed as means ± SE. *P < 0.05, difference between sedentary and regularly active mice; #P < 0.05, difference between regularly active and intermittently active mice. phox, phagocyte oxidase; RANTES, regulated on activation, normal T cell expressed and secreted; MCP1, monocyte chemoattractant protein 1; CHOP, CCAAT enhancer-binding protein homologous protein; IFN-g, IFN-γ; Adipoq, adiponectin; GRP78, glucose-regulated protein 78.
Fig. 4.

Representative histology images (10×) of visceral white (i.e., epididymal) AT stained for Mac-2 (A), adipocyte cell size (B and C), and number of crown-like structures (D) in sedentary mice and mice engaged in regular vs. intermittent physical activity. Values are expressed as means ± SE.
Figure 4A illustrates representative histological images of epididymal white AT stained with Mac-2, a macrophage marker. Although adipocyte size was similar among groups (Fig. 4, B and C), in support of the inflammatory gene-expression differences between active groups, the AT of the regularly active mice tended to have fewer crown-like structures per field of view (indicative of adipocyte necrosis and inflammation) compared with the intermittently active mice (P = 0.054; Fig. 4D).
Representative images of Oil Red O-stained liver sections are presented in Fig. 5A. A reduced amount of Oil Red O staining in regularly and intermittently active mice compared with sedentary mice is consistent with the decrease in liver triglycerides (P < 0.05; Fig. 5B). The same RNA markers reported in Fig. 3 (in AT) were measured in the liver and are summarized in Fig. 5C. No significant changes in liver gene expression were found across all genes examined.
Fig. 5.
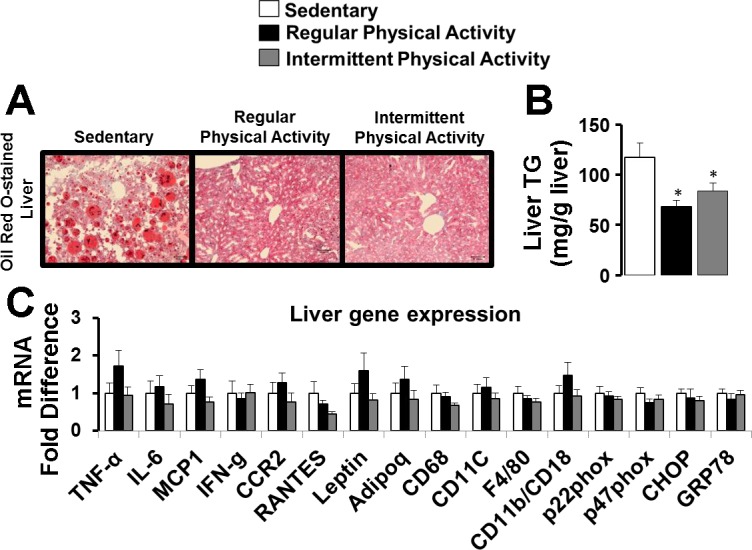
Representative histology images (20×) of Oil Red O-stained liver (A), liver triglycerides (TG; B), and liver gene expression (C) in sedentary mice and mice engaged in regular vs. intermittent physical activity. Values are expressed as means ± SE. *P < 0.05, difference from sedentary.
DISCUSSION
In the present study, we compared mice trained continuously on running wheels with mice exposed to running wheels intermittently (i.e., 3 wk on/3 wk off for a 24-wk period). We demonstrated that mice intermittently exposed to running displayed a reduction in visceral adiposity that was comparable with that observed in animals that had constant access to running wheels. However, the reduction in adiposity caused by intermittent physical activity was not accompanied by a reduction in expression of inflammatory genes in visceral white AT to the level exhibited by mice undergoing continuous exercise training. Furthermore, we found that regular but not intermittent physical activity was associated with a modest improvement in glucose tolerance. Together, these findings suggest that intermittent physical activity over a prolonged period of time may lead to a reduction in adiposity, albeit with retention of a sedentary obese white AT and metabolic phenotype.
Emerging evidence implicates white visceral AT inflammation as a contributor to the development of obesity-related metabolic disease, such as Type 2 diabetes and cardiovascular disease (11, 37). It is now recognized that visceral white AT is a source of a plethora of proinflammatory cytokines that are magnified in the setting of obesity (13). Indeed, obesity is associated with infiltration of immune cells, such as macrophages and T lymphocytes, which can crossactivate one another and perpetuate the secretion of inflammatory cytokines from AT (26). Effective approaches to reduce AT inflammation and secretion of proinflammatory cytokines associated with obesity include increased physical activity and diet restriction, likely as a result of decreased adiposity (22). As such, current evidence indicates that anti-inflammatory effects of diet-induced weight loss manifest when decreased adiposity is sustained over time (19, 39). In this regard, a recent study in mice, by our coauthors Anderson(-Baucum) and Hasty and their colleagues (2), demonstrated that weight loss and weight regain by alternating high-fat and low-fat diets resulted in a proinflammatory stimulus to AT. However, to date, it remained unknown whether fluctuations in body weight, induced by alternating periods of physical activity and inactivity, rather than changes in the dietary composition, would also pose a proinflammatory insult to AT. To begin to understand the metabolic consequences of alternating periods of activity, we designed a mouse protocol to mimic oscillations in physical activity that humans often encounter in life. Specifically, we studied high-fat, diet-fed mice that were exposed to running wheels during 3-wk periods every 3 wk for a total of 24 wk and compared them with mice that remained physically active or sedentary throughout the entire study period.
Contrary to our expectation that intermittent episodes of physical activity would lead to pronounced fluctuations in body weight, only small oscillations in body weight were apparent during the initial weeks of activity and subsided over time. Notably, at the conclusion of the study, we found that intermittent activity led to a reduction in body weight and AT mass compared with that found with regular physical activity (Figs. 1B and 2). As noted, the reduction in visceral adiposity with regular and intermittent physical activity was also associated with reduced ectopic liver fat (Fig. 5, A and B). It is possible that the similar reductions in adiposity achieved by both exercise regimens were due to the fact that animals undergoing intermittent activity ran more (i.e., had greater energy expenditure) during the periods of wheel access compared with the animals with constant access to running wheels. Thus whereas the total running distance of intermittently active mice was slightly less than that of regularly active mice, intermittently active mice also ate slightly less than the regularly active mice. However, this difference in average food intake was not statistically significant (Fig. 1C). The greater running of intermittently active mice when exposed to running wheels may be related to a “novelty phenomenon,” which may also explain why running distance markedly declines over time in most rodents chronically exposed to running wheels (Fig. 1A) (8, 24, 33).
The most salient finding of the present study is that even though intermittent physical activity caused a reduction in body weight and adiposity, similar to that induced by regular activity, this was not accompanied by a decrease in inflammatory gene expression and markers of macrophage cell infiltration in visceral white AT (Figs. 3 and 4). However, reductions in adiposity induced by regular activity did produce the expected significant reduction in expression of a number of genes related to inflammation (e.g., MCP1), immune cell infiltration (e.g., CD68, CD11c, F4/80, CD11b/CD18), oxidative stress (e.g., p47phox), and ER stress (e.g., CHOP; Fig. 3). As noted in Fig. 3, other mRNAs, such as IFN-γ, CCR2, RANTES, Leptin, p22phox, and GRP78, also displayed a downregulation with regular but not intermittent physical activity; however, these effects did not reach statistical significance, likely due to lack of statistical power. Similar trends were noted in the number of Mac-2-stained, crown-like structures (Fig. 4D). Thus the phenotype of visceral white AT from animals exposed to intermittent activity recapitulates that of the sedentary obese animals, despite the reduced AT mass. Therefore, although the mechanisms remain to be investigated, it appears that intermittent activity produces a leaner but inflammatory obese visceral AT phenotype, while continuous activity also decreases AT inflammation. Notably, the glucose tolerance of these lean animals also resembled that of sedentary obese animals (Fig. 2I), supporting the notion that white visceral AT inflammation is associated with metabolic dysfunction. However, future studies are needed to determine if these changes in glucose tolerance translate to changes in insulin resistance by incorporating insulin-tolerance tests or hyperinsulinemic clamps. Another observation that should be noted is that this differential modulation of AT phenotype with regular vs. intermittent physical activity cannot be extrapolated to other metabolically active tissues. Indeed, as we show in Fig. 5C, expression of genes reported to be modulated in AT (Fig. 3) was largely unaffected in the liver.
Interestingly, available data suggest that normal weight individuals can present with AT inflammation and insulin resistance (estimates suggest ∼10–37% of the population) (4, 14, 23). This has been termed the metabolically unhealthy normal weight (MUNW) phenotype (3). MUNW individuals are at greater risk for cardiovascular disease compared with subjects of comparable body weight but who are metabolically healthy (29). In our study, intermittent physical activity produced the “MUNW phenotype” in mice, whereas regular physical activity produced the metabolically healthy phenotype, thus supporting the notion that the magnitude of adiposity is not the sole factor dictating AT function. Furthermore, the observation that despite reduced adiposity and liver fat, intermittent physical activity did not lead to improvements in glucose tolerance may support the idea that the molecular phenotype of visceral AT is an important determinant of whole body metabolic function. In this regard, various animal models exist demonstrating that AT-specific genetic manipulation can have profound metabolic effects, independent of adiposity (17). Along these lines, recent data by Goodyear's group (32) demonstrate that sedentary mice receiving an AT transplant from exercise-trained mice improve their glucose tolerance 9 days later.
In the present study, intermittently active mice were studied after a 3-wk period of inactivity. We expected that removal of activity would create a weight-rebound effect, such that final body weights would be similar to that of chronically sedentary animals. Instead, to our surprise, the weight and AT mass matching occurred between the two groups of exercising animals, also creating an attractive situation for studying the effects of continuous vs. intermittent physical activity, independent of adiposity. Based on the current study design, however, we cannot rule out that the effects of intermittent physical activity may relate simply to the last 3 wk of inactivity before death. We acknowledge that inclusion of an extra group of mice undergoing regular physical activity with removal of activity during the last 3 wk would have strengthened the study. Nevertheless, an important aspect to consider here is that if the effects of intermittent physical activity were solely explained by the last 3 wk of inactivity, then one would have expected an increase in visceral adiposity relative to the regularly active mice. Indeed, we (8) and others (7, 18) have shown that even 1 single wk of cessation of wheel running in rodents increases visceral fat-pad weights, and this is also the case in humans (25). The fact that intermittently active mice, after the last 3 wk of inactivity, were not fatter than the regularly active mice suggests that oscillations in activity over time may lead to a distinct phenotype that may not recapitulate the effects of only 3 wk of inactivity. However, this is speculative, and additional experimentation is warranted to test this important hypothesis. Furthermore, additional studies are needed to elucidate the mechanisms by which intermittent activity leads to this puzzling association between reduced AT mass and an “unhealthy” AT molecular signature. Based on the observation that oscillations in body weight were not prominent and were clearly attenuated toward the end of the study, one may conclude that weight cycling per se was not the primary driving factor for this AT maladaptation. Indeed, these AT effects appear to be mediated by “exercise cycling” instead of “weight cycling.” However, it remains possible that AT exhibited oscillations in mass, which were undetectable with measures of body weight. In this regard, future studies examining the effects of intermittent exercise should include periodic noninvasive measures of percent body fat. As is the case with most exercise-training studies, it is possible that some of the observed exercise effects on AT gene expression were the result of a residual acute effect from the last bout of exercise and not reflective of a chronic exercise-induced AT adaptation. To alleviate this concern, as is customary, running wheels were removed from the cages of regularly active animals, ∼12 h before death.
Perspectives and Significance
In conclusion, the present data suggest, for the first time, that intermittent physical activity over a prolonged period of time may lead to the retention of a sedentary obese white AT and glucose-intolerant phenotype, despite a reduction in adiposity. These findings highlight the importance of uninterrupted (i.e., regular) physical activity for sustaining AT and metabolic health.
GRANTS
Support for this project was provided by funds from the University of Missouri (MU) Research Council (to J. Padilla), Sears Trust Research Foundation (to J. Padilla), and National Heart, Lung, and Blood Institute (K01HL125503; to J. Padilla). Support for J. L. Rowles and T. L. Gaines was provided by the U.S. National Institutes of Health (NIH) Initiative for Maximizing Student Diversity (IMSD) EXPRESS Fellows Program (R25GM056901). Support for E. K. Anderson-Baucum was provided by the NIH Research Training Program in Diabetes and Obesity T32 (DK064466). Support for A. H. Hasty is provided by a Veterans Health Administration Merit Award (5I01BX002195) and by an American Heart Association Established Investigator Award (12EIA8270000).
DISCLOSURES
No conflicts of interest, financial or otherwise, are declared by the authors.
AUTHOR CONTRIBUTIONS
Author contributions: E.K.A-B., A.H.H., V.J.V-P., and J.P. conception and design of research; N.J.F., J.L.R., R.J.W., T.M.Z., Y-M.P., T.L.G., R.J.S., V.J.V-P., and J.P. performed experiments; K.S.W., E.K.A-B., and J.P. analyzed data; K.S.W., E.K.A-B., A.H.H., V.J.V-P., and J.P. interpreted results of experiments; EJ.P. prepared figures; K.S.W. and J.P. drafted manuscript; K.S.W., N.J.F., J.L.R., R.J.W., T.M.Z., Y-M.P., E.K.A-B., A.H.H., V.J.V-P., and J.P. edited and revised manuscript; K.S.W., N.J.F., J.L.R., R.J.W., T.M.Z., Y-M.P., T.L.G., R.J.S., E.K.A-B., A.H.H., V.J.V-P., and J.P. approved final version of manuscript.
REFERENCES
- 2.Anderson EK, Gutierrez DA, Kennedy A, Hasty AH. Weight cycling increases T-cell accumulation in adipose tissue and impairs systemic glucose tolerance. Diabetes 62: 3180–3188, 2013. [DOI] [PMC free article] [PubMed] [Google Scholar]
- 3.Badoud F, Perreault M, Zulyniak MA, Mutch DM. Molecular insights into the role of white adipose tissue in metabolically unhealthy normal weight and metabolically healthy obese individuals. FASEB J 29: 748–758, 2015. [DOI] [PubMed] [Google Scholar]
- 4.Bednarek-Tupikowska G, Stachowska B, Miazgowski T, Krzyzanowska-Swiniarska B, Katra B, Jaworski M, Kuliczkowska-Plaksej J, Jokiel-Rokita A, Tupikowska M, Bolanowski M, Jedrzejuk D, Milewicz A. Evaluation of the prevalence of metabolic obesity and normal weight among the Polish population. Endokrynol Pol 63: 447–455, 2012. [PubMed] [Google Scholar]
- 5.Bradley RL, Jeon JY, Liu FF, Maratos-Flier E. Voluntary exercise improves insulin sensitivity and adipose tissue inflammation in diet-induced obese mice. Am J Physiol Endocrinol Metab 295: E586–E594, 2008. [DOI] [PMC free article] [PubMed] [Google Scholar]
- 6.Bruun JM, Helge JW, Richelsen B, Stallknecht B. Diet and exercise reduce low-grade inflammation and macrophage infiltration in adipose tissue but not in skeletal muscle in severely obese subjects. Am J Physiol Endocrinol Metab 290: E961–E967, 2006. [DOI] [PubMed] [Google Scholar]
- 7.Company JM, Roberts MD, Toedebusch RG, Cruthirds CL, Booth FW. Sudden decrease in physical activity evokes adipocyte hyperplasia in 70- to 77-day-old rats but not 49- to 56-day-old rats. Am J Physiol Regul Integr Comp Physiol 305: R1465–R1478, 2013. [DOI] [PMC free article] [PubMed] [Google Scholar]
- 8.Crissey JM, Jenkins NT, Lansford KA, Thorne PK, Bayless DS, Vieira-Potter VJ, Rector RS, Thyfault JP, Laughlin MH, Padilla J. Adipose tissue and vascular phenotypic modulation by voluntary physical activity and dietary restriction in obese insulin-resistant OLETF rats. Am J Physiol Regul Integr Comp Physiol 306: R596–R606, 2014. [DOI] [PMC free article] [PubMed] [Google Scholar]
- 9.Delahanty LM, Pan Q, Jablonski KA, Aroda VR, Watson KE, Bray GA, Kahn SE, Florez JC, Perreault L, Franks PW. Effects of weight loss, weight cycling, and weight loss maintenance on diabetes incidence and change in cardiometabolic traits in the Diabetes Prevention Program. Diabetes Care 37: 2738–2745, 2014. [DOI] [PMC free article] [PubMed] [Google Scholar]
- 10.Fuster JJ, Zuriaga MA, Thi-Minh Ngo D, Farb MG, Aprahamian T, Yamaguchi TP, Gokce N, Walsh K. Non-canonical Wnt signaling promotes obesity-induced adipose tissue inflammation and metabolic dysfunction independent of adipose tissue expansion. Diabetes 64: 1235–1248, 2015. [DOI] [PMC free article] [PubMed] [Google Scholar]
- 11.Ginsberg HN, MacCallum PR. The obesity, metabolic syndrome, and Type 2 diabetes mellitus pandemic: part I. Increased cardiovascular disease risk and the importance of atherogenic dyslipidemia in persons with the metabolic syndrome and Type 2 diabetes mellitus. J Cardiometab Syndr 4: 113–119, 2009. [DOI] [PMC free article] [PubMed] [Google Scholar]
- 12.Hamm P, Shekelle RB, Stamler J. Large fluctuations in body weight during young adulthood and twenty-five-year risk of coronary death in men. Am J Epidemiol 129: 312–318, 1989. [DOI] [PubMed] [Google Scholar]
- 13.Jacobi D, Stanya KJ, Lee CH. Adipose tissue signaling by nuclear receptors in metabolic complications of obesity. Adipocyte 1: 4–12, 2012. [DOI] [PMC free article] [PubMed] [Google Scholar]
- 14.Karelis AD, St-Pierre DH, Conus F, Rabasa-Lhoret R, Poehlman ET. Metabolic and body composition factors in subgroups of obesity: what do we know? J Clin Endocrinol Metab 89: 2569–2575, 2004. [DOI] [PubMed] [Google Scholar]
- 15.Kawanishi N, Mizokami T, Yano H, Suzuki K. Exercise attenuates M1 macrophages and CD8+ T cells in the adipose tissue of obese mice. Med Sci Sports Exerc 45: 1684–1693, 2013. [DOI] [PubMed] [Google Scholar]
- 16.Kawanishi N, Yano H, Yokogawa Y, Suzuki K. Exercise training inhibits inflammation in adipose tissue via both suppression of macrophage infiltration and acceleration of phenotypic switching from M1 to M2 macrophages in high-fat-diet-induced obese mice. Exerc Immunol Rev 16: 105–118, 2010. [PubMed] [Google Scholar]
- 17.Kim JY, van de Wall E, Laplante M, Azzara A, Trujillo ME, Hofmann SM, Schraw T, Durand JL, Li H, Li G, Jelicks LA, Mehler MF, Hui DY, Deshaies Y, Shulman GI, Schwartz GJ, Scherer PE. Obesity-associated improvements in metabolic profile through expansion of adipose tissue. J Clin Invest 117: 2621–2637, 2007. [DOI] [PMC free article] [PubMed] [Google Scholar]
- 18.Laye MJ, Rector RS, Borengasser SJ, Naples SP, Uptergrove GM, Ibdah JA, Booth FW, Thyfault JP. Cessation of daily wheel running differentially alters fat oxidation capacity in liver, muscle, and adipose tissue. J Appl Physiol 106: 161–168, 2009. [DOI] [PMC free article] [PubMed] [Google Scholar]
- 19.Li P, Lu M, Nguyen MT, Bae EJ, Chapman J, Feng D, Hawkins M, Pessin JE, Sears DD, Nguyen AK, Amidi A, Watkins SM, Nguyen U, Olefsky JM. Functional heterogeneity of CD11c-positive adipose tissue macrophages in diet-induced obese mice. J Biol Chem 285: 15333–15345, 2010. [DOI] [PMC free article] [PubMed] [Google Scholar]
- 20.Linden MA, Pincu Y, Martin SA, Woods JA, Baynard T. Moderate exercise training provides modest protection against adipose tissue inflammatory gene expression in response to high-fat feeding. Physiol Rep 2: e12071, 2014. [DOI] [PMC free article] [PubMed] [Google Scholar]
- 21.Lira FS, Rosa JC, Yamashita AS, Koyama CH, Batista ML Jr, Seelaender M. Endurance training induces depot-specific changes in IL-10/TNF-alpha ratio in rat adipose tissue. Cytokine 45: 80–85, 2009. [DOI] [PubMed] [Google Scholar]
- 22.Manneras L, Jonsdottir IH, Holmang A, Lonn M, Stener-Victorin E. Low-frequency electro-acupuncture and physical exercise improve metabolic disturbances and modulate gene expression in adipose tissue in rats with dihydrotestosterone-induced polycystic ovary syndrome. Endocrinology 149: 3559–3568, 2008. [DOI] [PubMed] [Google Scholar]
- 23.Meigs JB, Wilson PW, Fox CS, Vasan RS, Nathan DM, Sullivan LM, D'Agostino RB. Body mass index, metabolic syndrome, and risk of Type 2 diabetes or cardiovascular disease. J Clin Endocrinol Metab 91: 2906–2912, 2006. [DOI] [PubMed] [Google Scholar]
- 24.Mikus CR, Rector RS, Arce-Esquivel AA, Libla JL, Booth FW, Ibdah JA, Laughlin MH, Thyfault JP. Daily physical activity enhances reactivity to insulin in skeletal muscle arterioles of hyperphagic Otsuka Long-Evans Tokushima Fatty rats. J Appl Physiol (1985) 109: 1203–1210, 2010. [DOI] [PMC free article] [PubMed] [Google Scholar]
- 24a.National Institutes of Health. Overweight and Obesity Statistics. Washington, DC: U.S. Department of Health and Human Services, and Bethesda, MD: National Institute of Diabetes and Digestive and Kidney Diseases, 2012, NIH Publication No. 04-4158. [Google Scholar]
- 25.Olsen RH, Krogh-Madsen R, Thomsen C, Booth FW, Pedersen BK. Metabolic responses to reduced daily steps in healthy nonexercising men. JAMA 299: 1261–1263, 2008. [DOI] [PubMed] [Google Scholar]
- 26.Osborn O, Olefsky JM. The cellular and signaling networks linking the immune system and metabolism in disease. Nat Med 18: 363–374, 2012. [DOI] [PubMed] [Google Scholar]
- 27.Padilla J, Jenkins NT, Roberts MD, Arce-Esquivel AA, Martin JS, Laughlin MH, Booth FW. Differential changes in vascular mRNA levels between rat iliac and renal arteries produced by cessation of voluntary running. Exp Physiol 98: 337–347, 2013. [DOI] [PMC free article] [PubMed] [Google Scholar]
- 28.Padilla J, Jenkins NT, Vieira-Potter VJ, Laughlin MH. Divergent phenotype of rat thoracic and abdominal perivascular adipose tissues. Am J Physiol Regul Integr Comp Physiol 304: R543–R552, 2013. [DOI] [PMC free article] [PubMed] [Google Scholar]
- 29.Peppa M, Koliaki C, Papaefstathiou A, Garoflos E, Katsilambros N, Raptis SA, Hadjidakis DI, Dimitriadis GD. Body composition determinants of metabolic phenotypes of obesity in nonobese and obese postmenopausal women. Obesity (Silver Spring) 21: 1807–1814, 2013. [DOI] [PubMed] [Google Scholar]
- 30.Reaven GM. Insulin resistance: the link between obesity and cardiovascular disease. Med Clin North Am 95: 875–892, 2011. [DOI] [PubMed] [Google Scholar]
- 31.Srere PA. Citrate synthase. Methods Enzymol 13: 3–5, 1969. [Google Scholar]
- 32.Stanford KI, Middelbeek RJ, Townsend KL, Lee MY, Takahashi H, So K, Hitchcox KM, Markan KR, Hellbach K, Hirshman MF, Tseng YH, Goodyear LJ. A novel role for subcutaneous adipose tissue in exercise-induced improvements in glucose homeostasis. Diabetes 64: 2002–2014, 2015. [DOI] [PMC free article] [PubMed] [Google Scholar]
- 33.Turner MJ, Kleeberger SR, Lightfoot JT. Influence of genetic background on daily running-wheel activity differs with aging. Physiol Genomics 22: 76–85, 2005. [DOI] [PubMed] [Google Scholar]
- 35.Vieira V, Valentine R, Wilund K, Antao N, Baynard T, Woods J. Effects of exercise and low-fat diet on adipose tissue inflammation and metabolic complications in obese mice. Am J Physiol Endocrinol Metab 296: E1164–E1171, 2009. [DOI] [PMC free article] [PubMed] [Google Scholar]
- 36.Vieira VJ, Valentine RJ, Wilund KR, Antao N, Baynard T, Woods JA. Effects of exercise and low-fat diet on adipose tissue inflammation and metabolic complications in obese mice. Am J Physiol Endocrinol Metab 296: E1164–E1171, 2009. [DOI] [PMC free article] [PubMed] [Google Scholar]
- 36a.Vieira-Potter VJ, Padilla J, Park YM, Welly RJ, Scroggins RJ, Britton SL, Koch LG, Jenkins NT, Crissey JM, Zidon T, Morris EM, Meers GM, Thyfault JP. Female rats selectively bred for high intrinsic aerobic fitness are protected from ovariectomy-associated metabolic dysfunction. Am J Physiol Regul Integr Comp Physiol 308: R530–R542, 2015. [DOI] [PMC free article] [PubMed] [Google Scholar]
- 37.Wang Z, Nakayama T. Inflammation, a link between obesity and cardiovascular disease. Mediators Inflamm 2010: 535918, 2010. [DOI] [PMC free article] [PubMed] [Google Scholar]
- 38.Waring ME, Eaton CB, Lasater TM, Lapane KL. Incident diabetes in relation to weight patterns during middle age. Am J Epidemiol 171: 550–556, 2010. [DOI] [PMC free article] [PubMed] [Google Scholar]
- 39.Wing RR, Hill JO. Successful weight loss maintenance. Annu Rev Nutr 21: 323–341, 2001. [DOI] [PubMed] [Google Scholar]