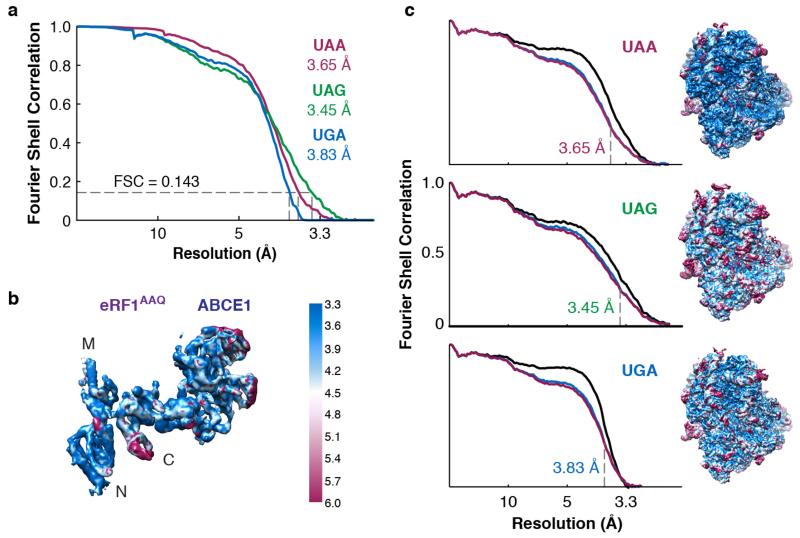
Extended Data Figure 3. Quality of maps and models.
a, Fourier shell correlation (FSC) curves for the EM maps of each termination complex containing the indicated stop codon. b, Isolated eRF1AAQ-ABCE1 density from the UAA termination complex map coloured by local resolution. c, Fit of models to maps. FSC curves calculated between the refined model and the final map (black), and with the self- (blue) and cross-validated (magenta) correlations for each stop codon complex. The EM map of each termination complex coloured by local resolution (as in panel b) is displayed next to the corresponding curves.

