

Upon ligand binding, the epidermal growth factor receptor (EGFR) activates signaling and undergoes endocytosis. EGFR signaling leading to Akt activation is impaired by perturbation of clathrin but not by inhibition of internalization through perturbation of dynamin. Clathrin may thus directly regulate receptor signaling at the cell surface.
Abstract
Epidermal growth factor (EGF) binding to its receptor (EGFR) activates several signaling intermediates, including Akt, leading to control of cell survival and metabolism. Concomitantly, ligand-bound EGFR is incorporated into clathrin-coated pits—membrane structures containing clathrin and other proteins—eventually leading to receptor internalization. Whether clathrin might regulate EGFR signaling at the plasma membrane before vesicle scission is poorly understood. We compared the effect of clathrin perturbation (preventing formation of, or receptor recruitment to, clathrin structures) to that of dynamin2 (allowing formation of clathrin structures but preventing EGFR internalization) under conditions in which EGFR endocytosis is clathrin dependent. Clathrin perturbation by siRNA gene silencing, with the clathrin inhibitor pitstop2, or knocksideways silencing inhibited EGF-simulated Gab1 and Akt phosphorylation in ARPE-19 cells. In contrast, perturbation of dynamin2 with inhibitors or by siRNA gene silencing did not affect EGF-stimulated Gab1 or Akt phosphorylation. EGF stimulation enriched Gab1 and phospho-Gab1 within clathrin structures. ARPE-19 cells have low ErbB2 expression, and overexpression and knockdown experiments revealed that robust ErbB2 expression bypassed the requirement for clathrin for EGF-stimulated Akt phosphorylation. Thus clathrin scaffolds may represent unique plasma membrane signaling microdomains required for signaling by certain receptors, a function that can be separated from vesicle formation.
INTRODUCTION
The epidermal growth factor (EGF) receptor (EGFR) is expressed in many tissues and has numerous functions during development and adulthood (Miettinen et al., 1995; Sibilia and Wagner, 1995; Sibilia et al., 1998; Threadgill et al., 1995; Olayioye et al., 2000; Iwamoto et al., 2003; Stern, 2003). EGF binding enhances asymmetric dimerization of the receptor, leading to enhanced kinase activity (Lemmon and Schlessinger, 2010). Ligand-bound, kinase-active EGFR triggers activation of signaling pathways that control many aspects of cell physiology, such as that leading to the phosphorylation and activation of Akt, which in turn controls cell metabolism and enhances cell survival and proliferation (Cantley, 2002; Vivanco et al., 2002).
Ligand binding to EGFR elicits phosphorylation of multiple tyrosine residues on the receptor’s C-terminus, which act as docking sites for proteins harboring pY-interacting domains such as SH2 or PTB (Pritchard et al., 2008). Phosphorylation of Y1068 on EGFR allows binding of Grb2. The adaptor protein Gab1 is essential for EGF-stimulated activation of Akt (Mattoon et al., 2004) and is recruited via its proline-rich domain (PRD) binding to the SH3 domain of Grb2 (Lock et al., 2000). Gab1 becomes phosphorylated upon EGF stimulation (Kiyatkin et al., 2006). Phosphatidylinositol-3-kinase (PI3K), which catalyzes the formation of phosphatidylinositol-(3,4,5)-trisphosphate (PIP3) from phosphatidylinositol-(4,5)-bisphosphate (PIP2), is recruited by its p85 regulatory subunit, binding directly to phosphorylated Gab1 (Holgado-Madruga et al., 1996; Mattoon et al., 2004) or via binding to other proteins recruited to phosphorylated Gab1 such as SHP2 (Wu et al., 2001). Thus Gab1 is required for EGF-stimulated PI3K activation and Akt phosphorylation (Mattoon et al., 2004).
PIP3 binds and recruits the kinases PDK1 and Akt, leading to Akt phosphorylation on T308 and S473 by PDK1 and mTORC2, respectively (Matheny and Adamo, 2009); both of these phosphorylation events are required for full Akt activation. Once activated at the plasma membrane, Akt redistributes to other cellular locales. Akt recruitment to early endosomes is mediated by binding to APPL1 and is required for Akt phosphorylation of glycogen synthase kinase 3 β (GSK3β) but not TSC2 or FOXO1 (Schenck et al., 2008; Zoncu et al., 2009); these and other Akt substrates regulate cell metabolism and survival. Hence a critical control point leading to Akt activation by EGF stimulation is activation of PI3K upon Gab1 phosphorylation.
Concomitant to activation of signaling pathways upon ligand binding, EGFR undergoes clathrin-mediated endocytosis (CME), the major mechanism of EGFR internalization in particular at low (<20 ng/ml) doses of EGF (Sigismund et al., 2008). CME of EGFR is initiated when the ligand-bound receptor is incorporated into invaginating clathrin-coated pits (CCPs). Clathrin and other proteins such as AP-2 assemble into CCPs by forming lattice structures on the inner leaflet of the plasma membrane. These clathrin assemblies function as protein scaffolds for recruitment of many additional cytosolic proteins, as well as of cell surface receptors (termed cargo). After membrane ingression and a poorly understood maturation process, the GTPase dynamin2 effects scission of some CCPs from the plasma membrane to yield intracellular clathrin-coated vesicles, allowing delivery of EGFR (and other receptor cargo) to endosomes. From endosomes, EGFR can either be targeted for degradation or recycle back to the plasma membrane (Sorkin and Goh, 2009), both of which occur ∼30 min to hours after ligand stimulation.
Because EGFR can sustain the phosphorylation of certain signaling pathways (e.g., mitogen-activated protein kinase [MAPK]) for up to hours after EGF stimulation, receptor signaling occurs from EGFR localized to either the plasma membrane or in endosomes (Wang et al., 2002; Pennock and Wang, 2003; Sorkin and von Zastrow, 2009; Platta and Stenmark, 2011). A seminal study by Vieira et al. (1996) found that inhibition of EGFR endocytosis by expression of a dominant-interfering dynamin mutant altered EGF-stimulated signaling, suggesting that EGFR may exhibit distinct signaling properties at the plasma membrane compared with that from endosomes. EGFR exhibits distinct phosphorylation or binding to signaling proteins when at the plasma membrane versus in endosomes (Wada et al., 1992; Burke et al., 2001). In contrast to these observations, studies using cells derived from dynamin-knockout mice (Sousa et al., 2012) or using the dynamin inhibitor dynasore (Omerovic et al., 2012) or dynamin gene silencing (Brankatschk et al., 2012) showed little effect of blocking scission of clathrin-coated pits from the plasma membrane on EGFR signaling. Hence differential EGFR signaling at the plasma membrane versus in endosomes occurs but may be context specific.
Maximal activation of the Gab1-PI3K-Akt axis occurs within ∼ 5 min of EGF stimulation (Borisov et al., 2009), a time during which much of the ligand-bound receptor resides in clathrin-coated structures at the plasma membrane. Although several studies examined the distinct signaling properties of EGFR localized at the plasma membrane versus in endosomes, EGFR may instead preferentially reside within a distinct microenvironment contained within clathrin structures at the plasma membrane at the time of activation of the Gab1-PI3K-Akt pathway. Clathrin-coated membrane microdomains have indeed been proposed to function as signaling platforms important for the activation of Gαi protein signaling by the delta opioid receptor (Elenko et al., 2003). The possible role of clathrin in the direct regulation of EGFR signaling at the plasma membrane is poorly understood.
EGFR is a member of the ErbB family of receptor tyrosine kinases (RTKs), which includes ErbB2–4. ErbB receptors can form homodimers or heterodimers, thereby greatly increasing the complexity of signaling and heterogeneity of cellular responses as a result of relative expression of ErbBs (Alroy and Yarden, 1997). For instance, whereas ErbB2 does not bind EGF itself, ErbB2-EGFR heterodimers are readily activated by EGF stimulation. ErbB2, but not EGFR, binds to the nonreceptor tyrosine kinase c-Src directly through an interaction between catalytic domains (Kim et al., 2005; Marcotte et al., 2009). This selective interaction of c-Src and ErbB2 contributes to cellular transformation achieved by expression of ErbB2 that is not observed upon similar expression of wild-type EGFR (Kim et al., 2005; Marcotte et al., 2009). Hence coexpression of ErbB2 results in distinct potency for EGF stimulation to elicit activation of nonreceptor tyrosine kinases. Whether ErbB2 coexpression alters the requirement of EGFR for clathrin in signaling elicited by EGF stimulation has not been examined.
In the present study, we examine the contribution of clathrin to the direct regulation of EGFR signaling at the plasma membrane leading to Akt activation. We compare the effects of pharmacological and molecular perturbation of clathrin (which prevents formation of clathrin structures at the plasma membrane and/or recruitment of receptors therein) to that of dynamin2 (which allows formation of clathrin structures at the plasma membrane containing signaling receptors but not their scission; Elenko et al., 2003). Both treatments blocked EGFR internalization. Clathrin perturbation, but not that of dynamin2, inhibited EGF-stimulated Akt activation, indicating that clathrin has a role in regulating EGFR signaling at the plasma membrane that is not the consequence of the function of clathrin in promoting receptor internalization. We find different requirements for clathrin in the signaling elicited by EGFR upon coexpression of ErbB2, suggesting that clathrin may selectively regulate a subset of ErbB signaling profiles.
RESULTS
Inhibition of clathrin but not of dynamin2 reduces EGF-stimulated Akt phosphorylation in ARPE-19 cells
The peak phosphorylation of Akt occurs within the first ∼5 min of EGF stimulation (Borisov et al., 2009), which coincides with the residence of ligand-bound EGFR within clathrin structures at the plasma membrane. We first examined the requirement for clathrin in ARPE-19 cells. To determine whether clathrin is required for EGF-stimulated Akt phosphorylation, we silenced clathrin heavy chain (CHC) using small interfering RNA (siRNA; Supplemental Figure S1A), obtaining an 81.4 ± 4.4% (n = 9) reduction in CHC protein levels. As expected, siRNA gene silencing of CHC resulted in robust reduction in the internalization of EGFR, a ligand-stimulated cargo receptor of CME (Figure 1A).
FIGURE 1:

SiRNA gene silencing of clathrin heavy chain but not of dynamin2 inhibits EGF-stimulated Akt phosphorylation in ARPE-19 cells. ARPE-19 cells were transfected with siRNA targeting clathrin heavy chain sequence 1 (clathrin siRNA 1), clathrin heavy chain sequence 2 (clathrin siRNA 2), dynamin2, or nontargeting siRNA (control). (A) EGF internalization was measured using 5 ng/ml EGF in cells transfected as indicated; mean ± SE of EGF internalized (n = 3); *p < 0.05 relative to the corresponding control condition. (B–E) After transfection, cells were stimulated with 5 ng/ml EGF or left unstimulated (basal), and whole-cell lysates were prepared and resolved by immunoblotting and probed with anti–phospho-Akt (pS473), anti–total pan-Akt, or anti–pan-actin antibodies. (B) Immunoblots representative of at least five independent experiments. (C–E) Means ± SE of pS473-Akt values; n = 12 (C), 7 (D), 7 (E); *p < 0.05 relative to control, EGF-stimulated condition. (F, G) After siRNA transfection, intact cells were subjected to immunofluorescence microscopy with antibodies that selectively recognize the EGFR ectodomain. (F) Representative fluorescence microscopy micrographs of cell surface EGFR staining. Scale, 20 μm. (G) Fluorescence intensity of cell-surface EGFR was quantified; mean cell-surface EGFR levels (n = 4).
Of importance, silencing of CHC resulted in a reduction of EGF-stimulated Akt phosphorylation (Figure 1, B and C). Similar results were obtained with a distinct CHC siRNA sequence (Figure 1D and Supplemental Figure S1, B and C). Perturbation of CHC might affect EGF-stimulated Akt phosphorylation as a result of a direct requirement for clathrin in EGFR signaling at the plasma membrane or as a consequence of perturbing endosome-specific EGFR signaling or traffic. To distinguish between these possibilities, we silenced expression of dynamin2 by siRNA, achieving an 89.9 ± 3.0% (n = 4) reduction in dynamin2 protein level (Supplemental Figure S1A). Silencing of dynamin2 caused inhibition of EGFR internalization indistinguishable from that achieved by CHC silencing (Figure 1A). CHC and dynamin2 silencing resulted in a similar inhibition of transferrin (Tfn) receptor internalization, which internalizes exclusively through clathrin-dependent endocytosis (Supplemental Figure S1D), as was observed for EGFR internalization (Figure 1A). This suggests that clathrin-dependent EGFR internalization to endosomes was perturbed to a similar extent by CHC and dynamin2 silencing and that any remaining EGFR internalization in silenced cells was due to incomplete perturbation of CME.
In contrast to the effect of silencing of CHC, silencing of dynamin2 had no effect on EGF-stimulated Akt phosphorylation (Figure 1, B and E). This suggests that the inhibition of EGF-stimulated Akt phosphorylation upon CHC silencing is not due to the requirement for clathrin-dependent EGFR internalization to endosomes. Silencing of neither CHC nor dynamin2 affected cell surface EGFR levels before EGF stimulation, as measured by labeling of intact cells with an anti-EGFR antibody (Figure 1, F and G) and by cell surface EGF binding (Supplemental Figure S1E). Hence the reduction of EGF-stimulated Akt phosphorylation observed upon CHC silencing was not the result of alterations in the pool of EGFR exposed to ligand within the extracellular milieu. Collectively these results suggest a direct role for clathrin in EGFR signaling at the plasma membrane.
To complement the siRNA gene silencing of CHC with an independent approach to perturb clathrin function, we used the small-molecule inhibitor of clathrin pitstop2. Treatment of cells with 10 μM pitstop2 prevents binding of endocytic accessory proteins to the clathrin heavy chain N-terminal domain and thus depletes clathrin lattices of some but not all interacting proteins (von Kleist et al., 2011). Note that additional, off-target effects can be seen upon treatment with higher concentrations of pitstop2 (30 μM; Willox et al., 2014). Thus we used perturbation of clathrin function at lower concentration (10 μM) pitstop2 to limit off-target effects. As previously reported (von Kleist et al., 2011), cells treated with 10 μM pitstop2 exhibited robust inhibition of EGF internalization (Figure 2A). Further, ARPE-19 cells treated with 10 μM pitstop2 exhibited blunted recruitment of fluorescent EGF (A555-EGF) to clathrin structures (Figure 2, B and D) relative to that observed in control cells. Whereas previous studies showed that pitstop2 does not affect recruitment of fluorescent EGF to clathrin-coated pits (von Kleist et al., 2011), those measurements were done by treating cells with fluorescent EGF for 30 min at 8°C, a condition that maximizes EGF recruitment to clathrin-coated pits (Sorkina et al., 2002). Our experiments show that when performed at 37°C, pitstop2 treatment blunts recruitment of EGF (and thus EGFR) to plasma membrane clathrin structures in addition to or as a consequence of hindering the recruitment of certain cytosolic proteins to clathrin scaffolds (von Kleist et al., 2011). Thus this strategy is an effective complement to siRNA silencing experiments (Figure 1) for studying the effect of perturbing EGFR recruitment to clathrin-coated pits on receptor signaling.
FIGURE 2:

Treatment of ARPE-19 cells with the clathrin inhibitor pitstop2 but not the dynamin inhibitor dynasore or dyngo4A inhibits EGF localization to clathrin structures and EGF-stimulated Akt phosphorylation. ARPE-19 cells were treated with 10 μM pitstop2, 30 μM dyngo4A, 80 μM dynasore, or vehicle control (0.1% [vol/vol] DMSO) for 30 min. (A) After drug treatment, EGF internalization was measured using 5 ng/ml EGF in cells transfected as indicated; mean ± SE of EGF internalized (n = 4), *p < 0.05 relative to the corresponding control condition. (B–D) After drug treatment as indicated in ARPE-19 cells stably expressing GFP fused to clathrin light chain (GFP-CLC), cells were stimulated with A555-EGF (5 ng/ml) for 3 min at 37°C, followed immediately by fixation and then imaging using TIRFM. (B, C) Representative micrographs showing regions of larger images depicting whole cells, which are shown in Supplemental Figure S2, A and B. Scale bar, 5 μm. (D) Micrographs obtained by TIRFM were subjected to automated detection of clathrin structures as in Aguet et al. (2013; see Materials and Methods), followed by quantification of A555-EGF fluorescence intensity within each detected object. Mean A555-EGF fluorescence intensity measurements within clathrin structures in each image (>10,000 clathrin structures from >50 cells from three independent experiments; *p < 0.05). (E, F) After drug treatment, cells were stimulated with 5 ng/ml EGF for an additional 5 min in the continued presence of the inhibitors or left unstimulated (basal). Subsequently whole-cell lysates were immediately prepared and resolved by immunoblotting and probed with anti–phospho-Akt (S473) or total pan-Akt antibodies. (E) Immunoblots representative of at least five independent experiments. (F) Mean ± SE of pS473-Akt values (n = 5); *p < 0.05, relative to control, EGF-stimulated condition.
Of importance, cells treated with 10 μM pitstop2 ablated EGF-stimulated Akt phosphorylation (Figure 2, E and F). Pitstop2 exhibited similar dose-dependent inhibition of EGF-stimulated Akt phosphorylation as reported for clathrin-mediated endocytosis of EGFR (von Kleist et al., 2011), with nearly complete inhibition of both at 5 μM pitstop2 (Supplemental Figure S2, C and D). This is consistent with the effect of pitstop2 treatment on EGF-stimulated Akt phosphorylation being the result of direct inhibition of clathrin by pitstop2.
In contrast to the effect of pitstop2, the dynamin inhibitors dynasore and dyngo4A (hydroxylated dynasore) had little effect on EGF-stimulated Akt phosphorylation (Figure 2, E and F). However, both dynasore and dyngo4A inhibited EGF internalization to a similar extent as pitstop2 (Figure 2A). Of note, treatment of cells with dynasore did not inhibit recruitment of fluorescent EGF to clathrin structures (Figure 2, C and D), indicating that whereas pharmacological inhibition of dynamin impaired EGFR internalization, it did not prevent recruitment of the receptor to plasma membrane clathrin structures. Dyngo4a treatment also increased Akt phosphorylation in the absence of EGF stimulation (Figure 2, E and F), which was not seen with any other drug treatment or siRNA condition. Taken together, these results indicate that EGFR signaling at the plasma membrane leading to Akt phosphorylation requires clathrin, whereas receptor internalization from the plasma membrane via CME is dispensable for this.
Knocksideways silencing was developed as an effective method of perturbing various proteins that combines high specificity with acute perturbation (Robinson et al., 2010; Cheeseman et al., 2013). Briefly, knocksideways silencing exploits the rapamycin-inducible binding of the FRB domain of mammalian target of rapamycin with the FKBP domain of FKBP12. To validate the results of the siRNA and pharmacological approaches, we used a previously described strategy of knocksideways silencing of clathrin light chain (Cheeseman et al., 2013). Overexpressed clathrin light chain (CLC) with either an N- or a C-terminal protein fusion binds stably with a nearly 1:1 stoichiometry to clathrin heavy chain, and, of importance, does not alter clathrin function as assessed by efficiency of endocytosis (Aguet et al., 2013). Although CLC expression is largely dispensable for receptor endocytosis, when expressed in cells, CLC can be readily and efficiently coimmunoprecipitated with CHC (Aguet et al., 2013), showing that CLC and CHC have a stable interaction. Thus experimental rerouting of CLC will also result in sequestration of CHC. CLC fused to green fluorescent protein and the FKBP heterodimerization domain (GFP-FKBP-CLCa) was cotransfected into cells along with the mitochondria-targeted FRB heterodimerization domain (pMito-mCherry-FRB; henceforth MitoTrap; Cheeseman et al., 2013). Indeed, whereas cells expressing these proteins exhibit normal CHC and CLC localization in the absence of rapamycin, addition of this drug results in robust sequestration of both CLC and CHC to the surface of the mitochondria, thereby inhibiting clathrin-dependent processes elsewhere in the cell (Supplemental Figure S3A).
To determine whether perturbation of CHC by knocksideways silencing affected EGF-stimulated Akt phosphorylation, we cotransfected these constructs and detected Akt phosphorylation in individual cells by immunofluorescence staining using an anti–phospho-Akt (pS473) antibody. On treatment with rapamycin, cells transfected with both GFP-FKBP-CLCa and MitoTrap exhibited 42.6 ± 14.1% reduction in the EGF-stimulated gain in Akt phosphorylation compared with control, rapamycin-treated cells (n = 3, p < 0.05; Figure 3). In contrast, in the absence of rapamycin (i.e., without sequestration of CLC/CHC to mitochondria), cells transfected with both GFP-FKBP-CLCa and MitoTrap constructs exhibited EGF-stimulated Akt phosphorylation that was indistinguishable from that of control cells (Supplemental Figure S3, B and C).
FIGURE 3:
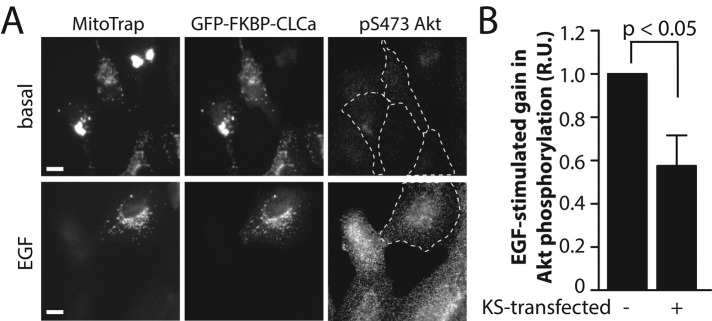
Knocksideways silencing of clathrin light chain reduces EGF-stimulated Akt phosphorylation in ARPE-19 cells. ARPE-19 cells were cotransfected with cDNA encoding MitoTrap (pMito-mCherry-FRB) or GFP-FKBP-CLCa, after which cells were treated with 1 μM rapamycin for 10 min or left untreated (Supplemental Figure S3) and then stimulated with 5 ng/ml EGF for an additional 5 min in the continued presence of rapamycin. After this, cells were fixed and processed for immunofluorescence staining using anti–phospho-Akt (pS473)-specific antibodies. (A) Representative micrographs; scale bar, 20 μm. (B) Mean fluorescence intensity of phospho-Akt (pS473) staining was quantified in cells expressing both MitoTrap and GFP-FKBP-CLCa (KS transfected +) or only one of these exogenous fluorescent proteins (KS transfected –). Mean ± SE of EGF-stimulated gain in phospho-Akt (pS473) levels (n = 3).
These findings show that perturbation of clathrin by siRNA gene silencing, by a small- molecule inhibitor of clathrin, or by knocksideways silencing of CLC/CHC inhibits EGF-stimulated Akt phosphorylation. In contrast, inhibition of EGFR internalization from the plasma membrane by other means—through the perturbation of dynamin2 by either siRNA gene silencing or small-molecule inhibitors—had no effect on EGF-stimulated Akt phosphorylation. Taken together, these results suggest that clathrin is required for EGFR signaling leading to Akt phosphorylation at the plasma membrane and that this requirement for clathrin can be functionally separated from the role of clathrin in endocytosis of EGFR.
Clathrin is not required for EGF-stimulated EGFR phosphorylation in ARPE-19 cells
On ligand binding, EGFR undergoes autophosphorylation, which leads to a phospho-relay signal transduction pathway that results in Akt phosphorylation (Mattoon et al., 2004). To identify the molecular event(s) within this phospho-relay that require clathrin, we first examined the effect of clathrin perturbation on EGF-stimulated EGFR phosphorylation. EGF-stimulated phosphorylation of the major tyrosine residue required for binding of Grb2 (pY1068) was not affected by treatment with pitstop2 or dyngo4A (Figure 4A), although dyngo4A did elicit an increase in phosphorylation of this residue in the absence of EGF simulation. In addition to Y1068, there are many other tyrosine residues that undergo either autophosphorylation or phosphorylation by another kinase upon EGFR ligand binding (Pritchard et al., 2008). Consistent with the lack of effect of pitstop2 on EGF-stimulated phosphorylation of EGFR on Y1068, ligand-stimulated phosphorylation of EGFR on Y1086, Y845, Y1173, and Y1045 was unaffected by pitstop2 treatment (Figure 4B). These results indicate that inhibition of clathrin by pitstop2 ablated EGF-stimulated Akt phosphorylation at a stage in the signaling pathway downstream of EGFR phosphorylation.
FIGURE 4:
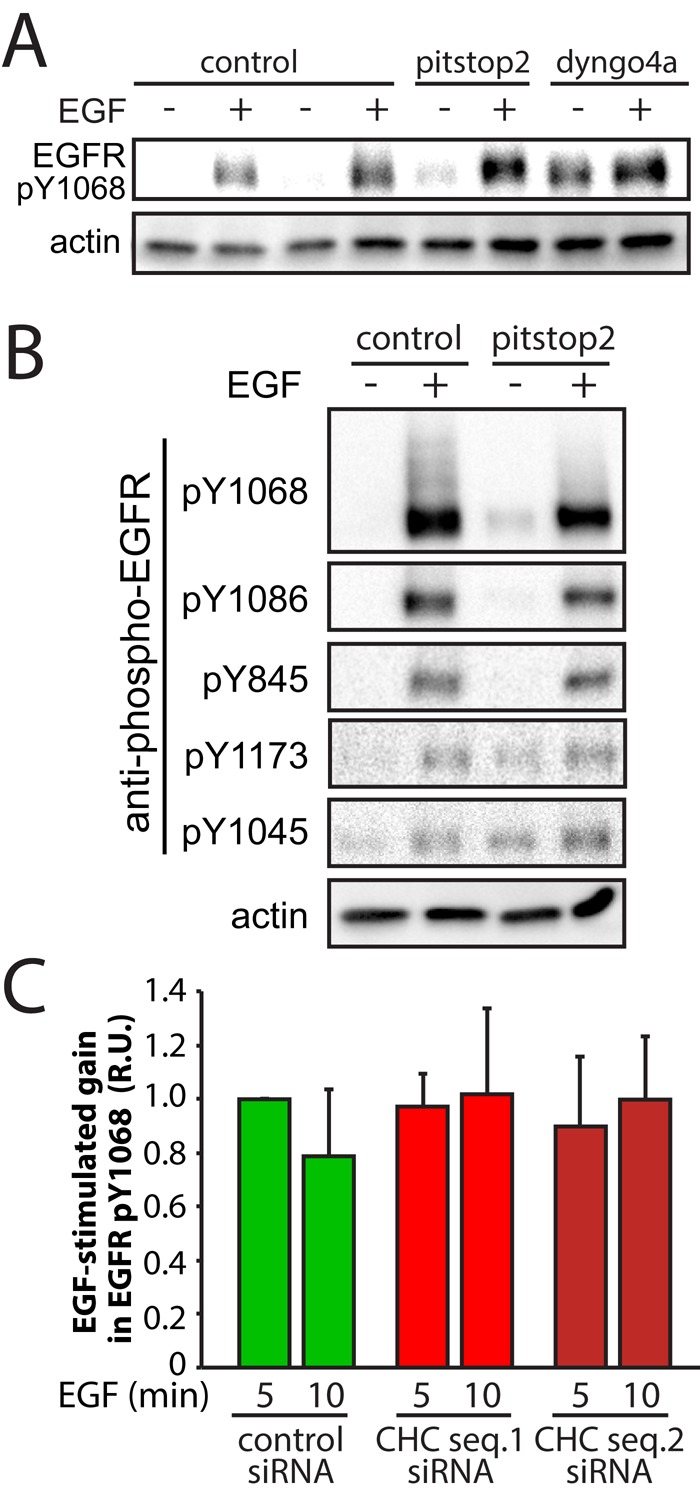
Perturbation of clathrin by pitstop2 treatment or siRNA gene silencing does not alter EGF-stimulated EGFR phosphorylation in ARPE-19 cells. (A, B) ARPE-19 cells were treated with 10 μM pitstop2, 30 μM dyngo4A, or vehicle control (0.1% [vol/vol] DMSO) for 30 min. After drug treatment, cells were stimulated with 5 ng/ml EGF for an additional 5 min, in the continued presence of the inhibitors, or left unstimulated (basal). Whole-cell lysates were then immediately prepared, resolved by immunoblotting, and probed with anti–phospho-EGFR or anti-actin antibodies. (A) A sample immunoblot probed with anti–phospho-EGFR (pY1068) and anti-actin antibodies, representative of three independent experiments. (B) Sample immunoblots probed with anti–phospho-EGFR (recognizing pY1068, pY1086, pY845, pY1173, or pY1045 motifs), representative of three independent experiments. (C) ARPE-19 cells were transfected with siRNA targeting clathrin heavy chain sequence 1(CHC seq. 1) or sequence 2 (CHC seq. 2) or nontargeting siRNA (control). After transfection, cells were stimulated with 5 ng/ml EGF or left unstimulated (basal) and then fixed and processed for immunofluorescence staining with anti–phospho-EGFR (pY1068) antibodies. Mean ± SE of the EGF-stimulated gain in phospho-EGFR (pY1068; n = 3, minimum 20 cells per condition per experiment). Representative micrographs are shown in Supplemental Figure S4.
We next examined the effect of siRNA gene silencing of CHC on EGF-stimulated EGFR Y1068 phosphorylation. We detected EGFR pY1068 in individual cells by immunofluorescence microscopy using antibodies that specifically recognize EGFR only when phosphorylated at Y1068. This assay was advantageous, as it not only allowed transfection of smaller amounts of cells than required for Western blotting, it also allowed detection of both the localization and total intensity of phosphorylated EGFR. Silencing of CHC by either of two siRNA sequences, conditions that each resulted in an inhibition of EGF-stimulated Akt phosphorylation (Figure 1, B–D, and Supplemental Figure S1D), had no effect on the gain in EGFR pY1068 stimulated by EGF (Figure 4C and Supplemental Figure S4A). Furthermore, EGF-stimulated phosphorylation of p42/44 MAPK was unaffected by either CHC or dynamin2 silencing (Supplemental Figure S4B), further indicating that EGF-stimulated EGFR phosphorylation is unaffected by perturbation of clathrin or dynamin2. Collectively our findings indicate that clathrin is not required for ligand-induced EGFR phosphorylation but is required for EGF-stimulated Akt phosphorylation at a stage subsequent to receptor phosphorylation.
Clathrin is required for EGF-stimulated Gab1 phosphorylation in ARPE-19 cells
Ligand-dependent EGFR phosphorylation at Y1068 and Y1173 results in the recruitment of Grb2 and Shc, respectively (Kiyatkin et al., 2006). This in turn leads to the recruitment of Gab1 to the membrane via binding to Grb2. Gab1 is phosphorylated on many tyrosine residues, which then allows binding and activation of additional signaling components. Gab1 phosphorylation at Y447, Y472, and Y589 leads to direct recruitment and activation of PI3K. Phosphorylation of Gab1 Y627 recruits SHP2, which can enhance PI3K recruitment and thus potentiate PI3K-Akt signaling (Wu et al., 2001), although SHP2 binding also yields Gab1 dephosphorylation to terminate signaling (Gu and Neel, 2003). To determine whether clathrin is required for Gab1 phosphorylation, we examined the effect of clathrin perturbation on the EGF-stimulated Gab1 phosphorylation of Y307 and Y627. Treatment of cells with pitstop2 resulted in inhibition of EGF-stimulated levels of both Gab1 pY307 and pY627 (Figure 5A). Quantification of pY627 levels revealed that in the presence of pitstop2, EGF-stimulated Gab1 phosphorylation was reduced by 71.42 ± 12.3% (n = 4, p < 0.05; Figure 5B). In contrast, treatment of ARPE-19 cells with the dynamin inhibitor dynasore or dyngo4A was without effect on EGF-stimulated EGFR (pY1068), Gab1 (pY627), or Akt (pS473) phosphorylation (Supplemental Figure S5). Together these results indicate that Gab1 phosphorylation is sensitive to clathrin perturbation by pitstop2 treatment but not inhibition of EGFR endocytosis by dynamin inhibitors.
FIGURE 5:

Perturbation of clathrin by pitstop2 treatment or siRNA gene silencing inhibits EGF-stimulated Gab1 phosphorylation in ARPE-19 cells. (A, B) ARPE-19 cells were treated with 10 μM pitstop2 or vehicle control (0.1% [vol/vol] DMSO) for 30 min. After drug treatment, cells were stimulated with 5 ng/ml EGF for 5 min in the continued presence of the inhibitors or left unstimulated (basal). Whole-cell lysates were then immediately prepared and resolved by immunoblotting and probed with anti–phospho-Gab1 (pY627) or anti-actin antibodies. (A) Immunoblots representative of three independent experiments. (B) Mean ± SE of pY627-Gab1 values (n = 4); *p < 0.05 (C) ARPE-19 cells were transfected with cDNA encoding the p85 subunit of class I PI3K fused to GFP (p85-GFP) and then treated with 10 μM pitstop2 or vehicle control (0.1% [vol/vol] DMSO) for 30 min. After drug treatment, cells were stimulated with 5 ng/ml EGF for an additional 5 min in the continued presence of the inhibitors or left unstimulated (basal), followed by fixation and fluorescence microscopy. Left, representative fluorescence micrographs. Scale, 10 μm. Right, density of GFP-p85 puncta detected by automated image analysis in individual cells (diamonds) and the means ± SE of these measurements in each condition (n = 4); *p < 0.05. (D) ARPE-19 cells were transfected with siRNA targeting clathrin heavy chain sequence 1 (CHC seq. 1), dynamin2 (dyn2), or nontargeting siRNA (control). After transfection, cells were stimulated with 5 ng/ml for 5 min EGF or left unstimulated (basal), and whole-cell lysates were prepared and resolved by immunoblotting and probed with anti–phospho-Gab1 (pY627) or anti-actin antibodies.
To determine whether the inhibition of Gab1 phosphorylation affected the membrane recruitment and activation of PI3K, we detected the localization of the p85 subunit of PI3K fused to GFP (GFP-p85), which localizes to puncta selectively upon EGF stimulation (Gillham, 1999). GFP-p85 exhibited diffuse localization in cells not stimulated with EGF, consistent with localization of this probe to the cytoplasm (Figure 5C, left). On EGF stimulation, GFP-p85 was recruited to puncta, reflecting the binding of GFP-p85 to phosphorylated p85-binding motifs (Luo et al., 2005; Figure 5C, middle). Of importance, in pitstop2-treated cells, EGF stimulation did not result in recruitment of GFP-p85 to punctate structures (Figure 5C, right). We subjected these images to automated analysis to systematically detect the number of GFP-p85 puncta within cells (Aguet et al., 2013). This quantitative analysis confirms that pitstop2 treatment ablates the ability of EGF to elicit formation of GFP-p85 puncta (three independent experiments, >10 cells/experiment, p < 0.05). Because Gab1 is required for EGF-stimulated activation of PI3K and Akt activation, these results suggest that EGF-stimulated phosphorylation of Gab1 at multiple residues, including at pY motifs required for PI3K recruitment, requires clathrin but not EGFR endocytosis.
We next examined whether siRNA gene silencing of clathrin similarly perturbed EGF-stimulated Gab1 Y627 phosphorylation. Indeed, silencing of CHC, but not of dynamin2, resulted in inhibition of EGF-stimulated Gab1 Y627 phosphorylation (Figure 5D). Collectively these results show that clathrin, but not receptor endocytosis, is required for EGF-stimulated Gab1 phosphorylation and suggest that Gab1 phosphorylation may be the most receptor-proximal clathrin-dependent event in the EGFR-Gab1-PI3K-Akt signaling axis.
Gab1 is enriched within clathrin-coated pits upon EGF stimulation in ARPE-19 cells
The requirement for clathrin for EGF-stimulated Gab1 phosphorylation suggests that Gab1 phosphorylation may occur preferentially within clathrin structures at the plasma membrane. To determine whether Gab1 is enriched within clathrin structures upon EGF stimulation, we expressed Gab1 fused to GFP (GFP-Gab1) in ARPE-19 cells stably expressing red fluorescent protein (RFP)–CLC (Aguet et al., 2013) and subjected these fixed cell samples to dual-color total internal reflection fluorescence microscopy (TIRFM). Unstimulated (basal) cells exhibited largely diffuse GFP-Gab1 fluorescence, whereas cells stimulated with 5 ng/ml EGF for 3 min exhibited GFP-Gab1 fluorescence in punctate structures, some of which can be seen to overlap with clathrin structures (Figure 6A).
FIGURE 6:
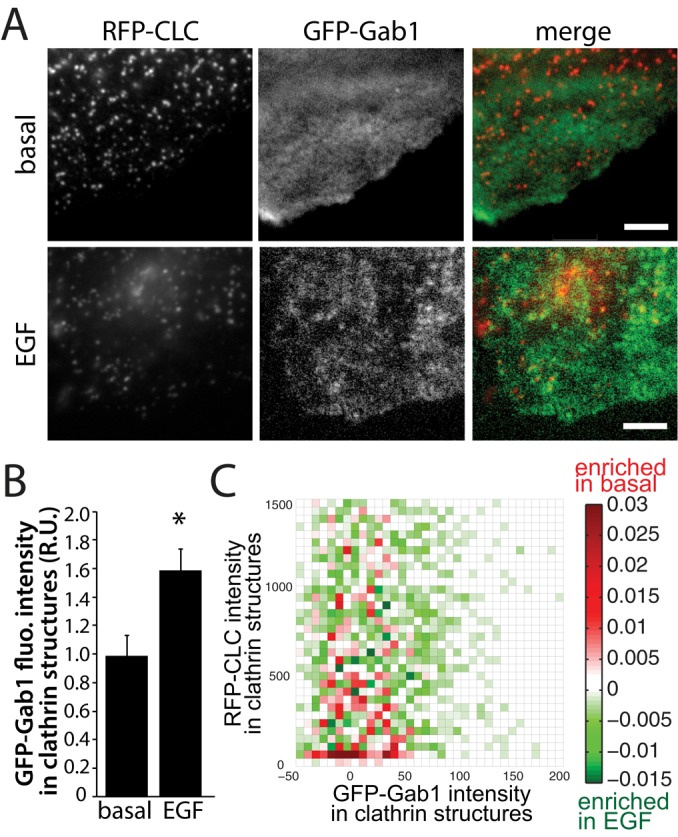
Gab1 is enriched within plasma membrane clathrin structures upon EGF stimulation in ARPE-19 cells. ARPE-19 cells stably expressing Tag-RFP-T-CLC (RFP-CLC) were transfected with GFP fused to Gab1 (GFP-Gab1). Cells were then stimulated with 5 ng/ml EGF for 3 min or left unstimulated (basal) and then fixed and imaged using TIRFM). (A) Representative micrographs; scale bar, 5 μm. (B) Micrographs obtained by TIRFM were subjected to automated detection of clathrin structures as in Aguet et al. (2013; see Materials and Methods, followed by quantification of GFP-Gab1 and RFP-CLC in each detected object. (B) Mean GFP-Gab1 fluorescence intensity detected within all clathrin structures in each image (>10,000 structures from >45 cells from four independent experiments; *p < 0.05). (C) The 2D histogram of the difference in GFP-Gab1 and RFP-CLC intensity frequencies between basal and EGF-stimulated cells; also see Materials and Methods. Bins shown in green indicate RFP-CLC and GFP-Gab1 fluorescence intensity ranges within detected clathrin structures that are more frequently detected in EGF-stimulated cells, and bins shown in red indicate RFP-CLC and GFP-Gab1 fluorescence intensity ranges more frequently detected in basal cells.
Although visual examination of fluorescence images can be informative, systematic and unbiased quantification is required to determine whether GFP-Gab1 is indeed enriched within clathrin structures upon EGF stimulation. Computational tools have been recently developed to automatically detect and analyze diffraction-limited clathrin structures using a Gaussian-based modeling approach; these tools have been validated and used to obtain systematic measurement of parameters such as fluorescence intensities of proteins recruited to clathrin structures (Aguet et al., 2013). This analysis allows detection of the enrichment of fluorescence signals within clathrin structures relative to local background and thus provides information about the selective recruitment of specific proteins to clathrin structures relative to adjacent areas (Aguet et al., 2013). We used this method to quantify the recruitment of GFP-Gab1 fluorescence to clathrin structures upon EGF stimulation. The mean GFP-Gab1 fluorescence in automatically detected clathrin structures indeed increased by 57% upon treatment with 5 ng/ml EGF (>10,000 clathrin structures detected from >50 cells from five independent experiments, p < 0.05; Figure 6B). This indicates that GFP-Gab1 is indeed enriched within clathrin structures at the plasma membrane upon EGF stimulation.
To gain insight into how Gab1 becomes enriched within clathrin structures upon EGF stimulation, we quantified how the EGF-stimulated increase in GFP-Gab1 fluorescence within detected structures scaled with that of clathrin fluorescence. Clathrin structures at the plasma membrane are heterogeneous in size, as seen by the fluorescence intensity of clathrin within these diffraction-limited objects, as previously reported (Aguet et al., 2013). We generated a differential two-dimensional (2D) histogram: a plot of the difference in frequency of structures detected of each specific range of GFP-Gab1 and RFP-CLC fluorescence intensities between control and EGF-stimulated cells (Figure 6C). Within this 2D histogram, bins depicted in green represent ranges of GFP-Gab1 and RFP-CLC fluorescence intensities of clathrin structures detected at a higher frequency upon EGF stimulation. Red bins represent fluorescence intensity ranges within structures detected at a lower frequency upon EGF stimulation. Consistent with the observation that EGF stimulation increases the mean GFP-Gab1 fluorescence within clathrin structures (Figure 6B), EGF stimulation increases the abundance of clathrin structures containing higher levels of Gab1 while reducing the abundance of clathrin structures harboring low, near- background levels of Gab1 intensity (Figure 6C). Of interest, the recruitment of GFP-Gab1 to clathrin structures does not appear to scale with RFP-CLC fluorescence intensity. This suggests that the enrichment of Gab1 within clathrin structures upon EGF stimulation requires complex interaction(s) and that Gab1 is enriched within both small and large clathrin structures.
Because EGF-stimulated Gab1 phosphorylation (Figure 5) is inhibited upon clathrin perturbation, we next sought to determine whether phosphorylated Gab1 was also enriched within plasma membrane clathrin structures. To do so, we performed immunofluorescence labeling of cells expressing RFP-CLC using antibodies that specifically recognize endogenous Gab1 phosphorylated on Y627 (pGab1), followed by imaging by TIRFM. In unstimulated cells, a number of pGab1 puncta are observed, but these could not be readily seen to overlap with clathrin structures (Figure 7A). In contrast, upon EGF stimulation, a number of clathrin structures overlap with pGab1 puncta (Figure 7A, arrows). The enrichment of pGab1 within clathrin structures was quantified similarly to that of GFP-Gab1 and indicated that EGF stimulation elicited a 2.3-fold increase in pGab1 signal intensity within clathrin structures (Figure 7B). As noted earlier, this analysis uses a Gaussian modeling approach to systematically quantify signal intensity within detected objects; thus detection of pGab1 within clathrin objects represents enrichment of pGab1 within clathrin structures relative to adjacent areas of the TIRFM image. To determine the proportion of pGab1 signal detected within clathrin structures that was due to random overlap of punctate structures in an image, we generated an image set in which the pGab1 channel was shifted by at least 20 pixels, thereby scrambling the positions of the pGab1 signal relative to that of clathrin. Quantification of pGab1 signal within these pGab1-scrambled images revealed similar pGab1 intensity in EGF stimulated cells to that in basal cells (Figure 7B). This confirms that the EGF-stimulated enrichment of pGab1 within clathrin structures is specific and selective and does not occur simply as a result of random overlap of dense punctate structures. Further, a differential 2D histogram of clathrin and pGab1 intensities within clathrin structures revealed that EGF stimulation elicited an increase in clathrin structures harboring high levels of pGab1 (Figure 7C). This suggests that the EGF-stimulated enrichment of pGab1 within clathrin structures is similar to or may exceed that of GFP-Gab1.
FIGURE 7:
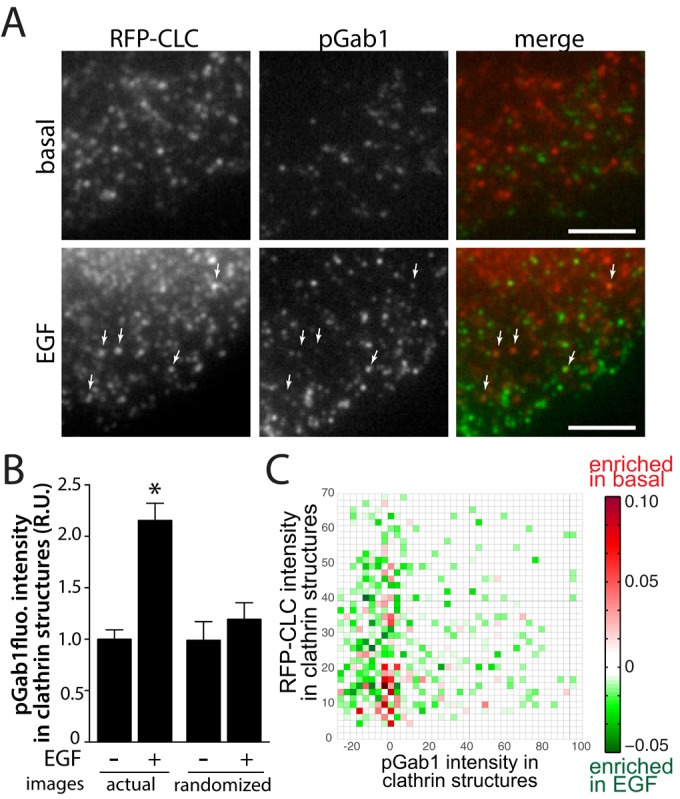
Phosphorylated Gab1 is enriched within plasma membrane clathrin structures upon EGF stimulation in ARPE-19 cells. ARPE-19 cells stably expressing Tag-RFP-T-CLC (RFP-CLC) were stimulated with 5 ng/ml EGF for 3 min or left unstimulated (basal), fixed, and labeled with antibodies that specifically recognize Gab1 phosphorylated on Y627 (pGab1), followed by imaging using TIRFM. (A) Representative micrographs; scale bar, 5 μm. (B) Micrographs obtained by TIRFM were subjected to automated detection of clathrin structures as in Aguet et al. (2013; see Materials and Methods), followed by quantification of pGab1 and RFP-CLC in each detected object. (B) Mean GFP-Gab1 fluorescence intensity detected within all clathrin structures in each image (actual image), as well as in images in which the pGab1 signal was randomized (see Materials and Methods) to determine the amount of pGab1 that occurs as a result of random overlap of clathrin and pGab1 puncta (>10,000 clathrin structures from >45 cells from four independent experiments; *p < 0.05). (C) The 2D histogram of the difference in pGab1 and RFP-CLC intensity frequencies between basal and EGF-stimulated cells; also see Materials and Methods. Bins shown in green indicate RFP-CLC and pGab1 fluorescence intensity ranges within detected clathrin structures that are more frequently detected in EGF-stimulated cells, and bins shown in red indicate RFP-CLC and pGab1 fluorescence intensity ranges more frequently detected in basal cells.
Because pGab1 and GFP-Gab1 were discernible in only a subset of clathrin structures, we sought to determine whether the localization of pGab1 was restricted to clathrin structures that also contained EGFR. To do so, we performed triple-labeling experiments in cells stimulated with A555-EGF for 3 min, followed by immunofluorescence labeling of the plasma membrane clathrin adaptor AP-2 as well as pGab1. These samples were imaged by spinning disk confocal microscopy. Consistent with results obtained by TIRFM (Figure 7), pGab1 was again observed in a subset of clathrin structures (Supplemental Figure S6A). Automated detection of AP-2 structures in ventral sections (n = 19) allowed classification of clathrin structures as “EGFR- positive” (42.0 ± 1.8%) or “EGFR-negative” (58.0 ± 1.8%), followed by quantification of pGab1 signal intensity within each of these cohorts. The EGFR-positive cohort of AP-2 structures exhibited a strong (approximately twofold) enrichment of pGab1 relative to those that were EGFR-negative (Supplemental Figure S6B).
Although immunofluorescence labeling with the pGab1 antibody yielded the expected gain in staining intensity upon EGF stimulation, there was significant background labeling observed in basal cells not expected to have much phosphorylated Gab1 (Supplemental Figure S6C). To determine the proportion of pGab1 signal detected within AP-2 structures that was due to random overlap of punctate, background structures in an image, we performed a similar randomization of the pGab1 image relative to AP2 and A555-EGF images as we described in Figure 7B. Of importance, the pGab1 staining intensity within EGFR-positive AP-2 objects detected within the randomized pGab1 image set was similar to that of the EGFR-negative AP-2 structures in the actual (nonrandomized) image sets (Supplemental Figure S6B). Hence the pGab1 staining detected within EGFR-negative structures represents background, random overlap between pGab1 and AP-2 signals. Thus, upon EGF stimulation, pGab1 is specifically enriched in plasma membrane clathrin structures (detected by AP-2 staining) containing EGFR and not in structures devoid of this receptor.
ErbB2 expression renders EGF-stimulated Akt phosphorylation insensitive to clathrin perturbation
As a spontaneously arising cell line without transforming mutations (Dunn et al., 1996), ARPE-19 cells are useful to study EGFR signaling. Moreover, ARPE-19 cells express EGFR at levels comparable to HMLE breast cells, a physiological model of breast epithelia (Supplemental Figure S7A). Of importance, ARPE-19 cells do not express detectable levels of ErbB2 (Supplemental Figure S7A) or ErbB3 (Xu and Yu, 2007). ErbB2 coexpression may alter EGFR cell surface traffic (Hommelgaard et al., 2004) and facilitate distinct signaling as a result of unique engagement of c-Src (Kim et al., 2005; Marcotte et al., 2009) and c-Cbl (Muthuswamy et al., 1999). Hence, given these differences in membrane traffic and signaling, coexpression of ErbB2 may alter the requirement for clathrin in EGF-stimulated Akt phosphorylation.
In contrast to ARPE-19 cells, HeLa cells express high levels of ErbB2 (Supplemental Figure S7A). Indeed EGF-stimulated Akt phosphorylation in HeLa cells was largely insensitive to treatment with 10 μM pitstop2 (Supplemental Figure S7B). MDA-MB-231 cells express detectable but low levels of ErbB2 and thus may be similar to ARPE-19 cells in this regard. In MDA-MB-231 cells, EGFR strongly localizes to clathrin structures upon EGF stimulation, and EGFR internalization is robustly sensitive to inhibition by dynasore and is thus fully dynamin dependent (Mutch et al., 2014). Treatment of MDA-MB-231 cells with 10 μM pitstop2 impaired EGF-stimulated Akt phosphorylation (Figure 8, A and B). Similar treatment with the dynamin inhibitor dynasore (80 μM) was without effect on EGF-stimulated Akt phosphorylation (Figure 8, A and B). These results indicate that similar to what we observed in ARPE-19 cells (Figure 2), EGF-stimulated Akt phosphorylation in MDA-MB-231 cells is sensitive to clathrin perturbation by pitstop2 but not to inhibition of endocytosis by dynasore treatment. We complemented these experiments with siRNA gene silencing of clathrin heavy chain in MDA-MB-231 cells (Figure 8, C and D). Indeed, cells treated with siRNA to silence clathrin expression exhibited blunted EGF-stimulated Akt phosphorylation compared with cells treated with control siRNA. Together these results show that in MDA-MB-231 cells, which, like ARPE-19 cells, have low ErbB2 expression, EGF-stimulated Akt phosphorylation requires clathrin but not receptor endocytosis.
FIGURE 8:

Expression of ErbB2 renders EGF-stimulated Akt phosphorylation insensitive to clathrin perturbation. (A–D) MDA-MB-231 cells were treated with 10 μM pitstop2, 80 μM dynasore, or vehicle control (0.1% [vol/vol] DMSO) for 20 min (A, B) or transfected with siRNA targeting clathrin heavy chain sequence 1 (clathrin siRNA 1), or nontargeting siRNA (control; C, D). After siRNA or drug treatment, MDA-MB-231 cells were stimulated with 5 ng/ml EGF for an additional 5 min in the continued presence of the inhibitors or left unstimulated (basal). Subsequently whole-cell lysates were immediately prepared and resolved by immunoblotting and probed with anti–phospho-Akt (S473), total pan-Akt antibodies, anti-actin, or anti-CHC antibodies. (A, C) Immunoblots representative of at least three independent experiments. (B, D) Mean ± SE of pS473-Akt values (n > 3); *p < 0.05 relative to vehicle control (B) or control siRNA, EGF-stimulated condition (D). (E, F) ARPE-19 cells stably expressing ErbB2 (RPE-ErbB2) or parental ARPE-19 cells (RPE-WT), which do not express detectable levels of ErbB2, were treated with 10 μM pitstop2 or vehicle control (0.1% [vol/vol] DMSO) for 30 min. After drug treatment, cells were stimulated with 5 ng/ml EGF for an additional 5 min in the continued presence or absence of the inhibitors or left unstimulated (basal). Whole-cell lysates were then immediately prepared, resolved by immunoblotting, and probed with anti–phospho-Akt (S473), total pan-Akt, or anti-ErbB2 antibodies. (E) Immunoblots representative of at least four independent experiments. (F) Mean ± SE of the EGF-stimulated gain in pS473-Akt values (n = 4). (G–I) HeLa cells were transfected with siRNA targeting ErbB2 or nontargeting (control) siRNA. (G) Western blot of HeLa whole-cell lysates probed with either anti-ErbB2 or anti-Akt (total, as a loading control) antibodies. (H, I) After siRNA transfection, HeLa cells were treated with 10 μM pitstop2 or vehicle control (0.1% [vol/vol] DMSO) for 20 min and then stimulated with 5 ng/ml EGF for an additional 5 min in the continued presence of the inhibitors or left unstimulated (basal). (H) Immunoblots representative of four independent experiments. (I) Mean ± SE of the EGF-stimulated gain in pS473-Akt values (n > 3); p < 0.05 relative to the control siRNA, pitstop2-treated condition.
To test directly whether ErbB2 coexpression altered the requirement for clathrin in EGF-stimulated Akt phosphorylation, we generated ARPE-19 cells that stably overexpress ErbB2 (RPE-ErbB2 cells). EGF-stimulated Akt phosphorylation in RPE-ErbB2 cells was largely insensitive to treatment with 10 μM pitstop2 (Figure 8, E and F), whereas identical pitstop2 treatment in wild-type parental ARPE-19 cells (which do not express ErbB2) resulted in ablation of EGF-stimulated Akt phosphorylation. This suggests that coexpression of ErbB2 in ARPE-19 cells facilitates EGF-stimulated Akt phosphorylation that is largely insensitive to clathrin perturbation. Next we examined whether ErbB2 silencing in HeLa cells would render EGF-stimulated Akt phosphorylation sensitive to clathrin perturbation. We achieved robust silencing of ErbB2 in HeLa cells (Figure 8G). Of importance, in ErbB2-silenced HeLa cells, EGF-stimulated Akt phosphorylation was impaired in cells treated with 10 μM pitstop2, whereas in HeLa cells treated with control siRNA, EGF-stimulated Akt phosphorylation was unaffected by this drug treatment. Taken together, these results indicate that EGF-stimulated Akt phosphorylation is sensitive to pitstop2 treatment and thus may require clathrin in cells exhibiting low expression of ErbB2 but not in cells that express substantial levels of ErbB2.
DISCUSSION
We find that perturbation of clathrin by three independent methods each inhibits the early stages of EGF-stimulated Akt phosphorylation. Because inhibition of EGFR endocytosis by perturbation of dynamin was without effect on EGF-stimulated Akt phosphorylation, these observations indicate that clathrin has a direct role in regulating EGFR signaling at the plasma membrane. Clathrin perturbation inhibits EGF-stimulated Gab1 phosphorylation but not that of EGFR, suggesting that Gab1 phosphorylation is the most receptor-proximal signaling event leading to Akt phosphorylation that requires clathrin.
Multiple independent methods identify a specific role for clathrin but not dynamin2 in EGF-stimulated Akt phosphorylation
Each of the methods used to perturb clathrin may have off-target or indirect effects that could conceivably alter receptor signaling, yet the similarity of the findings obtained by each method of clathrin perturbation with regard to inhibition of EGF-stimulated Akt phosphorylation provides strong evidence for a specific signaling role for clathrin. siRNA gene silencing of clathrin requires inhibition of clathrin-mediated endocytosis for a few days and hence may elicit cell-adaptive effects that cause indirect alteration of cellular functions such as receptor signaling. However, two distinct siRNA sequences targeting CHC have similar effects on EGF-stimulated Akt phosphorylation, suggesting that it is unlikely that the effect of siRNA treatment was due to off-target effects. Moreover, four independent results indicate that the inhibition of EGF-stimulated Akt phosphorylation by clathrin perturbation was not the result of alterations in cell-surface EGFR levels, as CHC silencing was without effect on 1) cell-surface EGFR levels measured by antibody binding to intact cells (Figure 1, F and G), 2) cell-surface EGFR levels measured by EGF binding to intact cells (Supplemental Figure S1E), 3) EGF-stimulated EGFR phosphorylation (Figure 3 and Supplemental Figure S4A), and 4) EGF-simulated p42/44 MAPK phosphorylation (Supplemental Figure S4B). This suggests that CHC silencing did not alter EGF-simulated Akt phosphorylation as a result of changes in the abundance of EGFR at the cell surface, where it has access to ligand in the extracellular milieu, but instead was due to a requirement for CHC in EGFR signaling subsequent to ligand binding.
Pitstop2 has been reported to have some off-target effects, in particular at higher concentrations (20–30 μM; Dutta et al., 2012; Willox et al., 2014) than that used in this study (10 μM). Inhibition of EGF-stimulated Akt phosphorylation occurs at a dose of pitstop2 similar to that at which the drug inhibits clathrin-mediated endocytosis (Figure 2A and Supplemental Figure S2). Moreover, coexpression of ErbB2 is sufficient to rescue the inhibition of EGF-stimulated Akt phosphorylation by pitstop2 (Figure 8). That ErbB2-dependent activation of PI3K and Akt requires a partly similar Gab1-dependent signaling pathway (Yamasaki et al., 2003) to that used by EGFR homodimers limits the possibility of off-target effects of pitstop2 on EGF-stimulated Akt activation. Consistent with the interpretation that treatment with pitstop2 inhibits EGF-stimulated Akt phosphorylation in ARPE-19 (Figure 2, E and F) and MDA-MB-231 cells (Figure 8, A and B) as a result of altering of clathrin-dependent signaling by EGFR, we found that pitstop2 treatment blocked recruitment of EGF (and thus EGFR) to plasma membrane clathrin structures (Figure 2, B and D). Knocksideways silencing of clathrin provides a further complementary strategy to perturb clathrin that is both acute and specific; this strategy also resulted in inhibition in EGF-stimulated Akt phosphorylation (Figure 3 and Supplemental Figure S3).
That perturbation of clathrin by three independent methods results in similar effects on EGF-stimulated Akt phosphorylation suggests that altered Akt phosphorylation in each case was likely due to specific perturbation of clathrin. We also find that perturbation of dynamin by two independent approaches (by siRNA or the pharmacological inhibitors dynasore or dyngo4a) had no effect on EGF-stimulated Akt phosphorylation, consistent with recent studies showing that genetic or pharmacological perturbation of dynamin did not affect EGFR signaling (Brankatschk et al., 2012; Omerovic et al., 2012; Sousa et al., 2012). Collectively our data show that clathrin-dependent internalization of EGFR is dispensable for EGF-simulated activation of Akt and that clathrin has a role in regulating EGFR signaling that can be separated from its role in receptor internalization.
Clathrin structures at the plasma membrane are required for EGFR signaling
Clathrin assembles into a lattice structure on the inner leaflet of the plasma membrane to facilitate receptor-mediated endocytosis (McMahon and Boucrot, 2011). CCPs are 50- to 100-nm membrane invaginations in which clathrin scaffolds many other proteins and lipids (including cargo receptors), which may eventually lead to internalization of clathrin-coated vesicles. This process can take from 20 s to several minutes (Aguet et al., 2013). Clathrin also forms larger, flat, long-lived structures, but these are largely absent from ARPE-19 cells (Aguet et al., 2013).
Although EGFR is recruited to CCPs upon ligand binding, leading to receptor internalization, it is not clear whether the clathrin structures required for signaling are the same as CCPs that function in endocytosis, given the large number and heterogeneous nature (size, curvature, composition) of clathrin structures at the cell surface. It is possible that EGFR signaling leading to Akt activation is regulated by or within clathrin structures that are at least partly distinct from CCPs that lead to receptor endocytosis. Consistent with this possibility, recent studies showed that the majority of clathrin assemblies at the plasma membrane do not yield intracellular vesicles but instead result in abortive turnover of these clathrin structures at the plasma membrane (Loerke et al., 2009, 2011; Mettlen et al., 2009, 2010; Antonescu et al., 2010, 2011; Aguet et al., 2013). Whereas so-called abortive clathrin-coated pits may be seen as failed endocytic events, it is also possible that abortive clathrin-coated pits might instead be viewed as facilitators of EGFR signaling leading to Akt phosphorylation. EGFR recruitment into endocytically abortive clathrin structures would provide the clathrin-dependent factor(s) for Akt activation. Indeed, we observe that GFP-Gab1 and pGab1 are enriched within clathrin structures of all sizes (Figures 6C and 7C). On the abortive turnover of a clathrin structure, ligand-bound EGFR is retained at the cell surface and is subsequently recruited into additional plasma membrane clathrin structures. The sequential recruitment of EGFR into abortive clathrin structures may prolong or potentiate clathrin-dependent EGFR signaling (e.g., Akt activation) relative to what would be achieved upon initial EGFR recruitment to a productive CCP that would rapidly remove EGFR from the plasma membrane. Hence, whereas abortive turnover of clathrin structures at the plasma membrane may delay or prevent receptor internalization, it may potentiate some facets of receptor signaling.
Regulation of Gab1 phosphorylation and localization by clathrin
On activation of certain RTKs such as EGFR and MET, Gab1 is recruited to the plasma membrane via interaction with EGFR-bound Grb2 or directly with MET, followed by the phosphorylation of a number of tyrosine residues on Gab1 (Gu and Neel, 2003). The phosphorylation of Y447, Y472, and Y589 on Gab1 provide direct docking sites for PI3K binding and activation, whereas other sites recruit other proteins, such as SHP2, Crk, and PLCγ1 (Gu and Neel, 2003).
Collectively our findings indicate that Gab1 phosphorylation is the most receptor-proximal signaling event that is clathrin dependent upon EGF stimulation. Although we did not directly measure the phosphorylation of all the tyrosine residues involved in direct PI3K binding, we found that both pitstop2 and clathrin siRNA gene silencing inhibited EGF-stimulated phosphorylation of Gab1 at Y307 and Y627 (Figure 5). Indeed the clathrin-dependent regulation of Gab1 phosphorylation leading to PI3K activation may be complex, as Gab1 pY627 acts as a docking and activation site for the tyrosine phosphatase SHP2, a protein that has been reported to both potentiate and limit PI3K and Akt activation (Wu et al., 2001). Hence clathrin may be required for phosphorylation of multiple residues on Gab1, which in turn engage both positive and negative regulators of EGFR signaling controlling Akt activation.
Using automated methods for quantitative image analysis, we find that GFP-Gab1 and phosphorylated, endogenous Gab1 (pGab1) are enriched within clathrin structures at the plasma membrane upon EGF stimulation (Figures 6 and 7). Whereas the EGF-stimulated increase in the mean fluorescence corresponding to GFP-Gab1 and pGab1 within clathrin structures is modest, this was determined using unbiased quantification of fluorescence intensity within thousands of clathrin structures. Considering that GFP-Gab1 and pGab1 are detected in only a relatively small subset of clathrin structures, the EGF-stimulated gain in GFP-Gab1 and pGab1 that we measured within all detected clathrin structures may thus underrepresent Gab1 enrichment therein. Indeed, we find that pGab1 enrichment is largely restricted to clathrin structures that also contain EGFR (Supplemental Figure S6). There is a proportion of pGab1 immunofluorescence signal that is found outside of clathrin structures in EGF-stimulated as well as basal cells (Figure 7). Whereas in basal cells this likely represents nonspecific background staining (given that little pGab1 was detected in this condition by Western blotting; Figure 5), there appears to also be specific pGab1 signal localized outside of clathrin structures in the EGF-stimulated condition. Because Gab1 has a PH domain that binds PIP3 (Rodrigues et al., 2000), Gab1 may first require localization to clathrin structures, allowing subsequent binding of pGab1 to PIP3 throughout the plasma membrane. That EGF-stimulated phosphorylation of Gab1 requires clathrin (Figure 5) and pGab1 is specifically enriched within plasma membrane clathrin structures (Figure 7) supports this possibility.
We also observed that GFP-Gab1 and pGab1 fluorescence intensity does not scale with that of clathrin in structures at the plasma membrane (Figures 6C and 7C). This suggests that whereas clathrin is required for EGF-stimulated phosphorylation of Gab1, the recruitment of Gab1 to clathrin structures does not depend solely on clathrin. This is consistent with the lack of evidence of direct interaction between Gab1 and clathrin. Instead, Gab1 likely becomes enriched within clathrin structures as a result of interactions with EGFR or Grb2 (Gu and Neel, 2003).
Mechanism(s) of regulation of EGFR signaling by clathrin
There are several possible mechanisms that may underlie the requirement for plasma membrane clathrin structures in EGF-stimulated Gab1 and Akt phosphorylation, including 1) provision of a membrane microenvironment enriched in signaling intermediates, 2) provision of a membrane microenvironment depleted in negative regulators of signaling, and 3) clustering of EGFR to promote signaling.
Plasma membrane clathrin structures may function as membrane microdomains enriched in required signaling intermediates, as has been proposed for delta-opioid receptor signaling (Elenko et al., 2003). EGF-stimulated Akt phosphorylation is impaired by the Src-family kinase (SFK) inhibitor PP1 (Kassenbrock et al., 2002), suggesting that clathrin structures could scaffold SFKs or other kinases to facilitate EGF-stimulated Gab1 phosphorylation. Indeed, clathrin binds TOM1L1, a signaling adaptor that binds SFKs (Liu et al., 2009). However, the Src inhibitor PP2, which is very similar in structure to PP1, impairs clathrin-mediated endocytosis in a SFK-independent manner (Sorkina et al., 2002). This indicates that off-target effects of PP1/PP2 must be considered when examining SFK function in EGFR signaling. Plasma membrane clathrin structures also harbor additional kinases, such as Ack1 (Shen et al., 2011), AAK1 (Conner and Schmid, 2002), and CVAK104 (Conner and Schmid, 2005). Future studies aimed at resolving the contribution of kinases and scaffolds enriched within clathrin structures to EGFR signaling will provide valuable information about the role of clathrin in controlling receptor signaling.
Clathrin structures may also exclude negative regulators of EGFR signaling such as phosphatases acting on Gab1 or other signaling intermediates. A related phenomenon might be the ability of CCPs to cluster receptors such as EGFR (Liu et al., 2010) that might potentiate receptor signaling by lateral propagation of phosphorylation to unliganded receptors (Ichinose et al., 2004). Indeed, the localized production of reactive oxygen species inhibits protein tyrosine phosphatases and potentiates EGFR signaling (Reynolds et al., 2003). Hence localized clustering of EGFR within plasma membrane clathrin structures may be sufficient to maximally activate Akt without also requiring enrichment of signaling intermediates within these structures.
Sigismund et al. (2008) showed that silencing of clathrin resulted in a reduction of EGF-stimulated activation of Akt and p42/44 MAPK, suggesting that clathrin-mediated endocytosis of EGFR is required for sustained signaling upon EGF stimulation. Their study focused on the role of clathrin in prolonged EGFR signaling (>30 min after ligand addition), whereas we focused on receptor-proximal signaling events (5–10 min of ligand addition). In addition, Sigismund et al. (2008) did not compare the effects of clathrin perturbation to that of dynamin perturbation under conditions in which EGFR internalization is entirely clathrin dependent. Our findings lead us to conclude a direct role for clathrin at the plasma membrane required for EGF-stimulated Akt phosphorylation. Clathrin may also have additional roles in regulating EGFR signaling subsequent to internalization by directing EGFR to specialized endosomes from which EGFR remains competent for prolonged signaling (Sigismund et al., 2008).
Reis et al. (2015) recently showed the existence of a signaling pathway involving Akt-dependent phosphorylation and inactivation of GSK3β, which leads to enhancement of endocytosis by regulation of dynamin 1. Our study adds to this by showing that initiation of EGFR signaling leading to Gab1 and Akt phosphorylation does not require endocytosis but is instead controlled by clathrin at the plasma membrane. Taken together, these studies indicate the existence of an extensive multicompartment positive feedback regulation cycle beginning with clathrin-dependent phosphorylation of Gab1 and Akt at the plasma membrane upon EGF stimulation and leading to Akt and GSK3β-dependent regulation of clathrin dynamics and enhancement of clathrin-mediated endocytosis, perhaps further potentiating certain signaling events.
ErbB2 expression relieves the direct requirement for clathrin in EGF-stimulated Akt phosphorylation
ARPE-19 cells are a spontaneously arising cell line that expresses EGFR but lacks expression of ErbB2. ARPE-19 cells and MDA-MB-231 cells (which, like ARPE-19 cells, express relatively low levels of ErbB2) both exhibited perturbation of EGF-stimulated Akt phosphorylation upon perturbation of clathrin but not upon perturbation of endocytosis by perturbation of dynamin. That ErbB2 expression is a critical determinant for the requirement for clathrin in EGFR signaling is further and specifically shown by the observation that 1) stable expression of ErbB2 in ARPE-19 cells rendered EGF-stimulated Akt phosphorylation largely insensitive to pitstop2 treatment, and 2) HeLa cells, which express relatively high levels of ErbB2, exhibited pitstop2-insensitive EGF-stimulated Akt phosphorylation, which became sensitive to pitstop2 treatment upon ErbB2 silencing. Hence ErbB2 expression shifts the mechanism of activation of Akt upon EGF stimulation from a clathrin-dependent one to a clathrin-independent one.
This notion is consistent with the observations from previous studies that ErbB2 expression prevents EGFR from being recruited to CCPs (Hommelgaard et al., 2004). However, in several cell lines that express ErbB2, such as HeLa cells, ligand-stimulated EGFR internalization via clathrin-coated pits is rapid and efficient (e.g., Sigismund et al., 2008). This suggests that alterations in EGFR recruitment to clathrin structures upon ErbB2 coexpression may not fully explain the difference in sensitivity to pitstop2 between parental ARPE-19 cells and ARPE-19 cells stably coexpressing ErbB2.
ErbB2 is unique among the ErbB tyrosine kinases (including EGFR) in its ability to bind and activate c-Src directly (Marcotte et al., 2009). Because SFKs may contribute to the phosphorylation of Gab1 (Gu and Neel, 2003), it is possible that ErbB2-EGFR heterodimers can directly activate SFK to elicit Gab1 phosphorylation. In contrast, EGFR homodimers may require clathrin to scaffold a nonreceptor tyrosine kinase for Gab1 phosphorylation. Because ErbB2-EGFR heterodimers form preferentially over EGFR homodimers, the requirement for clathrin for EGF stimulation may reflect the ratio of EGFR to ErbB2 expression.
Both EGFR and ErbB2 are important oncogenes and drug targets for the treatment of cancer, yet the relative expression of these and other RTKs in tumors (as in healthy tissues) is heterogeneous. Only 20–25% of breast tumors have amplification of ErbB2 (Mungamuri et al., 2013). In particular, basal-like or triple-negative breast cancers are largely ErbB2-negative yet frequently overexpress EGFR (Nielsen et al., 2004) and may be effectively treated with drugs targeting EGFR signaling (Siziopikou and Cobleigh, 2007). Hence understanding the role of clathrin in controlling EGFR signaling may lead to novel strategies for treatment of certain tumors, such as basal-like breast carcinomas.
In summary, we provide evidence using three independent methods for a novel function for the protein clathrin at the plasma membrane in facilitating EGFR signaling and leading to Akt phosphorylation in cells that exhibit low expression of ErbB2. This function of clathrin is directly required at the plasma membrane and can be separated from the role of clathrin in facilitating vesicle formation. Regulation of signal organization within clathrin-coated membrane microdomains may thus contribute to context-specific signaling of certain receptor tyrosine kinases. This novel role for clathrin in regulating the phosphorylation of Gab1 and Akt upon activation of EGFR extends the repertoire of known receptor tyrosine kinase signaling regulators to clathrin and regulators of clathrin assembly and function.
MATERIALS AND METHODS
Materials
Antibodies used were as follows: anti–phospho-EGFR (pY1068, 1086, 1045, 845, 1173), anti–phospho-Gab1 (pY 307, 627), anti–phospho-Akt (pT308), and ErbB2 antibodies were from Cell Signaling Technology (Danvers, MA); anti–phospho-Akt (pS473) antibodies and Alexa 555– conjugated EGF (A555-EGF) were from Life Technologies (Carlsbad, CA); anti-EGF antibodies (used in EGF uptake assay) were from Upstate Biotechnologies (Millipore, Etobicoke, Canada), and Tfn antibodies (used in Tfn uptake assay) were from the Scottish Antibody Production Unit (Carluke, Scotland); anti-actin and anti-–clathrin heavy chain (TD.1) used for immunoblotting were from Santa Cruz Biotechnology (Santa Cruz, CA). Fluorophore-conjugated or horseradish peroxidase (HRP) secondary antibodies were from Jackson ImmunoResearch (West Grove, PA).
Cell lines and cell culture
HeLa cells, wild-type human retinal pigment epithelial cells (ARPE-19; RPE cells here), and ARPE-19 cells stably expressing clathrin light chain fused to enhanced GFP (RPE-GFP-CLC) or fused to TagRFP-T (RPE-RFP-CLC) were previously described (Antonescu et al., 2010; Aguet et al., 2013). Cells were cultured in DMEM/F12 (Life Technologies) supplemented with 10% fetal bovine serum (Life Technologies), 100 U/ml penicillin, and 100 μg/ml streptomycin (Life Technologies) at 37°C and 5% CO2. ARPE-19 cells stably expressing ErbB2 were generated by transfecting parental ARPE-19 cells with an ErbB2 (human) pBABEpuro expression plasmid. Stable ErbB2 transfected cells were obtained by selection in medium supplemented with 3 μg/ml puromycin (initial selection), followed by stable maintenance in medium supplemented with 1 μg/ml puromycin.
cDNA constructs
cDNA encoding GFP-Gab1 was kindly provided by M. Park (McGill University, Montreal, Canada). cDNA constructs for knocksideways silencing, pMito-mCherry-FRB (henceforth, MitoTrap), and GFP-FKBP-CLCa (Cheeseman et al., 2013) were kindly provided by S. Royle (University of Warwick, Coventry, United Kingdom). A cDNA construct for expression of human ErbB2 pBABEpuro (plasmid 40978, Addgene, Cambridge, MA) was kindly provided by Matthew Meyerson (Dana-Farber Harvard Cancer Center, Boston, MA; Greulich et al., 2012).
Transfections
cDNA transfections were performed using FuGENE HD (Promega, Madison, WI) as per manufacturer’s instructions. Briefly, cells were washed once in 1× phosphate-buffered saline (PBS) and replaced with fresh growth medium. FuGENE reagent and cDNA were mixed in sterile H2O at a 3:1 ratio and incubated at room temperature for 20 min before pipetting cDNA mixture dropwise onto cell medium. Cells were incubated in transfection solution for 4 h, which was subsequently replaced with fresh medium. Experiments were performed 18–24 h after transfection.
siRNA transfections were performed using custom-synthesized siRNAs using RNAiMAX transfection reagent (Life Technologies) as per manufacturer’s instructions. Briefly, each siRNA was transfected at a concentration of 220 pmol/l with transfection reagent in Opti-MEM medium (Life Technologies). Cells were incubated with the siRNA complexes for 4 h, after which cells were washed and replaced in regular growth medium. siRNA transfections were performed twice (72 and 48 h) before each experiment. Sequences used were as follows (sense): CHC sequence 1, GGAAGGAAAUGCAGAAGAAUU; CHC sequence 2, GGGAAUAGUUUCAAUGUUU; dynamin2, GGGCAGGCCUUCUAUAAGUUU; ErbB2, GGGAGAGAGUUCUGAGGAUUU; and nontargeting control siRNA, CGUACUGCUUGCGAUACGGUU (Dharmacon, Lafayette, CO).
Cell treatment with inhibitors
All cells were serum deprived for 1 h before experimental assays unless otherwise stated. Cells were treated with pitstop2 (10 μM unless otherwise indicated in Supplemental Figure S2), 30 μM dyngo4A, or 80 μM dynasore (all inhibitors obtained from Abcam, Cambridge, MA) or a corresponding volume of dimethyl sulfoxide (DMSO; vehicle control) for 20 min before stimulation with EGF (human; Life Technologies) or other experiments, as indicated. All inhibitor treatments were performed during the 1-h serum deprivation before addition of EGF.
EGF and Tfn internalization assays
EGF and Tfn internalization assays were performed as previously described (Antonescu et al., 2010). Briefly, ARPE-19 cells grown on 12-well plates were transfected or treated with inhibitors as indicated for 20 min at 37°C. Cells were then incubated with either 10 μg/ml biotinylated transferrin or 5 ng/ml biotinylated EGF (Invitrogen) for the indicated times at 37°C, after which they were immediately placed on ice and washed 3× in ice-cold PBS2+ (PBS supplemented with 1 mM CaCl2 and 1 mM MgCl2) to remove excess (unbound) ligand and arrest membrane traffic. Uninternalized (surface-exposed) biotin-Tfn or biotin-EGF was quenched by sequential incubation with free avidin (3.1 μg/ml) and biocytin (5 μg/ml). Cells were then solubilized in blocking buffer (0.05% Triton X-100 and 0.05% SDS in Superblock solution; ThermoFisher, Rockford, IL), and cell lysates were plated onto enzyme-linked immunosorbent assay plates coated with anti-Tfn or anti-EGF antibodies and assayed for detectable (internalized) biotin-Tfn or biotin-EGF using HRP-conjugated streptavidin as previously described (Antonescu et al., 2010). Internalized biotin-Tfn or biotin-EGF was normalized to the total level of cell surface ligand binding, measured at 4°C, and not subjected to quenching with avidin, performed in parallel.
Whole-cell lysates and Western blotting
After transfection, treatment with inhibitors, and/or stimulation with EGF, whole-cell lysates were prepared using in Laemmli sample buffer (LSB; 0.5 M Tris, pH 6.8, glycerol, 10% SDS, 10% β-mercaptoethanol, and 5% bromophenol blue; all from BioShop, Burlington, Canada) supplemented with a protease and phosphatase cocktail (1 mM sodium orthovanadate, 10 nM okadaic acid, and 20 nM Protease Inhibitor Cocktail [BioShop]). Lysates were then heated at 65°C for 15 min and passed through a 27.5-gauge syringe. Proteins were resolved by glycine-Tris SDS–PAGE followed by transfer onto a polyvinylidene fluoride membrane; they were washed, blocked, and incubated with antibodies as previously described (Antonescu et al., 2011). Western blot signals to detect the intensity corresponding to phosphorylated proteins (e.g., pAkt) were obtained as previously described (Antonescu et al., 2005) by signal integration in an area corresponding to the appropriate lane and band for each condition. This measurement is then normalized to the loading control (e.g., actin) signal, and subsequently normalized to the total Akt signal, obtained either following blot stripping or reblotting. In each experiment, the resulting normalized pAkt/total Akt signal in each condition was expressed as a fraction of the normalized pAkt/total Akt measurement in the control condition stimulated with EGF for 5 min. In some experiments (Figure 8, F and I), the gain in phospho-Akt signal upon EGF stimulation in pitstop2-treated cells was expressed as percentage of the gain in this signal in control cells as follows: [(pAktEGF-stim) − (pAktbasal)]pitstop-treated/[(pAktEGF-stim) − (pAktbasal)]vehicle-treated.
Immunofluorescence staining
Immunofluorescence staining for detecting proteins in permeabilized cells was performed as previously described (Antonescu et al., 2008). Briefly, after fixation in 4% paraformaldehyde, quenching of fixative in 100 mM glycine, and cell permeabilization in 0.1% Triton X-100 (all solutions in PBS), cells were stained with primary antibodies as indicated: anti-EGFR (mAb108, collected in-house from a hybridoma cell line from the American Type Culture Collection, Manassas, VA), anti-Akt pS473 (Life Technologies), anti-EGFR pY1068 (Cell Signaling), or anti-Gab1 pY627 (Applied Biological Materials, Richmond, Canada). Subsequently, cells were stained with the appropriate fluorescently conjugated secondary antibodies and then mounted on glass slides in fluorescence mounting medium (Dako, Carpinteria, CA) or retained within aqueous medium for imaging by TIRFM. Immunofluorescence staining of cell-surface EGFR (as in Figure 1, F and G) was performed by first labeling intact cells at 4°C with anti-EGFR antibodies, followed by fixation, quenching, and secondary antibody staining.
Knocksideways silencing and detection of Akt phosphorylation
Parental ARPE-19 cells (cells not stably expressing any exogenous fluorescent proteins) were transfected with cDNAs encoding pMito-mCherry-FRB (MitoTrap) or GFP-FKBP-CLCa. On the day of the experiment, these cells were treated with 1 μM rapamycin for 10 min and then either stimulated with 5 ng/ml EGF for 5 min or left unstimulated (basal). Cells were then immediately fixed and processed as described in Immunofluorescence staining.
Fluorescence microscopy
Wide-field epifluorescence microscopy experiments presented in Figure 5 and Supplemental Figure S4 were obtained using a 63× (numerical aperture [NA] 1.49) oil objective on a Leica DM5000 B epifluorescence microscope using a DFC350FX camera (Leica Microsystems, Wetzlar, Germany). Wide-field epifluorescence microscopy experiments presented in Figure 3 and Supplemental Figure S3B were obtained using a 60× (NA 1.4) oil immersion objective on a Zeiss Axiovert 200M epifluorescence microscope using an ORCA-Flash 4.0 camera (Hamamatsu Corporation, Bridgewater, NJ).
Spinning disk confocal microscopy experiments presented in Supplemental Figures S3A and S6 were obtained using a Nikon Olympus IX81 equipped with a Yokogawa CSU X1 scanhead and a 100× (NA 1.4) oil objective using a Hamamatsu C9100-13 electron-multiplying charge-coupled device (EM-CCD) camera. Excitation light was provided by 488- (100 mV), 561- (50 mW), and 639-nm (40 mV) laser illumination, and emitted light was collected after passage through 525/50, 595/60, and 700/75 emission filters, as appropriate.
TIRFM experiments presented in Figures 6 and 7 and Supplemental Figure S6C were performed using a 150× (NA 1.45) objective on an Olympus IX81 instrument equipped with CellTIRF modules (Olympus Canada, Richmond Hill, Canada) using 491- (50 mW) and 561-nm (50 mW) laser illumination and 520/30 and 624/50 emission filters. Images were acquired using a C9100-13 EM-CCD camera.
Fluorescence microscopy image analysis
Fluorescence intensity of EGF-stimulated Akt phosphorylation and EGFR phosphorylation was determined using ImageJ software (National Institutes of Health, Bethesda, MD; Schneider et al., 2012) as previously described (Antonescu et al., 2007). The EGF-stimulated gain in pAkt and pEGFR (as shown in Figures 3 and 4C and Supplemental Figure S3, B and C) was calculated as the difference in mean fluorescence (of pAkt or pEGFR) between EGF-stimulated cells and basal (unstimulated cells) of the same condition.
Diffraction-limited clathrin-coated structures, AP-2, structures and GFP-p85 puncta were detected and quantified (as shown in Figures 2, B–D, 5C, 6, and 7 and Supplemental Figure S6) as previously described using custom software developed in Matlab (MathWorks, Natick, MA), as described in Aguet et al. (2013). Briefly, diffraction-limited fluorescent structures in ARPE-19 cells were detected using a Gaussian-based model method to approximate the point-spread function. Fluorescence intensity corresponding to the enrichment of a specific protein marker (CLC, GFP-p85, pGab1, A555-EGF, or α-adaptin, as indicated) within these detected objects was determined by the amplitude of the Gaussian model for each structure (Aguet et al., 2013). The measurements of fluorescence intensity of various proteins within clathrin structures represent enrichment of these proteins relative to the local background fluorescence in the vicinity of the detected object. The 2D intensity histograms were generated in Matlab, using 35 intensity bins for each fluorescent channel. The 2D plots of the difference in GFP and RFP intensity frequencies between different conditions cells (as in Figures 6C and 7C) were generated by subtraction of the matrices of the 2D intensity histograms.
For analysis of three-channel spinning disk confocal images (Supplemental Figure S6), identification of plasma membrane clathrin structures was performed by detection of diffraction-limited AP-2 puncta similarly as described for TIRF images. Detected objects were sorted as EGFR-positive or EGFR-negative based on the detection of A555-EGF within these objects. pGab1 signaling intensity within each detected AP-2 object was determined by the amplitude of the Gaussian model of pGab1 fluorescence within each structure (Aguet et al., 2013).
Randomized pGab1 signal within selected image sets as shown in Figure 7B and Supplemental Figure S6 image sets was generated by shifting the corresponding pGab1 channel in each image series image relative to fixed AP-2 and A555-EGF images by at least 20 pixels.
Acknowledgments
Funding for this research was provided by an Operating Grant from the Canadian Institutes of Health Research to C.N.A. (Grant 125854) and by Ryerson University. Preliminary experiments for this study were conducted in the laboratory of Sandra Schmid, supported by the Scripps Research Institute (La Jolla, CA). We are grateful for the plasmids and advice provided by Morag Park (McGill University, Montreal, Canada) for GFP-Gab1 and Margaret Robinson (University of Cambridge, Cambridge, United Kingdom) and Stephen Royle (Warwick University, Coventry, United Kingdom) for knocksideways silencing.
Abbreviations used:
- CCP
clathrin-coated pit
- CHC
clathrin heavy chain
- CLC
clathrin light chain
- CME
clathrin-mediated endocytosis
- DMSO
dimethyl sulfoxide
- Dyn2
dynamin2
- EGF
epidermal growth factor
- EGFR
epidermal growth factor receptor
- FKBP
FK506 binding protein
- FRB
FKBP12-rapamycin binding
- Gab1
growth-factor receptor–bound protein 2–associated binder1
- GFP
green fluorescent protein
- Grb2
growth-factor receptor-bound protein 2
- MAPK
mitogen-activated protein kinase
- PI3K
phosphatidylinositol-3-kinase
- RFP
red fluorescent protein (TagRFP-T)
- SFK
Src-family kinase
- siRNA
small interfering RNA
- Tfn
transferrin
- TIRFM
total internal reflection fluorescence microscopy.
Footnotes
This article was published online ahead of print in MBoC in Press (http://www.molbiolcell.org/cgi/doi/10.1091/mbc.E14-09-1412) on August 5, 2015.
REFERENCES
- Aguet F, Antonescu CN, Mettlen M, Schmid SL, Danuser G. Advances in analysis of low signal-to-noise images link dynamin and AP2 to the functions of an endocytic checkpoint. Dev Cell. 2013;26:279–291. doi: 10.1016/j.devcel.2013.06.019. [DOI] [PMC free article] [PubMed] [Google Scholar]
- Alroy I, Yarden Y. The ErbB signaling network in embryogenesis and oncogenesis: signal diversification through combinatorial ligand-receptor interactions. FEBS Lett. 1997;410:83–86. doi: 10.1016/s0014-5793(97)00412-2. [DOI] [PubMed] [Google Scholar]
- Antonescu CN, Aguet F, Danuser G, Schmid SL. Phosphatidylinositol-(4,5)-bisphosphate regulates clathrin-coated pit initiation, stabilization, and size. Mol Biol Cell. 2011;22:2588–2600. doi: 10.1091/mbc.E11-04-0362. [DOI] [PMC free article] [PubMed] [Google Scholar]
- Antonescu CN, Danuser G, Schmid SL. Phosphatidic acid plays a regulatory role in clathrin-mediated endocytosis. Mol Biol Cell. 2010;21:2944–2952. doi: 10.1091/mbc.E10-05-0421. [DOI] [PMC free article] [PubMed] [Google Scholar]
- Antonescu CN, Diaz M, Femia G, Planas JV, Klip A. Clathrin-dependent and independent endocytosis of glucose transporter 4 (GLUT4) in myoblasts: regulation by mitochondrial uncoupling. Traffic. 2008;9:1173–1190. doi: 10.1111/j.1600-0854.2008.00755.x. [DOI] [PubMed] [Google Scholar]
- Antonescu CN, Huang C, Niu W, Liu Z, Eyers PA, Heidenreich KA, Bilan PJ, Klip A. Reduction of insulin-stimulated glucose uptake in L6 myotubes by the protein kinase inhibitor SB203580 is independent of p38MAPK activity. Endocrinology. 2005;146:3773–3781. doi: 10.1210/en.2005-0404. [DOI] [PubMed] [Google Scholar]
- Antonescu CN, Randhawa V, Klip A. Dissecting GLUT4 traffic components in L6 myocytes by fluorescence-based, single cell assays. Methods Mol Biol. 2007;457:367-78. doi: 10.1007/978-1-59745-261-8_27. [DOI] [PubMed] [Google Scholar]
- Borisov N, Aksamitiene E, Kiyatkin A, Legewie S, Berkhout J, Maiwald T, Kaimachnikov NP, Timmer J, Hoek JB, Kholodenko BN. Systems-level interactions between insulin-EGF networks amplify mitogenic signaling. Mol Syst Biol. 2009;5:256. doi: 10.1038/msb.2009.19. [DOI] [PMC free article] [PubMed] [Google Scholar]
- Brankatschk B, Wichert SP, Johnson SD, Schaad O, Rossner MJ, Gruenberg J. Regulation of the EGF transcriptional response by endocytic sorting. Sci Signal. 2012;5:ra21. doi: 10.1126/scisignal.2002351. [DOI] [PubMed] [Google Scholar]
- Burke P, Schooler K, Wiley HS. Regulation of epidermal growth factor receptor signaling by endocytosis and intracellular trafficking. Mol Biol Cell. 2001;12:1897–1910. doi: 10.1091/mbc.12.6.1897. [DOI] [PMC free article] [PubMed] [Google Scholar]
- Cantley LC. The phosphoinositide 3-kinase pathway. Science. 2002;296:1655–1657. doi: 10.1126/science.296.5573.1655. [DOI] [PubMed] [Google Scholar]
- Cheeseman LP, Harry EF, McAinsh AD, Prior IA, Royle SJ. Specific removal of TACC3-ch-TOG-clathrin at metaphase deregulates kinetochore fiber tension. J Cell Sci. 2013;126:2102–2113. doi: 10.1242/jcs.124834. [DOI] [PMC free article] [PubMed] [Google Scholar]
- Conner SD, Schmid SL. Identification of an adaptor-associated kinase, AAK1, as a regulator of clathrin-mediated endocytosis. J Cell Biol. 2002;156:921–929. doi: 10.1083/jcb.200108123. [DOI] [PMC free article] [PubMed] [Google Scholar]
- Conner SD, Schmid SL. CVAK104 is a novel poly-L-lysine-stimulated kinase that targets the beta2-subunit of AP2. J Biol Chem. 2005;280:21539–21544. doi: 10.1074/jbc.M502462200. [DOI] [PubMed] [Google Scholar]
- Dunn KC, Aotaki-Keen AE, Putkey FR, Hjelmeland LM. ARPE-19, a human retinal pigment epithelial cell line with differentiated properties. Exp Eye Res. 1996;62:155–169. doi: 10.1006/exer.1996.0020. [DOI] [PubMed] [Google Scholar]
- Dutta D, Williamson CD, Cole NB, Donaldson JG. Pitstop 2 is a potent inhibitor of clathrin-independent endocytosis. PLoS One. 2012;7:e45799. doi: 10.1371/journal.pone.0045799. [DOI] [PMC free article] [PubMed] [Google Scholar]
- Elenko E, Fischer T, Niesman I, Harding T, McQuistan T, Von Zastrow M, Farquhar MG. Spatial regulation of Galphai protein signaling in clathrin-coated membrane microdomains containing GAIP. Mol Pharmacol. 2003;64:11–20. doi: 10.1124/mol.64.1.11. [DOI] [PubMed] [Google Scholar]
- Gillham H, Golding MC, Pepperkok R, Gullick WJ. Intracellular movement of green fluorescent protein-tagged phosphatidylinositol 3-kinase in response to growth factor receptor signaling. J Cell Biol. 1999;146:869–880. doi: 10.1083/jcb.146.4.869. [DOI] [PMC free article] [PubMed] [Google Scholar]
- Greulich H, Kaplan B, Mertins P, Chen TH, Tanaka KE, Yun CH, Zhang X, Lee SH, Cho J, Ambrogio L, et al. Functional analysis of receptor tyrosine kinase mutations in lung cancer identifies oncogenic extracellular domain mutations of ERBB2. Proc Natl Acad Sci USA. 2012;109:14476–14481. doi: 10.1073/pnas.1203201109. [DOI] [PMC free article] [PubMed] [Google Scholar]
- Gu H, Neel BG. The “Gab” in signal transduction. Trends Cell Biol. 2003;13:122–130. doi: 10.1016/s0962-8924(03)00002-3. [DOI] [PubMed] [Google Scholar]
- Holgado-Madruga M, Emlet DR, Moscatello DK, Godwin AK, Wong AJ. A Grb2-associated docking protein in EGF- and insulin-receptor signalling. Nature. 1996;379:560–564. doi: 10.1038/379560a0. [DOI] [PubMed] [Google Scholar]
- Hommelgaard AM, Lerdrup M, van Deurs B. Association with membrane protrusions makes ErbB2 an internalization-resistant receptor. Mol Biol Cell. 2004;15:1557–1567. doi: 10.1091/mbc.E03-08-0596. [DOI] [PMC free article] [PubMed] [Google Scholar]
- Ichinose J, Murata M, Yanagida T, Sako Y. EGF signalling amplification induced by dynamic clustering of EGFR. Biochem Biophys Res Commun. 2004;324:1143–1149. doi: 10.1016/j.bbrc.2004.09.173. [DOI] [PubMed] [Google Scholar]
- Iwamoto R, Yamazaki S, Asakura M, Takashima S, Hasuwa H, Miyado K, Adachi S, Kitakaze M, Hashimoto K, Raab G, et al. Heparin-binding EGF-like growth factor and ErbB signaling is essential for heart function. Proc Natl Acad Sci USA. 2003;100:3221–3226. doi: 10.1073/pnas.0537588100. [DOI] [PMC free article] [PubMed] [Google Scholar]
- Kassenbrock CK, Hunter S, Garl P, Johnson GL, Anderson SM. Inhibition of Src family kinases blocks epidermal growth factor (EGF)-induced activation of Akt, phosphorylation of c-Cbl, and ubiquitination of the EGF receptor. J Biol Chem. 2002;277:24967–24975. doi: 10.1074/jbc.M201026200. [DOI] [PubMed] [Google Scholar]
- Kim H, Chan R, Dankort DL, Zuo D, Najoukas M, Park M, Muller WJ. The c-Src tyrosine kinase associates with the catalytic domain of ErbB-2: implications for ErbB-2 mediated signaling and transformation. Oncogene. 2005;24:7599–7607. doi: 10.1038/sj.onc.1208898. [DOI] [PubMed] [Google Scholar]
- Kiyatkin A, Aksamitiene E, Markevich NI, Borisov NM, Hoek JB, Kholodenko BN. Scaffolding protein Grb2-associated binder 1 sustains epidermal growth factor-induced mitogenic and survival signaling by multiple positive feedback loops. J Biol Chem. 2006;281:19925–19938. doi: 10.1074/jbc.M600482200. [DOI] [PMC free article] [PubMed] [Google Scholar]
- Lemmon MA, Schlessinger J. Cell signaling by receptor tyrosine kinases. Cell. 2010;141:1117–1134. doi: 10.1016/j.cell.2010.06.011. [DOI] [PMC free article] [PubMed] [Google Scholar]
- Liu AP, Aguet F, Danuser G, Schmid SL. Local clustering of transferrin receptors promotes clathrin-coated pit initiation. J Cell Biol. 2010;191:1381–1393. doi: 10.1083/jcb.201008117. [DOI] [PMC free article] [PubMed] [Google Scholar]
- Liu NS, Loo LS, Loh E, Seet L-F, Hong W. Participation of Tom1L1 in EGF-stimulated endocytosis of EGF receptor. EMBO J. 2009;28:3485–3499. doi: 10.1038/emboj.2009.282. [DOI] [PMC free article] [PubMed] [Google Scholar]
- Lock LS, Royal I, Naujokas MA, Park M. Identification of an atypical Grb2 carboxyl-terminal SH3 domain binding site in Gab docking proteins reveals Grb2-dependent and -independent recruitment of Gab1 to receptor tyrosine kinases. J Biol Chem. 2000;275:31536–31545. doi: 10.1074/jbc.M003597200. [DOI] [PubMed] [Google Scholar]
- Loerke D, Mettlen M, Schmid SL, Danuser G. Measuring the hierarchy of molecular events during clathrin-mediated endocytosis. Traffic. 2011;12:815-825. doi: 10.1111/j.1600-0854.2011.01197.x. [DOI] [PMC free article] [PubMed] [Google Scholar]
- Loerke D, Mettlen M, Yarar D, Jaqaman K, Jaqaman H, Danuser G, Schmid SL. Cargo and dynamin regulate clathrin-coated pit maturation. PLoS Biol. 2009;7:e57. doi: 10.1371/journal.pbio.1000057. [DOI] [PMC free article] [PubMed] [Google Scholar]
- Luo J, Field SJ, Lee JY, Engelman JA, Cantley LC. The p85 regulatory subunit of phosphoinositide 3-kinase down-regulates IRS-1 signaling via the formation of a sequestration complex. J Cell Biol. 2005;170:455–464. doi: 10.1083/jcb.200503088. [DOI] [PMC free article] [PubMed] [Google Scholar]
- Marcotte R, Zhou L, Kim H, Roskelly CD, Muller WJ. c-Src associates with ErbB2 through an interaction between catalytic domains and confers enhanced transforming potential. Mol Cell Biol. 2009;29:5858–5871. doi: 10.1128/MCB.01731-08. [DOI] [PMC free article] [PubMed] [Google Scholar]
- Matheny RW, Adamo ML. Current perspectives on Akt Akt-ivation and Akt-ions. Exp Biol Med. 2009;234:1264–1270. doi: 10.3181/0904-MR-138. [DOI] [PubMed] [Google Scholar]
- Mattoon DR, Lamothe B, Lax I, Schlessinger J. The docking protein Gab1 is the primary mediator of EGF-stimulated activation of the PI-3K/Akt cell survival pathway. BMC Biol. 2004;2:24. doi: 10.1186/1741-7007-2-24. [DOI] [PMC free article] [PubMed] [Google Scholar]
- McMahon HT, Boucrot E. Molecular mechanism and physiological functions of clathrin-mediated endocytosis. Nat Rev Mol Cell Biol. 2011;12:517–533. doi: 10.1038/nrm3151. [DOI] [PubMed] [Google Scholar]
- Mettlen M, Loerke D, Yarar D, Danuser G, Schmid SL. Cargo- and adaptor-specific mechanisms regulate clathrin-mediated endocytosis. J Cell Biol. 2010;188:919–933. doi: 10.1083/jcb.200908078. [DOI] [PMC free article] [PubMed] [Google Scholar]
- Mettlen M, Stoeber M, Loerke D, Antonescu CN, Danuser G, Schmid SL. Endocytic accessory proteins are functionally distinguished by their differential effects on the maturation of clathrin-coated pits. Mol Biol Cell. 2009;20:3251–3260. doi: 10.1091/mbc.E09-03-0256. [DOI] [PMC free article] [PubMed] [Google Scholar]
- Miettinen PJ, Berger JE, Meneses J, Phung Y, Pedersen RA, Werb Z, Derynck R. Epithelial immaturity and multiorgan failure in mice lacking epidermal growth factor receptor. Nature. 1995;376:337–341. doi: 10.1038/376337a0. [DOI] [PubMed] [Google Scholar]
- Mungamuri SK, Murk W, Grumolato L, Bernstein E, Aaronson SA. Chromatin modifications sequentially enhance ErbB2 expression in ErbB2-positive breast cancers. Cell Rep. 2013;5:302–313. doi: 10.1016/j.celrep.2013.09.009. [DOI] [PMC free article] [PubMed] [Google Scholar]
- Mutch LJ, Howden JD, Jenner EP, Poulter NS, Rappoport JZ. Polarised clathrin-mediated endocytosis of EGFR during chemotactic invasion. Traffic. 2014;15:648–664. doi: 10.1111/tra.12165. [DOI] [PMC free article] [PubMed] [Google Scholar]
- Muthuswamy SK, Gilman M, Brugge JS. Controlled dimerization of ErbB receptors provides evidence for differential signaling by homo- and heterodimers. Mol Cell Biol. 1999;19:6845–6857. doi: 10.1128/mcb.19.10.6845. [DOI] [PMC free article] [PubMed] [Google Scholar]
- Nielsen TO, Hsu FD, Jensen K, Cheang M, Karaca G, Hu Z, Hernandez-Boussard T, Livasy C, Cowan D, Dressler L, et al. Immunohistochemical and clinical characterization of the basal-like subtype of invasive breast carcinoma. Clin Cancer Res. 2004;10:5367–5374. doi: 10.1158/1078-0432.CCR-04-0220. [DOI] [PubMed] [Google Scholar]
- Olayioye MA, Neve RM, Lane HA, Hynes NE. The ErbB signaling network: receptor heterodimerization in development and cancer. EMBO J. 2000;19:3159–3167. doi: 10.1093/emboj/19.13.3159. [DOI] [PMC free article] [PubMed] [Google Scholar]
- Omerovic J, Hammond DE, Prior IA, Clague MJ. Global snapshot of the influence of endocytosis upon EGF receptor signaling output. J Proteome Res. 2012;11:5157–5166. doi: 10.1021/pr3007304. [DOI] [PubMed] [Google Scholar]
- Pennock S, Wang Z. Stimulation of cell proliferation by endosomal epidermal growth factor receptor as revealed through two distinct phases of signaling. Mol Cell Biol. 2003;23:5803–5815. doi: 10.1128/MCB.23.16.5803-5815.2003. [DOI] [PMC free article] [PubMed] [Google Scholar]
- Platta HW, Stenmark H. Endocytosis and signaling. Curr Opin Cell Biol. 2011;23:393–403. doi: 10.1016/j.ceb.2011.03.008. [DOI] [PubMed] [Google Scholar]
- Pritchard JE, Jablonski AB, Parsons SJ. Convergence of EGF receptor and Src family signaling networks in cancer. In: Haley JD, Gullick WJ, editors. EGFR Signaling Networks in Cancer Therapy. New York: Springer; 2008. pp. 112–130. [Google Scholar]
- Reis CR, Chen P-H, Srinivasan S, Aguet F, Mettlen M, Schmid SL. Crosstalk between Akt/GSK3β signaling and dynamin-1 regulates clathrin-mediated endocytosis. EMBO J. 2015 doi: 10.15252/embj.201591518. 2015, e201591518. [DOI] [PMC free article] [PubMed] [Google Scholar]
- Reynolds AR, Tischer C, Verveer PJ, Rocks O, Bastiaens PI. EGFR activation coupled to inhibition of tyrosine phosphatases causes lateral signal propagation. Nat Cell Biol. 2003;5:447–453. doi: 10.1038/ncb981. [DOI] [PubMed] [Google Scholar]
- Robinson MS, Sahlender DA, Foster SD. Rapid inactivation of proteins by rapamycin-induced rerouting to mitochondria. Dev Cell. 2010;18:324–331. doi: 10.1016/j.devcel.2009.12.015. [DOI] [PMC free article] [PubMed] [Google Scholar]
- Rodrigues GA, Falasca M, Zhang Z, Ong SH, Schlessinger J. A novel positive feedback loop mediated by the docking protein Gab1 and phosphatidylinositol 3-kinase in epidermal growth factor receptor signaling. Mol Cell Biol. 2000;20:1448–1459. doi: 10.1128/mcb.20.4.1448-1459.2000. [DOI] [PMC free article] [PubMed] [Google Scholar]
- Schenck A, Goto-Silva L, Collinet C, Rhinn M, Giner A, Habermann B, Brand M, Zerial M. The endosomal protein Appl1 mediates Akt substrate specificity and cell survival in vertebrate development. Cell. 2008;133:486–497. doi: 10.1016/j.cell.2008.02.044. [DOI] [PubMed] [Google Scholar]
- Schneider CA, Rasband WS, Eliceiri KW. NIH Image to ImageJ: 25 years of image analysis. Nat Methods. 2012;9:671–675. doi: 10.1038/nmeth.2089. [DOI] [PMC free article] [PubMed] [Google Scholar]
- Shen H, Ferguson SM, Dephoure N, Park R, Yang Y, Volpicelli-Daley L, Gygi S, Schlessinger J, De Camilli P. Constitutive activated Cdc42-associated kinase (Ack) phosphorylation at arrested endocytic clathrin-coated pits of cells that lack dynamin. Mol Biol Cell. 2011;22:493–502. doi: 10.1091/mbc.E10-07-0637. [DOI] [PMC free article] [PubMed] [Google Scholar]
- Sibilia M, Steinbach JP, Stingl L, Aguzzi A, Wagner EF. A strain-independent postnatal neurodegeneration in mice lacking the EGF receptor. EMBO J. 1998;17:719–731. doi: 10.1093/emboj/17.3.719. [DOI] [PMC free article] [PubMed] [Google Scholar]
- Sibilia M, Wagner EF. Strain-dependent epithelial defects in mice lacking the EGF receptor. Science. 1995;269:234–238. doi: 10.1126/science.7618085. [DOI] [PubMed] [Google Scholar]
- Sigismund S, Argenzio E, Tosoni D, Cavallaro E, Polo S, Di Fiore PP. Clathrin-mediated internalization is essential for sustained EGFR signaling but dispensable for degradation. Dev Cell. 2008;15:209–219. doi: 10.1016/j.devcel.2008.06.012. [DOI] [PubMed] [Google Scholar]
- Siziopikou KP, Cobleigh M. The basal subtype of breast carcinomas may represent the group of breast tumors that could benefit from EGFR-targeted therapies. Breast. 2007;16:104–107. doi: 10.1016/j.breast.2006.09.003. [DOI] [PubMed] [Google Scholar]
- Sorkin A, Goh LK. Endocytosis and intracellular trafficking of ErbBs. Exp Cell Res. 2009;315:683–696. doi: 10.1016/j.yexcr.2008.07.029. [DOI] [PubMed] [Google Scholar]
- Sorkin A, von Zastrow M. Endocytosis and signalling: intertwining molecular networks. Nat Rev Mol Cell Biol. 2009;10:609–622. doi: 10.1038/nrm2748. [DOI] [PMC free article] [PubMed] [Google Scholar]
- Sorkina T, Huang F, Beguinot L, Sorkin A. Effect of tyrosine kinase inhibitors on clathrin-coated pit recruitment and internalization of epidermal growth factor receptor. J Biol Chem. 2002;277:27433–27441. doi: 10.1074/jbc.M201595200. [DOI] [PubMed] [Google Scholar]
- Sousa LP, Lax I, Shen H, Ferguson SM, De Camilli P, Schlessinger J. Suppression of EGFR endocytosis by dynamin depletion reveals that EGFR signaling occurs primarily at the plasma membrane. Proc Natl Acad Sci USA. 2012;109:4419–4424. doi: 10.1073/pnas.1200164109. [DOI] [PMC free article] [PubMed] [Google Scholar]
- Stern DF. ErbBs in mammary development. Exp Cell Res. 2003;284:89–98. doi: 10.1016/s0014-4827(02)00103-9. [DOI] [PubMed] [Google Scholar]
- Threadgill DW, Dlugosz AA, Hansen LA, Tennenbaum T, Lichti U, Yee D, LaMantia C, Mourton T, Herrup K, Harris RC. Targeted disruption of mouse EGF receptor: effect of genetic background on mutant phenotype. Science. 1995;269:230–234. doi: 10.1126/science.7618084. [DOI] [PubMed] [Google Scholar]
- Vieira A V, Lamaze C, Schmid SL. Control of EGF receptor signaling by clathrin-mediated endocytosis. Science. 1996;274:2086–2089. doi: 10.1126/science.274.5295.2086. [DOI] [PubMed] [Google Scholar]
- Vivanco I, Sawyers CL. The phosphatidylinositol 3-kinase–AKT pathway in human cancer. Nat Rev Cancer. 2002;2:489–501. doi: 10.1038/nrc839. [DOI] [PubMed] [Google Scholar]
- von Kleist L, Stahlschmidt W, Bulut H, Gromova K, Puchkov D, Robertson MJ, MacGregor KA, Tomilin N, Pechstein A, Chau N, et al. Role of the clathrin terminal domain in regulating coated pit dynamics revealed by small molecule inhibition. Cell. 2011;146:471–484. doi: 10.1016/j.cell.2011.06.025. [DOI] [PubMed] [Google Scholar]
- Wada I, Lai WH, Posner BI, Bergeron JJ. Association of the tyrosine phosphorylated epidermal growth factor receptor with a 55-kD tyrosine phosphorylated protein at the cell surface and in endosomes. J Cell Biol. 1992;116:321–330. doi: 10.1083/jcb.116.2.321. [DOI] [PMC free article] [PubMed] [Google Scholar]
- Wang Y, Pennock S, Chen X, Wang Z. Internalization of inactive EGF receptor into endosomes and the subsequent activation of endosome-associated EGF receptors. Epidermal growth factor. Sci STKE. 2002;2002:pl17. doi: 10.1126/stke.2002.161.pl17. [DOI] [PubMed] [Google Scholar]
- Willox AK, Sahraoui YME, Royle SJ. Non-specificity of Pitstop 2 in clathrin-mediated endocytosis. Biol Open. 2014;3:326–331. doi: 10.1242/bio.20147955. [DOI] [PMC free article] [PubMed] [Google Scholar]
- Wu CJ, O’Rourke DM, Feng GS, Johnson GR, Wang Q, Greene MI. The tyrosine phosphatase SHP-2 is required for mediating phosphatidylinositol 3-kinase/Akt activation by growth factors. Oncogene. 2001;20:6018–6025. doi: 10.1038/sj.onc.1204699. [DOI] [PubMed] [Google Scholar]
- Xu K-P, Yu F-SX. Cross talk between c-Met and epidermal growth factor receptor during retinal pigment epithelial wound healing. Invest Ophthalmol Vis Sci. 2007;48:2242–2248. doi: 10.1167/iovs.06-0560. [DOI] [PMC free article] [PubMed] [Google Scholar]
- Yamasaki S, Nishida K, Yoshida Y, Itoh M, Hibi M, Hirano T. Gab1 is required for EGF receptor signaling and the transformation by activated ErbB2. Oncogene. 2003;22:1546–1556. doi: 10.1038/sj.onc.1206284. [DOI] [PubMed] [Google Scholar]
- Zoncu R, Perera RM, Balkin DM, Pirruccello M, Toomre D, De Camilli P. A phosphoinositide switch controls the maturation and signaling properties of APPL endosomes. Cell. 2009;136:1110–1121. doi: 10.1016/j.cell.2009.01.032. [DOI] [PMC free article] [PubMed] [Google Scholar]