

Abstract
Purpose.
To assess the relationship between the pupillary light reflex (PLR) and visual field (VF) mean deviation (MD) and retinal nerve fiber layer (RNFL) thickness.
Methods.
A total of 148 patients with glaucoma (mean age 67 ± 11, 49% female) and 71 controls (mean age 60 ± 10, 69% female) were included in this study. Using a pupillometer, we recorded and analyzed pupillary responses at varied stimulus patterns (full field, superonasal and inferonasal quadrant arcs). We compared the responses between the two eyes, compared responses to stimuli in the superonasal and inferonasal fields within each eye, and calculated the absolute PLR value of each individual eye. We assessed the relationship among PLR, MD, and RNFL thickness using the Pearson correlation coefficient. For analyses performed at the level of individual eyes, we used multilevel modeling to account for between-eye correlations within individuals.
Results.
For every 0.3 log unit difference in between-eye asymmetry of PLR, there was an average 2.6-dB difference in visual field MD (correlation coefficient R = 0.83, P < 0.001) and a 3.2-μm difference in RNFL thickness between the two eyes (R = 0.67, P < 0.001). Greater VF damage and thinner RNFL for each individual eye were associated with smaller response amplitude, slower velocity, and longer time to peak constriction and dilation after adjusting for age and sex (all P < 0.001). However, within-eye asymmetry of PLR between superonasal and inferonasal stimulation was not associated with corresponding within-eye differences in VF or RNFL.
Conclusions.
As measured by this particular device, the PLR is strongly correlated with VF functional testing and measurements of RNFL thickness.
Keywords: glaucoma, pupillary light reflex, visual field, retinal nerve fiber layer thickness, RAPD
The between-eye asymmetry in pupillary light reflex measured using pupillography correlated strongly with both the difference in retinal nerve fiber layer thickness and the difference in visual field mean deviation between the two eyes.
Introduction
Glaucoma is an optic neuropathy characterized by the death of retinal ganglion cells (RGCs) in the inner retina and loss of their axons in the optic nerve. The structural loss of ganglion cell axons can be detected by thinning of the nerve fiber layer surrounding the disc. As more RGCs and their axons are affected by glaucoma, the cup-to-disc ratio (CDR) also progressively increases. The loss of ganglion cells results in functional impairment of vision, which is assessed by measuring light sensitivity at locations in the central 24 to 30° of vision using subjective responses to light stimuli during a visual field (VF) test.
Between-eye CDR asymmetry is an early sign of glaucomatous damage and a predictor of future damage in patients with ocular hypertension. Similarly, asymmetry in VF loss is frequently seen in glaucoma.1 Generally, glaucoma is asymmetric in nature, with one eye having more damage than the other.2
The pupillary light reflex (PLR) is initiated by RGCs. Therefore, the PLR should be reduced in eyes with glaucoma. Asymmetric damage between eyes with glaucoma often results in different pupillary responses to light, creating a relative afferent pupillary defect (RAPD).3,4 Quantitative assessment of the RAPD therefore could potentially serve as a functional test for glaucoma case detection. The amplitude of pupillary response was found to be inversely proportional to the amount of ganglion cell loss in one study of nonhuman primates.5 Visual field loss and the retinal nerve fiber layer (RNFL) thickness are also correlated with ganglion cell density.6–9 Correlations among RAPD, VF loss, and RNFL thickness have been reported in previous studies but were limited by using the swinging flashlight test and relatively small sample sizes.10–14 In our study, we assessed the quantitative relationship between PLR and both structural and functional loss in glaucoma patients using a new type of pupillography. This technology allowed us to measure PLR precisely under various controlled stimulations and analyze the pupil waveform of both eyes in real time. Because this technology can be operated by technicians, and does not need patients' subjective response, it may be administered in settings in which ophthalmologists are not easily accessible.
The purpose of this study was to use pupillography to assess the quantitative relationship between the PLR and structural and functional loss in glaucoma patients. We further assessed these relationships at three levels, including between-eye, within-eye, and individual-eye comparisons.
Methods
Study Enrollment
We enrolled both glaucoma patients and healthy controls between March 2011 and June 2012. To be eligible for participation, participants had to be 40 years or older at enrollment, have presenting visual acuity better than 20/100 in both eyes and have not had ocular surgery within 3 months. Informed consent was obtained from all subjects, and the Institutional Review Board of Johns Hopkins University School of Medicine approved the protocol. The study abided by the tenets of the Declaration of Helsinki.
We enrolled patients with glaucoma of any cause in at least one eye, defined by having both optic disc or retinal nerve fiber layer structural abnormalities and VF defects consistent with structural damage or with glaucomatous defect. We included a full spectrum of glaucoma disease severity and excluded patients with other macular or retinal comorbidities. We enrolled control subjects who were at the Wilmer Eye Institute accompanying patients attending examinations. We did not enroll subjects as controls if they had a CDR greater than 0.7, signs of retinal or optic nerve abnormalities under undilated fundus exam, or abnormal VF results by frequency doubling technology in either eye.
Pupillometer and Waveform Analysis
We used a prototype automated pupillometer (Konan Medical USA, Inc., Irvine, CA) to record and analyze the PLR. Each subject was dark-adapted for 1 minute before the test. While the patient was viewing binocularly, monocular stimuli were presented on the device, alternating between eyes (similar to the swinging flashlight test). Stimuli included both full-field illumination as well as 21° superonasal and inferonasal quadrant arcs that spared the central 11.7°.
The amplitude of pupil constriction was calculated as the percentage change in pupil diameter (PD) between constriction onset and peak constriction responding to each stimulus ([PDresting − PDconstricted]/PDresting). Between-eye score is defined as the log of the relative ratio of the pupil constriction amplitude between the two eyes multiplying by 10. Within-eye symmetry was assessed by comparing the pupil responses to light using stimuli presented to the superonasal and inferonasal VF separately within the same eye. The within-eye asymmetry score was defined by taking the log of the relative ratio of the pupil amplitude between the superonasal and inferonasal field and multiplying by 10.
In addition to the response amplitude, we calculated the latency of PLR using the time from the onset of stimulation to the onset of pupil constriction. By using the first-order and second-order derivatives, maximum constriction velocity and maximum dilation velocity were defined as the time from stimulus onset to the time of reaching maximal velocities.
Optical Coherence Tomography
All subjects had RNFL thickness measured using spectral-domain optical coherence tomography (SD-OCT) (Spectralis software, version 5.3; Heidelberg Engineering, Heidelberg, Germany). The peripapillary RNFL was automatically segmented, and the RNFL thickness was measured at 3.45 mm from the center of the disc along the circular scan. For each eye, mean RNFL thickness along the whole circumpapillary scan (global) and mean RNFL thickness along sectors of the scan (superior, inferior, temporal, nasal, temporal-superior, temporal-inferior, nasal-superior, and nasal-inferior) were calculated.
Visual Field Testing
For patients with glaucoma, VF testing was performed with standard automated perimetry (SAP) (Humphrey Field Analyzer; Carl Zeiss Meditec, Inc., Dublin, CA) using the Swedish Interactive Threshold Algorithm (SITA) standard strategy and 24-2 pattern as part of routine clinical examination.2,15 We calculated the mean deviation (MD) of the superior and inferior nasal quadrants of each VF by averaging the antilog of the total deviation values of the points in those regions while excluding points within the central 10 degrees, and then taking a log of the average values.
For healthy subjects, we assessed their VF using frequency-doubling technology (FDT) (Humphrey Matrix Perimeter; Carl Zeiss Meditec, Inc.) if they did not have an SAP VF within the past year. We minimized the false-negative rate by using the N-30-5 screening protocol. The test was considered reliable if false-positive and fixation loss were less than 30%. A subject was considered eligible if there was no abnormal point in the central locations and no more than two abnormal points at any peripheral locations.16 Fourteen of 71 control subjects underwent both SAP and FDT VF tests. We assessed the relationship between PLR and VF MD in all glaucoma patients and those 14 control subjects. Because all enrolled healthy subjects passed the FDT screening test, we further conducted a sensitivity analysis to assess if the results remained robust when assigning a VF MD value of zero for those who did not undergo SAP testing.
Statistical Analysis
Demographic and ocular characteristics of the study population were summarized with means and SDs for continuous variables and with percentages for categorical variables. Differences in characteristics between glaucoma patients and healthy subjects were compared using Student's t-test and the chi-square test.
The relationships between PLR, VF MD, and RNFL thickness were examined graphically, and the strengths of associations were quantified with regression analyses. R2 values were calculated to assess how much variability of the difference in PLR was explained by differences in VF defect or the RNFL thickness. We further used locally weighted scatterplot smoothing (lowess) to minimize influence of extreme points and compare it to the regression line.
We assessed each PLR-RNFL or PLR-VF relationship in three ways: (1) the difference between the two eyes, (2) the difference between the superonasal and inferonasal fields within the same eye, and (3) the absolute value of each individual eye. For analyses performed at the level of individual eyes, we used mixed effects multilevel modeling to account for between-eye correlations within individuals. Statistical analyses were performed using STATA 12.0 (StataCorp LP, College Station, TX).
Results
A total of 219 subjects were included in the analysis, consisting of 148 glaucoma patients (93% primary open angle glaucoma, 3% primary angle closure glaucoma, and 4% secondary glaucoma) and 71 controls. The mean age was 67 ± 11 years for glaucoma patients and 60 ± 10 years for controls. There were 49% female glaucoma patients and 69% female controls (Table 1). Compared with controls, glaucoma patients had significantly larger CDR (0.75 vs. 0.36), thinner RNFL thickness (67 ± 14 vs. 94 ± 9 μm), and worse MD (−7.4 ± 6.2 vs. −0.7 ± 0.8 dB). Comparing right and left eyes, glaucoma patients had greater asymmetry in IOP, CDR, RNFL thickness, and pupillary light reflex than controls (Table 1).
Table 1.
Baseline Characteristics of Study Population
|
Glaucoma,
n
= 148 |
Control,
n
= 71 |
P
Value |
|
| Age, y, mean (SD) | 67.0 (10.7) | 60.4 (9.6) | <0.001 |
| Female, n (%) | 72 (49) | 49 (69) | 0.005 |
| Race, n (%) | |||
| Non-Hispanic white | 121 (82) | 51 (72) | 0.169 |
| African American | 20 (13) | 12 (17) | |
| Others | 7 (5) | 8 (11) | |
| IOP, mm Hg, mean (SD) | |||
| Average of the 2 eyes | 14.1 (3.5) | 13.6 (3.9) | 0.425 |
| Between-eye absolute differences | 2.8 (3.2) | 1.1 (0.9) | <0.001 |
| CDR, mean (SD) | |||
| Average of the 2 eyes | 0.75 (0.15) | 0.36 (0.10) | <0.001 |
| Between-eye absolute differences | 0.12 (0.13) | 0.04 (0.05) | <0.001 |
| Visual acuity, logMar, mean (SD) | |||
| Average of the 2 eyes | 0.13 (0.12) | 0.09 (0.13) | 0.012 |
| Between-eye absolute differences | 0.13 (0.16) | 0.10 (0.12) | 0.157 |
| RNFL, μm, mean (SD) | |||
| Eye with thinner RNFL | 67.0 (13.9) | 94.2 (9.1) | <0.001 |
| Between-eye absolute differences | 12.5 (9.6) | 4.3 (4.9) | <0.001 |
| Visual field, dB, mean (SD) | |||
| Average of the 2 eyes | −7.35 (6.24) | −0.72 (0.78) | <0.001 |
| Between-eye absolute differences | 5.81 (5.69) | 0.69 (0.53) | 0.001 |
| Absolute between-eye PLR score, log unit, mean (SD) | 0.50 (0.62) | 0.14 (0.10) | <0.001 |
IOP measured by Goldmann applanation tonometry (Haag-Streit, Koeniz, Switzerland) or iCare tonometry (iCare Finland Oy, Helsinki, Finland).
CDR was estimated clinically with ophthalmoscopy.
The between-eye score represents the between-eye asymmetry of the PLR. Symmetric pupillary responses result in a between-eye score of 0. A positive between-eye score indicates a relative abnormality of the left afferent pathway, whereas a negative score indicates an abnormality of the right pathway. Greater between-eye asymmetry in the PLR (a more negative or a more positive between-eye score) was associated with greater asymmetry in MD between the two eyes (Fig. 1). This association was statistically significant (P < 0.001) and accounted for 69% of the variability in between-eye differences between individuals (correlation coefficient R = 0.83, R2 = 0.69). On average, a 0.3–log unit increase in the absolute between-eye score was associated with a 2.6-dB difference in MD between the two eyes. We also conducted a sensitivity analysis by assigning a VF MD value of 0 for 57 control subjects who did not undergo SAP testing but only the FDT screening test. This relationship remained significant and accounted for 68% of the variability.
Figure 1.
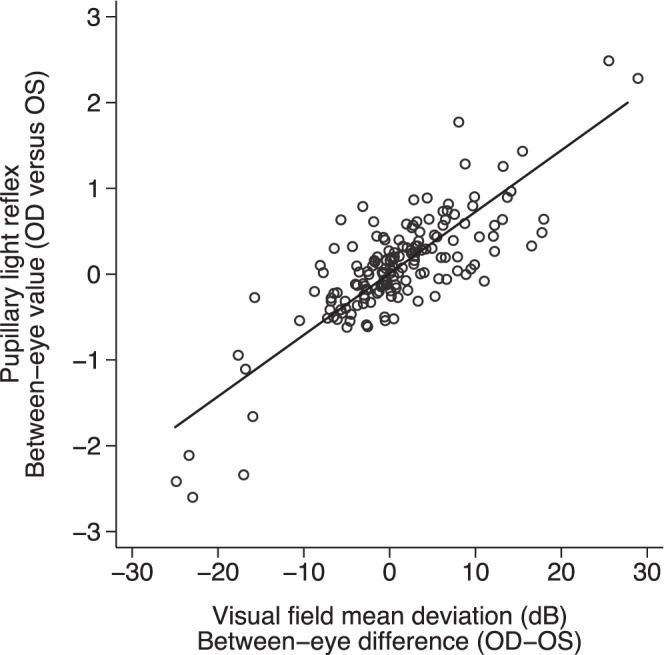
The relationship of between-eye symmetry in PLR and VF defect (P < 0.001, R = 0.83, R2 = 0.69).
Similarly, the between-eye asymmetry in PLR was significantly associated with the asymmetry in RNFL thickness between the two eyes (P < 0.001, R = 0.67, R2 = 0.45) (Fig. 2). On average, every 0.3–log unit increase in the absolute between-eye score was associated with a 3.2-μm difference in RNFL between the two eyes. When fitting a locally weighted smoothening curve, this linear relationship was altered when the difference in RNFL between the two eyes is large (>20 μm) (Fig. 2).
Figure 2.
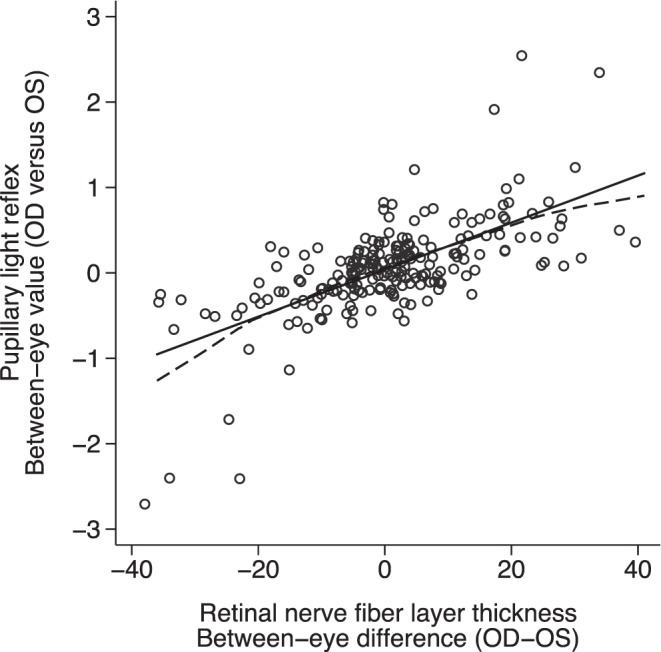
The relationship of between-eye asymmetry in PLR and RNFL thickness (P < 0.001, R = 0.67, R2 = 0.44). The solid line is the linear least squares regression and the dashed line is the locally weighted smoothed line.
Greater within-eye difference in the RNFL thickness between inferior and superior temporal quadrants was associated with greater difference in MD between superior and inferior nasal fields (P < 0.001, R2 = 0.16) (Fig. 3). However, greater within-eye superior-inferior asymmetry in PLR was not associated with greater asymmetry between superior and inferior MD (P = 0.94, R2 = 0.01) (Fig. 4) or greater differences in RNFL thickness (P = 0.66, R2 = 0.01) (Fig. 5).
Figure 3.
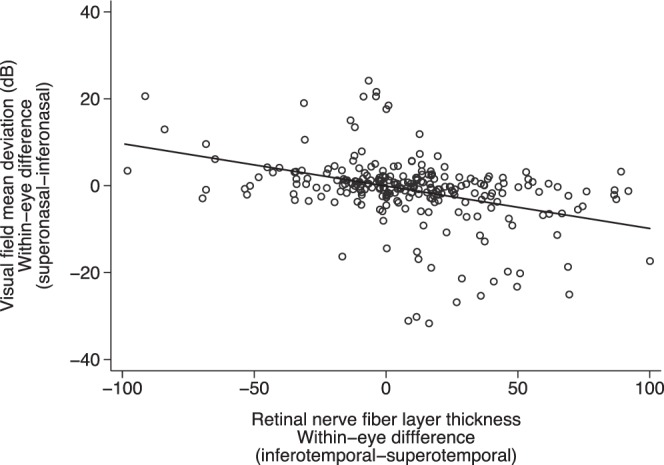
The relationship between within-eye asymmetry (superonasal versus inferonasal) of VF MD and corresponding RNFL (P < 0.001, R2 = 0.16). *Data of both eyes included.
Figure 4.
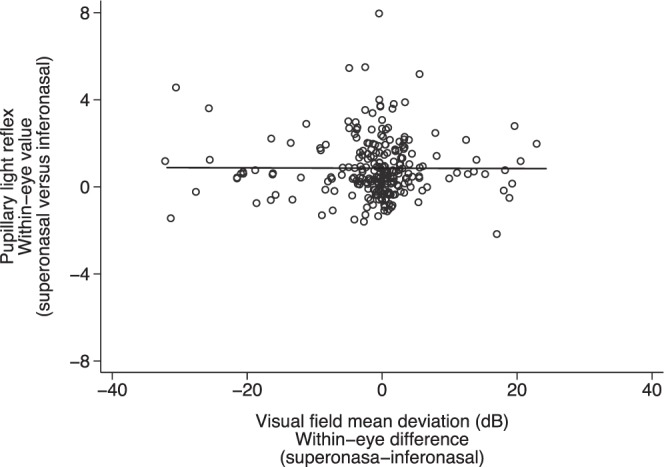
The relationship between within-eye symmetry (superonasal versus inferonasal) of PLR and VF defect (P = 0.939, R2 = 0.01). *Data of both eyes included.
Figure 5.
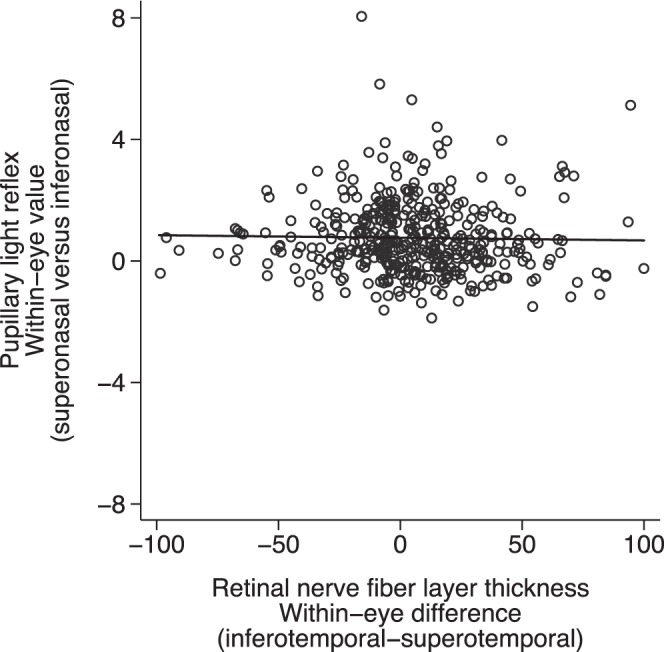
The relationship between within-eye asymmetry (superonasal versus inferonasal) of PLR and corresponding RNFL thickness (P = 0.661, R2 = 0.01). *Data of both eyes included.
Eyes with worse MD and thinner RNFL were associated with a smaller pupillary response under controlled stimuli (Figs. 6, 7). We also assessed the association between VF defect and RNFL thickness with PLR using multilevel modeling, adjusting for age and sex. Greater functional (VF) and structural (RNFL) loss was associated with smaller PLR amplitude, slower contraction and dilation velocities, longer latency, and longer time to maximum contraction and dilation velocities (Table 2).
Figure 6.
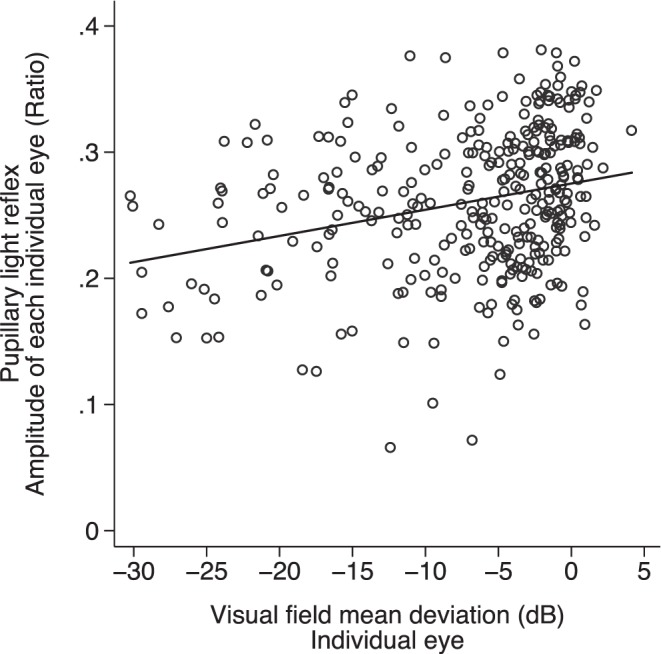
The relationship between PLR and VF MD for individual eyes (P < 0.001, R2 = 0.07).
Figure 7.
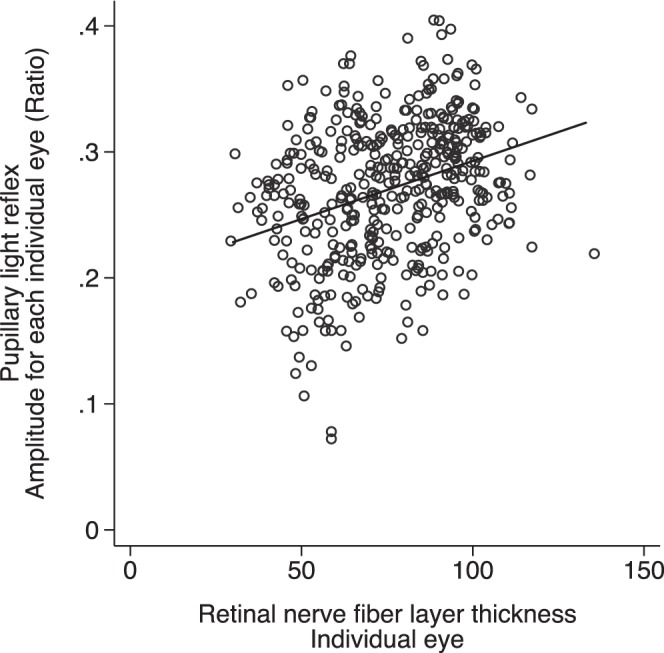
The relationship between PLR and RNFL thickness for individual eyes (P < 0.001, R2 = 0.10). *Data of both eyes included.
Table 2.
Multivariate Analysis of the Association Between PLR and Visual Field Defect and RNFL Thickness for Each Individual Eye
| Variable* |
Per 5-dB Less Negative in MD |
Per 10-μm Thicker in RNFL Thickness |
||
|
Mean (95% CI) |
P
Value |
Mean (95% CI) |
P
Value |
|
| Amplitude, ratio | 0.02 (0.02 to 0.02) | <0.001 | 0.01 (0.01 to 0.02) | <0.001 |
| Maximum contraction velocity, mm/s | 0.18 (0.15 to 0.20) | <0.001 | 0.13 (0.11 to 0.15) | <0.001 |
| Maximum dilation velocity, mm/s | 0.04 (0.01 to 0.07) | 0.011 | 0.02 (−0.01 to 0.04) | 0.197 |
| Latency, ms | −3.45 (−4.67 to −2.24) | <0.001 | −2.77 (−3.79 to −1.74) | <0.001 |
| Time to maximum contraction velocity, ms | −2.55 (−4.29 to −0.81) | 0.004 | −2.85 (−4.33 to −1.38) | <0.001 |
| Time to maximum dilation velocity, ms | 28.08 (22.77 to 33.39) | <0.001 | 17.42 (12.65 to 22.19) | <0.001 |
CI, confidence interval.
Data of both eyes were analyzed using multilevel modeling and adjusted for age and sex.
Discussion
A systematic review of 30 studies assessing PLR summarized that patients with glaucoma often had abnormal PLR compared with healthy subjects.17 We further documented a quantitative relationship between asymmetry of the PLR and the structural and functional loss measured with current diagnostic tests. Overall, PLR asymmetry is correlated with worse VF MD and decreasing RNFL thickness. These findings support the contention that quantitative measurement of PLR detects loss of optic nerve structure and function in glaucoma. Despite the correlations seen, it is difficult to compare the results of these modalities directly, as they measure different aspects of glaucomatous damage and have different scales or units. Visual field testing measures visual sensitivity over a 4–log unit range, RNFL thickness is measured over a linear range of approximately 25 to 200 μm, whereas the between-eye score ranges between 0 and 3 log units in healthy individuals.18
Models based on VF testing with histologic evaluation of the retinas of monkeys demonstrate a linear relationship between VF loss and RGC density in a log scale.9 However, there is no established method to directly translate the magnitude of PLR to ganglion cell density. We have demonstrated in this study that PLR is strongly correlated with VF MD and RNFL thickness.
For between-eye comparisons, studies have shown that an RAPD is detectable using the swinging flashlight test when approximately 25% to 50% of RGCs are lost in monkeys.5 In humans, the magnitude of an RAPD has also been shown to correlate with the amount of VF loss and the anatomic extent of retinal disease.13,14,19–21 Because pupillography is able to measure the entire waveform of pupil response, it is possible that it will be able to detect and quantify an RAPD with even less loss of RGCs. Using this method, we observed significant correlations between the magnitude of RAPD and the between-eye asymmetry in both VF and RNFL loss. Although previous studies have shown a nonlinear correlation between VF and RNFL,22 we did not see a clear threshold effect in the relationship between PLR and either VF or RNFL. This may be due to our study population having most values clustered around the mean, with only a small number of patients having severe disease, or it could be because we had a more sensitive device for detecting an RAPD.
When comparing within-eye asymmetry between superonasal and inferonasal fields, the RNFL results were strongly correlated with VF loss (Fig. 3). However, the within-eye asymmetry of PLR was not associated with the within-eye asymmetry in either RNFL or VF loss (Figs. 4, 5). A number of factors might explain this unexpected finding. First, unlike VF testing, we were not able to assess fixation losses during the pupillographic examination and hence the stimuli may not have been focused in the exact area of the retina that was intended. Second, the patterned stimulation from pupillography may not correspond to the calculated quadratic VF and RNFL. Third, VF is a threshold test, whereas PLR is a suprathreshold test. Previous investigations have shown significant variability in the VF when small numbers of ganglion cells are stimulated.23,24 This variability in responses from subjects with healthy ganglion cells means those with glaucoma might be harder to identify. Compared with other types of ganglion cells that transmit color and image information for VF testing, the ganglion cells that mediate the PLR were found to be much larger.25,26 They have dendrites that have been found to extend up to 1200 μm in length and intertwine with other ganglion cells and may therefore extend over large areas, and cross into other quadrants. Additionally, there are only 3000 of these cells compared with almost 1 million for visual information. This results in much less spatial resolution of the PLR compared with VF testing.
In conclusion, we found that the between-eye asymmetry in PLR amplitude measured using pupillography (a surrogate for RAPD) correlated strongly with both the difference in RNFL thickness and the difference in VF MD between the two eyes. The structural and functional loss was also correlated with the amplitude, velocity, and latency of the PLR during both contraction and recovery phases. Our findings confirm that pupillary responses to light are representative of ganglion cell function.
Acknowledgments
Supported by a training grant from the National Institute on Aging 2T32AG000247-16 (DC). The RAPiD pupillometry device was on loan from Konan Medical, Inc., Irvine, California (DF). The authors alone are responsible for the content and writing of the paper.
Disclosure: D.S. Chang, None; M.V. Boland, None; K.S. Arora, None; W. Supakontanasan, None; B.B. Chen, None; D.S. Friedman, Konan Medical, Inc. (F)
References
- 1. Feuer WJ, Anderson DR. Static threshold asymmetry in early glaucomatous visual field loss. Ophthalmology. 1989; 96: 1285–1297. [DOI] [PubMed] [Google Scholar]
- 2. Broman AT, Quigley HA, West SK, et al. Estimating the rate of progressive visual field damage in those with open-angle glaucoma, from cross-sectional data. Invest Ophthalmol Vis Sci. 2008; 49: 66–76. [DOI] [PMC free article] [PubMed] [Google Scholar]
- 3. Lankaranian D, Altangerel U, Spaeth GL, et al. The usefulness of a new method of testing for a relative afferent pupillary defect in patients with ocular hypertension and glaucoma. Trans Am Ophthalmol Soc. 2005; 103: 200–207; discussion 207–208. [PMC free article] [PubMed] [Google Scholar]
- 4. Ichhpujani P, Rome JE, Jindal A, et al. Comparative study of 3 techniques to detect a relative afferent pupillary defect. J Glaucoma. 2011; 20: 535–539. [DOI] [PubMed] [Google Scholar]
- 5. Kerrison JB, Buchanan K, Rosenberg ML, et al. Quantification of optic nerve axon loss associated with a relative afferent pupillary defect in the monkey. Arch Ophthalmol. 2001; 119: 1333–1341. [DOI] [PubMed] [Google Scholar]
- 6. Harwerth RS, Carter-Dawson L, Smith EL, et al. Neural losses correlated with visual losses in clinical perimetry. Invest Ophthalmol Vis Sci. 2004; 45: 3152–3160. [DOI] [PubMed] [Google Scholar]
- 7. Harwerth RS, Vilupuru AS, Rangaswamy NV, Smith EL. The relationship between nerve fiber layer and perimetry measurements. Invest Ophthalmol Vis Sci. 2007; 48: 763–773. [DOI] [PubMed] [Google Scholar]
- 8. Harwerth RS, Quigley HA. Visual field defects and retinal ganglion cell losses in patients with glaucoma. Arch Ophthalmol. 2006; 124: 853–859. [DOI] [PMC free article] [PubMed] [Google Scholar]
- 9. Wheat JL, Rangaswamy NV, Harwerth RS. Correlating RNFL thickness by OCT with perimetric sensitivity in glaucoma patients. J Glaucoma. 2012; 21: 95–101. [DOI] [PMC free article] [PubMed] [Google Scholar]
- 10. Tatsumi Y, Nakamura M, Fujioka M, et al. Quantification of retinal nerve fiber layer thickness reduction associated with a relative afferent pupillary defect in asymmetric glaucoma. Br J Ophthalmol. 2007; 91: 633–637. [DOI] [PMC free article] [PubMed] [Google Scholar]
- 11. Chew SSL, Cunnningham WJ, Gamble GD, Danesh-Meyer HV. Retinal nerve fiber layer loss in glaucoma patients with a relative afferent pupillary defect. Invest Ophthalmol Vis Sci. 2010; 51: 5049–5053. [DOI] [PubMed] [Google Scholar]
- 12. Schiefer U, Dietzsch J, Dietz K, et al. Associating the magnitude of relative afferent pupillary defect (RAPD) with visual field indices in glaucoma patients. Br J Ophthalmol. 2012; 96: 629–633. [DOI] [PubMed] [Google Scholar]
- 13. Johnson LN, Hill RA, Bartholomew MJ. Correlation of afferent pupillary defect with visual field loss on automated perimetry. Ophthalmology. 1988; 95: 1649–1655. [DOI] [PubMed] [Google Scholar]
- 14. Thompson HS, Montague P, Cox TA, Corbett JJ. The relationship between visual acuity, pupillary defect, and visual field loss. Am J Ophthalmol. 1982; 93: 681–688. [DOI] [PubMed] [Google Scholar]
- 15. Inazumi K, Tsuji A, Yamamoto T, Kitazawa Y. Evaluation of the Swedish interactive thresholding algorithm, a new thresholding algorithm, of the Humphrey Field Analyzer in glaucoma patients. Nippon Ganka Gakkai Zasshi. 1998; 102: 667–672. [PubMed] [Google Scholar]
- 16. Paczka JA, Friedman DS, Quigley HA, et al. Diagnostic capabilities of frequency-doubling technology, scanning laser polarimetry, and nerve fiber layer photographs to distinguish glaucomatous damage. Am J Ophthalmol. 2001; 131: 188–197. [DOI] [PubMed] [Google Scholar]
- 17. Chang DS, Xu L, Boland MV, Friedman DS. Accuracy of pupil assessment for the detection of glaucoma: a systematic review and meta-analysis [published online ahead of print June 25, 2013] Ophthalmology. doi:101016/j.ophtha.2013.04.012. [DOI] [PMC free article] [PubMed] [Google Scholar]
- 18. Ghadiali Q, Hood DC, Lee C, et al. An analysis of normal variations in retinal nerve fiber layer thickness profiles measured with optical coherence tomography. J Glaucoma. 2008; 17: 333–340. [DOI] [PMC free article] [PubMed] [Google Scholar]
- 19. Kardon RH, Haupert CL, Thompson HS. The relationship between static perimetry and the relative afferent pupillary defect. Am J Ophthalmol. 1993; 115: 351–356. [DOI] [PubMed] [Google Scholar]
- 20. Bovino JA, Burton TC. Measurement of the relative afferent pupillary defect in retinal detachment. Am J Ophthalmol. 1980; 90: 19–21. [DOI] [PubMed] [Google Scholar]
- 21. Newsome DA, Milton RC, Gass JD. Afferent pupillary defect in macular degeneration. Am J Ophthalmol. 1981; 92: 396–402. [DOI] [PubMed] [Google Scholar]
- 22. Leung CK-S, Medeiros FA, Zangwill LM, et al. American Chinese glaucoma imaging study: a comparison of the optic disc and retinal nerve fiber layer in detecting glaucomatous damage. Invest Ophthalmol Vis Sci. 2007; 48: 2644–2652. [DOI] [PubMed] [Google Scholar]
- 23. Quigley HA, Dunkelberger GR, Green WR. Retinal ganglion cell atrophy correlated with automated perimetry in human eyes with glaucoma. Am J Ophthalmol. 1989; 107: 453–464. [DOI] [PubMed] [Google Scholar]
- 24. Kerrigan-Baumrind LA, Quigley HA, Pease ME, et al. Number of ganglion cells in glaucoma eyes compared with threshold visual field tests in the same persons. Invest Ophthalmol Vis Sci. 2000; 41: 741–748. [PubMed] [Google Scholar]
- 25. Chen S-K, Badea TC, Hattar S. Photoentrainment and pupillary light reflex are mediated by distinct populations of ipRGCs. Nature. 2011; 476: 92–95. [DOI] [PMC free article] [PubMed] [Google Scholar]
- 26. Güler AD, Ecker JL, Lall GS, et al. Melanopsin cells are the principal conduits for rod–cone input to non-image-forming vision. Nature. 2008; 453: 102–105. [DOI] [PMC free article] [PubMed] [Google Scholar]