Background: Polyglutamine tract expansion within disease-associated proteins leads to protein aggregation and disease.
Results: Molecular mobility of a single α-helix within ataxin-3 positively scales with polyglutamine tract length and drives misfolding and aggregation.
Conclusion: Polyglutamine expansion allosterically enhances the molecular dynamics of folded regions to trigger amyloid-like fibril formation.
Significance: This work resolves the mechanistic link between polyglutamine tract length and aggregation.
Keywords: amyloid, ataxia, Huntington disease, molecular dynamics, polyglutamine, protein misfolding, Machado-Joseph disease, ataxin-3, spinocerebellar ataxia type-3
Abstract
Polyglutamine expansion is a hallmark of nine neurodegenerative diseases, with protein aggregation intrinsically linked to disease progression. Although polyglutamine expansion accelerates protein aggregation, the misfolding process is frequently instigated by flanking domains. For example, polyglutamine expansion in ataxin-3 allosterically triggers the aggregation of the catalytic Josephin domain. The molecular mechanism that underpins this allosteric aggregation trigger remains to be determined. Here, we establish that polyglutamine expansion increases the molecular mobility of two juxtaposed helices critical to ataxin-3 deubiquitinase activity. Within one of these helices, we identified a highly amyloidogenic sequence motif that instigates aggregation and forms the core of the growing fibril. Critically, by mutating residues within this key region, we decrease local structural fluctuations to slow ataxin-3 aggregation. This provides significant insight, down to the molecular level, into how polyglutamine expansion drives aggregation and explains the positive correlation between polyglutamine tract length, protein aggregation, and disease severity.
Introduction
Nine progressive neurodegenerative diseases are caused by the expansion of polyglutamine (polyQ)3 repeats beyond a threshold length (30–40) within disease-linked genes (1). Each of the genes encode proteins with no easily identifiable sequence or functional similarity except the polyQ expansion mutation (2). The expanded polyQ tracts trigger the aggregation of the disease-associated proteins into amyloid-like fibrils (3–5). Protein aggregates are deposited as neuronal inclusions in disease-affected patients, and are generally recognized as a hallmark of polyQ diseases (6).
Although neuronal inclusions appear to be protective in nature, evidence suggests that the misfolding and aggregation of polyQ proteins significantly contribute to cellular toxicity and disease pathogenesis. Although the precise toxic mechanism is widely debated, the misfolded monomer and other toxic species formed during misfolding may contribute to disease pathology (7, 8). PolyQ misfolding has been extensively characterized using short peptides, providing the simplest model of aggregation (9). The peptides undergo nucleation-dependent polymerization characterized by structural conversion from random-coil to amyloid-like β-sheet aggregates (10, 11). The aggregation rate positively scales with polyQ tract length and is thought to explain, in part, the inverse correlation between polyQ tract length and disease onset (11).
However, numerous studies have demonstrated that the protein context of the polyQ tract can dramatically change the misfolding mechanism, aggregation pathway, and degree of cytotoxicity (2). Residues surrounding the polyQ tract, flanking domains, post-translational modifications, and physiological binding partners all significantly alter the aggregation pathway and toxicity of polyQ proteins (12–17). Within full-length proteins, the polyQ tract itself can allosterically trigger the aggregation of flanking domains. For example, polyQ expansion in huntingtin triggers the aggregation of an upstream α-helical region of the protein. Only then does the polyQ tract participate in a distinct aggregation step (15). Similarly, domains flanking the polyQ tract can also direct the aggregation pathway of model polyQ proteins in vivo (18).
A multi-stage aggregation pathway is also apparent for pathological-length ataxin-3, the causative protein of spinocerebellar ataxia type-3 (Machado-Joseph disease) (19, 20). Ataxin-3 is a ubiquitin chain-editing deubiquitinase composed of a globular N-terminal catalytic Josephin domain and a highly flexible and largely unstructured tail containing two ubiquitin-interacting motifs and the polyQ tract (see Fig. 1A) (21–24). Ataxin-3 has a two-stage aggregation process, whereby the N-terminal Josephin domain (residues 1–182) misfolds and aggregates prior to the participation of the polyQ tract (see Fig. 1B) (25–28). The second stage is dependent on a pathological-length polyQ tract (>50), and alters the morphology of the fibrils to form the characteristic SDS-stable polyQ aggregates (26).
FIGURE 1.
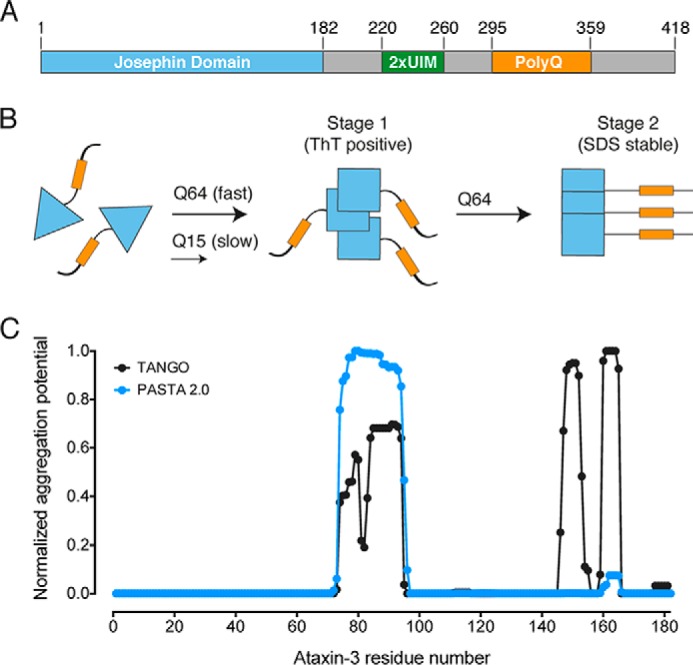
The ataxin-3 aggregation pathway. A, ataxin-3 domain layout with domains and the polyQ tract indicated. 2xUIM, two ubiquitin-interacting motifs. B, schematic representation of the two-stage aggregation pathway of ataxin-3. Pathologically expanded ataxin-3 aggregates at a faster rate than non-expanded ataxin-3. Conformational changes within the Josephin domain (blue triangles) define the first-stage of aggregation. Only expanded ataxin-3 progresses to a second stage, defined by the formation of SDS-stable aggregates (yellow rectangles indicate poly(Q) tract). C, computational prediction of amyloidogenic regions of the ataxin-3 Josephin domain.
The isolated Josephin domain is highly prone to aggregation, defines the morphological characteristics of the first ataxin-3 aggregation stage, and is cytotoxic in mouse models (25, 29–31). However, the propensity of the Josephin domain to aggregate is not sufficient to explain disease severity. The rate of ataxin-3 aggregation is still heavily influenced by polyQ tract length, with pathologically expanded ataxin-3(Q64) aggregating faster than non-expanded ataxin-3(Q15) (26). In many protein misfolding diseases, disease-associated mutations cause a global reduction in protein stability, driving aggregation through partially folded intermediate species (32). Surprisingly, and in contrast to this, the thermodynamic and kinetic stability of ataxin-3 is not altered by polyQ tract length (33). These data suggest that ataxin-3 aggregation is not triggered by global unfolding, but instead proceeds from a native or near-native confirmation. However, the molecular and biophysical basis by which polyQ tract expansion triggers ataxin-3 misfolding and aggregation is unknown.
Here, we report the biophysical basis for the critical link between polyQ tract length and aggregation in ataxin-3. Hydrogen deuterium exchange coupled with mass spectrometry (HDX-MS) identified a highly localized polyQ-dependent increase in the molecular mobility of two juxtaposed helices within the ataxin-3 catalytic domain. Within one of these helices, we identified a highly amyloidogenic sequence motif that instigates ataxin-3 aggregation and forms the core of the growing fibril. Critically, by mutating residues within this key region, we decreased local structural fluctuations to reverse the enhanced aggregation of pathologically expanded ataxin-3. These data demonstrate a causative link between enhanced molecular mobility and pathological ataxin-3 aggregation. Therefore, we propose that enhanced molecular mobility in ordinarily structured regions of ataxin-3 explains the positive correlation between polyQ tract length, protein aggregation, and disease severity.
Experimental Procedures
Peptide Synthesis
All peptides were purchased from GenScript (Piscataway, NJ).
Expression and Purification of Ataxin-3 Variants
All ataxin-3 variants were expressed and purified as described previously (26). Alanine mutations of ataxin-3(Q64) were produced using the QuikChange site-directed mutagenesis kit (Stratagene). All proteins were monomeric prior to the commencement of any experiments as monitored by size exclusion chromatography.
Thioflavin-T (ThT) Assays
Peptides were solubilized in dimethyl sulfoxide at 10 mg/ml, with any non-suspended material removed by centrifugation. Peptides were diluted to 0.1 mg/ml in Tris-buffered saline (20 mm Tris, 150 mm NaCl, pH 7.4) containing 20 μm ThT, 2 mm β-mercaptoethanol, and 5 mm EDTA. Ataxin-3(Q64) aggregation assays were performed as described previously (26). Ataxin-3(Q64) variants at 30 μm were assayed for ThT fluorescence in 100 mm Tris, 80 mm NaCl, 10% (v/v) glycerol, 5 mm EDTA, 15 mm β-mercaptoethanol, 2 mm PMSF, and 20 μm ThT, pH 7.4. Fluorescence was recorded from the bottom of the plates at 37 °C (Molecular Devices SpectraMax Gemini EM microplate reader), with no shaking, and the plate was sealed to eliminate evaporation.
TEM
TEM images were obtained using a Hitachi (Tokyo, Japan) H7500 transmission electron microscope. The acceleration voltage was 100 kV. Samples were adsorbed onto carbon-coated grids and stained with 1% (w/v) uranyl acetate.
Membrane Filter Trap Assay
Ataxin-3 variants were prepared at 30 μm in 100 mm Tris, 80 mm NaCl, 10% (v/v) glycerol, 5 mm EDTA, 15 mm β-mercaptoethanol, 2 mm PMSF, pH 7.4. Samples were incubated at 37 °C in sealed capped tubes, and 0.5–2 μg of protein was used in the membrane filter trap assay as described previously (26).
Stopped-flow Fluorescence
Stopped-flow acid unfolding and refolding were monitored as described previously (33). In short, changes in fluorescence during unfolding and refolding were measured at 25 °C using an Applied Photophysics SF.18MV stopped-flow apparatus with excitation and emission wavelengths set at 278 and 360 nm, respectively. Protein unfolding was monitored by mixing a 1:1 ratio of 2.5 μm ataxin-3(Q64) with 50 mm HCl (pH 1.3), to a final pH of 1.9. For the refolding experiments, ataxin-3(Q64) was unfolded by incubating equal parts 5 μm protein in PBS with 50 mm HCl (pH 1.3) for 30 min. After incubation, the unfolded protein was mixed with 20× PBS at a 1:1 ratio to reach a final pH of 7.2. Unfolding and refolding rates were fit to single and double exponential curves, respectively, using the supplied software.
Peptide Mapping by HPLC-Tandem Mass Spectrometry
Peptide mapping was performed as described previously (34). In brief, 5 μg of purified Josephin domain or ataxin-3 (in 100 μl of 100 mm Tris, pH 7.4, and 80 mm NaCl) was mixed with 95 μl of 0.5% TFA (pH 2.4). 5 μg of porcine pepsin dissolved in 0.05% (v/v) TFA was added for 5 min on ice. The digested sample was injected into a micropeptide trap (Grace Scientific) connected to an Everest C18 column (50 × 1 mm, 5 μm, Grace Davison) and a Bruker micrOTOF mass spectrometer. Peptic fragments were eluted with a gradient of acetonitrile at a flow rate of 50 μl/min for tandem mass spectrometry to sequence each peptic fragment. Peptic fragments were identified by using the Mascot search algorithm.
HDX-MS
25 μg of the Josephin domain or ataxin-3 (in 100 mm Tris, pH 7.4, and 50 mm NaCl) was diluted 24-fold in 100 mm Tris and 80 mm NaCl dissolved in D2O (Cambridge Isotope Laboratories) at 25 °C. The reaction was quenched at different time points by adding an equal volume of 0.5% TFA (pH 2.4) followed by rapid freezing of samples. The first experimental time point measured was 10 s after initiation of the experiment, and all variants retained their monomeric form during deuterium exchange.
Isotope Analysis by HPLC-Electrospray Ionization Mass Spectrometry
Frozen HDX-MS samples were thawed and digested with 5 μg of pepsin on ice for 5 min, followed by immediate injection into a micropeptide trap connected to a C18 HPLC column and a Bruker micrOTOF mass spectrometer. Peptides were eluted in 12 min using a gradient of 10–45% acetonitrile at a flow rate of 50 μl/min. The micropeptide trap and C18 HPLC column were immersed in ice to minimize back exchange. To correct for any back exchange reaction of hydrogen atoms during pepsin digestion and HPLC-MS, a fully deuterated sample was prepared by incubating 5 μg of the Josephin domain or ataxin-3 variants in 6 m guanidine deuterochloride, 50 mm Tris (pH 8), and 50 mm NaCl for 16 h at 25 °C. This sample was then quenched and subjected to peptic digestion and LC-MS under conditions identical to those of the experimental samples, resulting in an average back exchange of 21.5%. The deuterium incorporation of each peptic fragment, corrected for the back exchange, was calculated using the following equation: D/N = ((m − m0%)/(m100% − m0%)), where m is the mass of deuterated peptic fragment, m0% and m100% are the mass of the unlabeled and fully deuterated peptic fragments, respectively, N is the total number of exchangeable amide hydrogen atoms in each peptic fragment, and D is the number of amide hydrogen atoms incorporated in each peptide (35). The number of deuterium, D, in each peptic fragment was plotted versus time and fit to the following equation (34)
where N is the total number of exchangeable hydrogens, and Nfast, Nint, and Nslow are the numbers of fast-, intermediate-, and slow-exchanging amide hydrogen atoms, respectively. The corresponding observed exchange rate constants are kfast, kint, and kslow. Data were fit using a nonlinear least-squares analysis in GraphPad Prism.
Fibril Core Identification by Limited Proteolysis and HPLC-Tandem Mass Spectrometry
Josephin domain fibrils were formed as described previously for ataxin-3 (26) and harvested using ultracentrifugation. Josephin fibrils (50 μg) were digested for 3 h with proteinase K in 100 mm Tris (pH 7.4) and 80 mm NaCl. Digestion was quenched with PMSF. The digested sample was injected into a micropeptide trap (Grace Scientific) connected to a C18 HPLC column (10 cm × 1 mm, Alltech) and a Bruker micrOTOF mass spectrometer. Peptic fragments were eluted with a gradient of acetonitrile at a flow rate of 50 μl/min for tandem mass spectrometry to sequence each peptic fragment. Peptic fragments were identified using the Mascot search algorithm.
Results
The Josephin Domain Contains Three Discrete Amyloidogenic Regions
To begin to identify critical regions that instigate ataxin-3 fibril formation, we carried out computational analysis of the Josephin domain sequence to predict regions prone to amyloid fibril formation (Fig. 1C). Tango and PASTA 2.0 (36, 37) both identified residues 72–96 as having increased potential to form amyloid fibrils. Tango identified two further sequence regions corresponding to residues 146–155 and 159–165, whereas PASTA 2.0 only identified residues 159–165 as having increased amyloidogenic potential in this region.
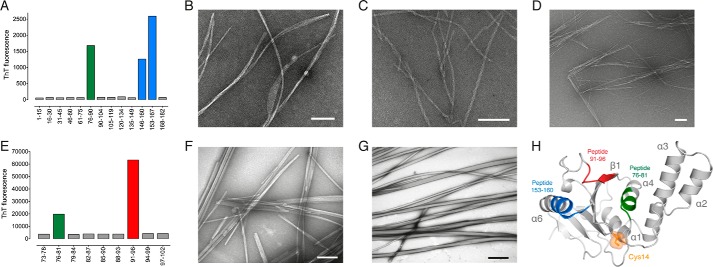
Next, we experimentally identified potential amyloidogenic regions by screening with sequential 15-residue peptides derived from the Josephin domain sequence. Overlapping peptides were used in areas predicted to be particularly prone to β-aggregation. After 64 h, peptides 76–90, 146–160, and 153–167 increased ThT fluorescence, indicating amyloid-like fibril formation (Fig. 2A). The fibrils had a linear and unbranched morphology, an average diameter of 8–14 nm, and a variable length often greater than 5 μm (Fig. 2, B–D). Fibrils formed by peptide 76–90 displayed a banded morphology, peptide 146–160 had a twisted arrangement, and peptide 153–167 had a distinct needle-like morphology.
FIGURE 2.
Identification of key amyloidogenic regions of ataxin-3. A, peptide scanning of the Josephin domain with aggregation monitored by ThT fluorescence. B–D, TEM of fibrils formed by peptides 76–90 (B), 146–160 (C), and 153–167 (D). E, peptide scanning of Josephin domain residues 73–102. F and G, TEM of fibrils formed by peptides 76–81 (F) and 91–96 (G). H, graphic representation of the Josephin domain solution structure with key amyloidogenic regions mapped onto the structure (Protein Data Bank (PDB) code 1YZB (22)). Scale bar equals 100 nm.
Next, we screened further within the 73–102 region using overlapping 6-residue peptides (Fig. 2E). Peptides 76–81 and 91–96 formed amyloid-like fibrils with an average length of greater than 5 μm and highly variable width (Fig. 2, F–G). Peptide 76–81 formed fibrils with a rod-like morphology (Fig. 2F), whereas peptide 91–96 fibrils were rope-like and often twisted (Fig. 2G). Interestingly, residues 91–96 are also found in the original 15-residue peptide 90–104 that did not aggregate (Fig. 2A). Here, the geometric constraints of a proline residue positioned within peptide 90–104 likely disfavors stable β-sheet structure, explaining the inability of this 15-residue peptide to form fibrils.
The identified amyloidogenic peptides of the Josephin domain correlate well with the in silico predictions, and map to three discrete regions of the solution structure. These regions are positioned on opposite sides of the Josephin domain to the catalytic Cys14 (Fig. 2H). Peptide 76–81 corresponds to helix-α4, positioned in the solvent-exposed cleft formed by the central β-sheet and helices α2-α3. Peptide 91–96 maps to strand-β1 of the central β-sheet in the same cleft as peptide 76–81. The overlapping sequence of peptides 146–160 and 153–167 (153–160) is positioned on the highly solvent-exposed helix-α6. Together, these data identify three structural regions within the Josephin domain that readily form amyloid-like fibrils, and could play an important role in ataxin-3 aggregation.
The Molecular Mobility of the Josephin Domain Is Linked to polyQ Tract Length
PolyQ expansion does not trigger aggregation by reducing the global thermodynamic or kinetic stability of ataxin-3 (33). Here, we reasoned that polyQ expansion may trigger aggregation by enhancing the molecular mobility of the three amyloidogenic regions within the Josephin domain (Fig. 2H). This would result in a novel near-native aggregation pathway, characterized by a sliding scale of dynamic structural fluctuations that become more apparent with longer polyQ tracts.
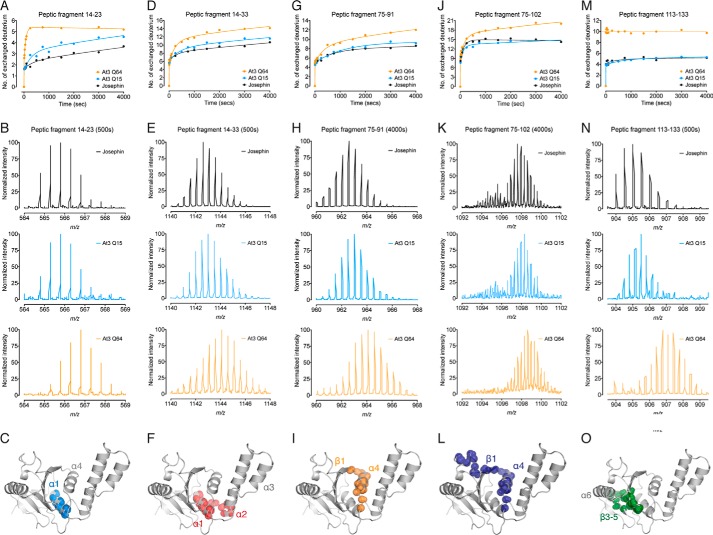
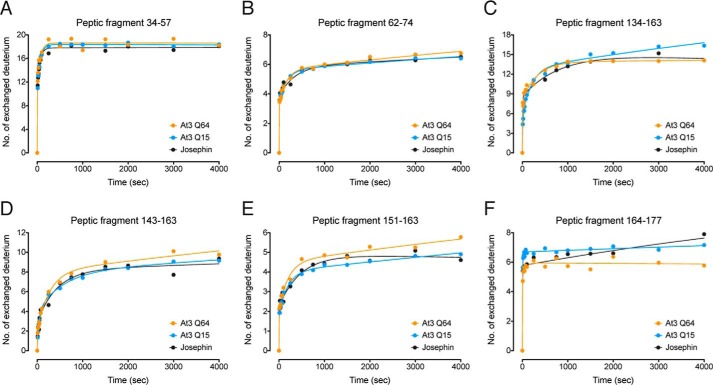
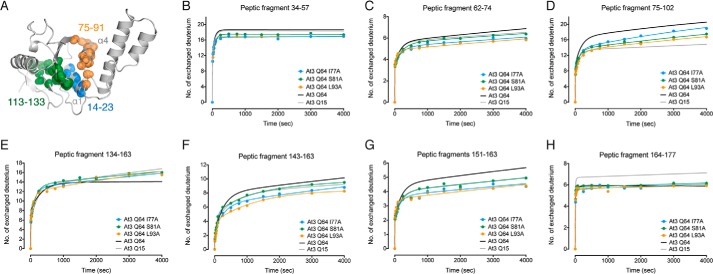
To investigate this, we used comparative HDX-MS analysis of the Josephin domain alone, ataxin-3(Q15), and pathologically expanded ataxin-3(Q64). Pepsin digestion of undeuterated protein identified 11 peptic fragments that covered ∼80% of the Josephin domain. Critically, we detected five peptic fragments with an increased rate of deuterium incorporation upon pathological expansion of the polyQ tract (Fig. 3). There was no effect of increasing polyQ tract length for the remaining six of the peptic fragments, in either the rate or the extent of deuterium incorporation (Fig. 4). Peptide 14–23 displayed a clear polyQ-dependent increase in the rate and extent of deuterium incorporation, from the Josephin domain, to ataxin-3(Q15), and ataxin-3(Q64) (Fig. 3, A–C). This was also observed for the overlapping peptide 14–33, with an increase in both the rate and the number of deuterium exchanged (Fig. 3,D–F).
FIGURE 3.
Molecular mobility of the Josephin domain is linked to polyQ tract length. A, HDX-MS kinetics of peptic fragment 14–23 in the Josephin domain, ataxin-3(Q15), and ataxin-3(Q64). B, representative m/z spectra of peptic fragment 14–23 after 500 s. C, residues 14–23 form helix-α1 in the Josephin domain. D, HDX-MS kinetics of peptic fragment 14–33 with representative m/z spectra after 500 s displayed in E. F, residues 14–33 form helix-α1 and the base of helix-α2. G, HDX-MS kinetics of peptic fragment 75–91 with representative m/z spectra after 4000 s displayed in H. I, residues 75–91 form helix-α4 and part of strand-β1. J, HDX-MS kinetics of peptic fragment 75–102 with representative m/z spectra after 4000 s displayed in K. L, residues 75–102 form helix-α4 and part of strand-β1. M, HDX-MS kinetics of peptic fragment 113–133 with representative m/z spectra after 500 s displayed in N. O, residues 113–133 form strands β3-β5 of the central β-sheet. The peptic fragments are shown as spheres at the backbone amide positions (PDB code 1YZB (22)).
FIGURE 4.
Peptic fragments that showed no polyQ-dependent change in HDX-MS kinetics. A–F, peptic fragments 34–57 (A), 62–74 (B), 134–163 (C), 143–163 (D), 151–163 (E), and 164–177 (F).
Residues 14–23 contain the catalytic Cys14 and form helix-α1 that sits on the central β-sheet and makes hydrophobic interactions with helix-α4 (Fig. 3C) (22). Of the nine backbone amides available for exchange, seven make α-helical hydrogen bonds with backbone carbonyls, and Glu16 forms a hydrogen bond with Leu13 at the beginning of helix-α1. This leaves one solvent-exposed amide available for exchange without the additional breakage of hydrogen bonds. Within the Josephin domain and ataxin-3(Q15), four deuteriums were slowly exchanged. In contrast, five deuteriums were rapidly exchanged in ataxin-3(Q64). These data suggest that the increase in structural perturbations and the partial loss of hydrogen bonding within this helix are polyQ length-dependent. As such, local unfolding and structural perturbations of helix-α1 occur at a faster rate and are more extensive in ataxin-3(Q64) as compared with ataxin-3(Q15) or the Josephin domain alone.
We also observe a polyQ-dependent increase in HDX-MS kinetics and the number of deuteriums incorporated into peptide 75–91 (Fig. 3, G–I) and the overlapping peptide 75–102 (Fig. 3, J–L). Of the 16 backbone amides available in peptide 75–91, nine are exchanged in ataxin-3(Q15) and the Josephin domain, with 12 exchanged at a faster rate in ataxin-3(Q64). Residues 75–91 form helix-α4 and strand-β1 of the Josephin domain, and all but three backbone amides are hydrogen-bonded (Fig. 3I). As such, these polyQ length-dependent differences are consistent with a greater degree and faster rate of local unfolding that exposes backbone amides of helix-α4 and strand-β1 to the solvent.
We also detected a clear difference in the number of deuteriums exchanged in peptide 113–133, consistent with a conformational change in the Josephin domain upon polyQ expansion (Fig. 3, M–O). 10 deuteriums are rapidly exchanged in ataxin-3(Q64), as compared with only five in the Josephin domain and ataxin-3(Q15) (Fig. 3, M and N). Residues 113–133 form strands β3-β5 of the central β-sheet, with the majority of backbone amides forming hydrogen bonds within the β-sheet core (Fig. 3O). The β3-β4 turn is solvent-exposed and is the likely source of exchange of four deuteriums from each ataxin-3 variant. C-terminal helix-α7 shields the β4-β5 turn from the solvent in the Josephin domain structure (22). Downstream polyQ expansion likely displaces helix-α7 from the surface of the domain, allowing rapid exchange of the remaining backbone amides of the β4-β5 turn in ataxin-3(Q64).
Ataxin-3 Aggregation Rate and Protein Stability Can Be Uncoupled
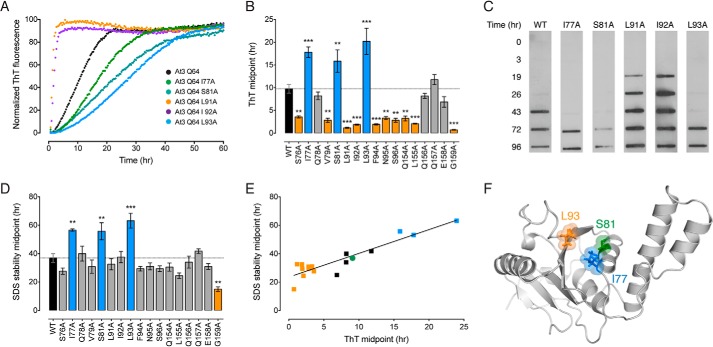
To delineate the role of the Josephin domain in instigating aggregation, we used alanine-scanning mutagenesis of ataxin-3(Q64) in the amyloidogenic regions identified by peptide screening. Ataxin-3(Q64) aggregates in two stages (Fig. 1B). The first aggregation stage is characterized by a conformational change in the Josephin domain, and the protein forms highly ThT fluorescent fibrils that are soluble in SDS (25, 26). The second stage is dependent on an expanded polyQ tract and converts the first-stage fibrils into SDS-insoluble aggregates without any further increase in ThT fluorescence (26). As such, ThT fluorescence and SDS stability are used as measures of the first and second aggregation steps, respectively (Fig. 5).
FIGURE 5.
Alanine-scanning mutagenesis of the ataxin-3(Q64) catalytic domain. A, representative ThT kinetic traces of the first aggregation stage of wild-type ataxin-3(Q64) or indicated alanine-scanning mutants. B, midpoints of the first aggregation stage of ataxin-3(Q64) alanine-scanning mutants. Mutants that aggregated significantly slower than wild-type protein are in blue, mutants that aggregated faster are in orange, and mutants that showed no change are in gray. C, the second aggregation stage was monitored by measuring SDS insolubility with a membrane filter trap assay. Representative blots of wild-type ataxin-3(Q64) or indicated alanine-scanning mutants are shown. D, midpoints of the second aggregation stage of ataxin-3(Q64) alanine-scanning mutants colored as per B. E, linear relationship between the two stages of ataxin-3(Q64) aggregation in the alanine-scanning mutants. Control ataxin-3(Q64) is represented as a green circle, mutants that aggregate slower in blue, and mutants that aggregate faster are in orange. F, location of the alanine mutations in the structure of the Josephin domain (PDB code 1YZB (22)). Error bars indicate means ± S.E. **, p < 0.01 and ***, p < 0.001 versus wild-type, one-way analysis of variance with Dunnett's multiple comparison test (n = 3–5).
I77A, S81A, and L93A significantly decreased the rate of first-stage ataxin-3(Q64) aggregation (Fig. 5, A and B). The rate was unchanged for another four alanine mutants and accelerated for the remaining 10 (Fig. 5B). I77A, S81A, and L93A also significantly decreased the rate of the second polyQ-dependent stage (Fig. 5, C and D). The second-stage aggregation rate significantly increased for G159A, but was unchanged for the remaining mutants (Fig. 5, C and D). The aggregation midpoints of the two stages revealed a linear correlation, illustrating a sequential link between the two stages of ataxin-3 aggregation (Fig. 5E).
Next, we used stopped-flow acid folding analysis to measure the kinetic stability of the ataxin-3(Q64) alanine mutants. Ataxin-3(Q64) unfolds with a single rate (Ku) and refolding fits to a double exponential equation (Kf1 and Kf2) (33). Both the unfolding and the refolding rates varied widely for each of the alanine-scanning mutants (Fig. 6). Seven of the 17 mutants significantly increased the unfolding rate, reflecting a decreased kinetic stability. The remainder were largely unchanged (Fig. 6B).
FIGURE 6.
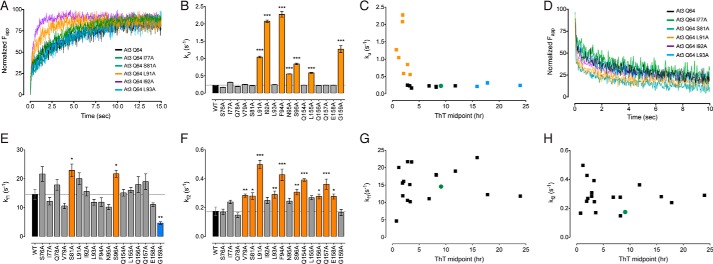
Stopped-flow folding of ataxin-3 and alanine-scanning mutants. A, representative stopped-flow traces for wild-type ataxin-3(Q64) and selected mutants undergoing pH-induced unfolding. B, stopped-flow acid unfolding rate of ataxin-3(Q64) mutants. Mutants that aggregated significantly slower than wild-type protein are in blue, mutants that aggregated faster are in orange, and mutants that showed no change are in gray. C, relationship between the first-stage aggregation rate and the unfolding rate. Control ataxin-3(Q64) is represented as a green circle, mutants that aggregate slower are in blue, and mutants that aggregate faster are in orange. D, representative stopped-flow traces for wild-type ataxin-3(Q64) and selected mutants undergoing pH-induced refolding. E, stopped-flow acid refolding rate Kf1 of ataxin-3(Q64) mutants colored as per B. F, stopped-flow acid refolding rate Kf2 of ataxin-3(Q64) mutants colored as per B. G and H, relationship between the first-stage aggregation rate and Kf1 (G) or Kf2 (H). Error bars indicate means ± S.E. *, p < 0.05, **, p < 0.01, ***, p < 0.001 versus wild-type, one-way analysis of variance with Dunnett's multiple comparison test (n = 3–5).
All kinetically destabilized mutants aggregated significantly faster than control ataxin-3(Q64) (Fig. 6C). In contrast, there was a wide variation in the aggregation rate of mutants with a comparable unfolding rate to control ataxin-3(Q64) (Fig. 6C). These include ataxin-3(Q64) I77A, S81A, and L93A, which aggregate significantly slower than control ataxin-3(Q64). Within the Josephin domain structure, I77A and S81A are clustered within helix-α4, with L93A located on strand-β1 (Fig. 5F). Each of these residues are situated within the peptic fragments that showed a polyQ-dependent increase in molecular mobility (Fig. 3). In contrast to the unfolding kinetics, no correlation was evident between the refolding and aggregation rates (Fig. 6, D–H). Together, these data demonstrate that the stability of ataxin-3(Q64) and its aggregation rate can be uncoupled. This is of particular interest, as we have previously shown that although polyQ expansion results in a faster rate of aggregation, it does not affect global stability (33).
Localized Structural Perturbations Link polyQ Expansion to Aggregation
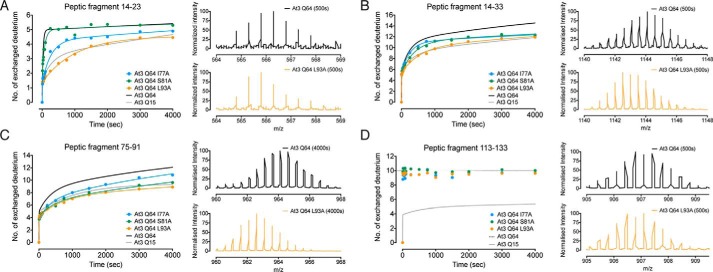
To confirm the link between localized ataxin-3 mobility and aggregation, we carried out HDX-MS on the three ataxin-3(Q64) mutants (I77A, S81A, and L93A) that showed a decrease in aggregation rate with no effect on protein stability. The rate of deuterium incorporation in peptic fragment 14–23 was reduced in both I77A and L93A ataxin-3(Q64) to levels comparable with ataxin-3(Q15) (Fig. 7A). A similar trend was observed in the overlapping peptide 14–33, with L93A displaying the most prominent reduction in exchange rate (Fig. 7B). Furthermore, the rate of deuterium incorporation in peptide 75–91 and the overlapping peptide 75–102 were also reduced to levels comparable with ataxin-3(Q15) for the three mutants (Figs. 7C and 8D).
FIGURE 7.
Localized structural perturbations link polyQ expansion to aggregation. A–D, HDX-MS kinetics of ataxin-3(Q64) I77A, S81A, and L93A with peptic fragments 14–23 (A), 14–33 (B), 75–91 (C), and 113–133 (D) represented in comparison with wild-type ataxin-3(Q64) (black) and ataxin-3(Q15) (gray). For each peptic fragment, representative m/z spectra of wild-type ataxin-3(Q64) and ataxin-3(Q64) L93A are shown for comparison.
FIGURE 8.
HDX-MS kinetics of peptic fragments of ataxin-3(Q64) and alanine-scanning mutants. A, peptic regions of the Josephin domain in which alanine-scanning mutations decreased HDX-MS kinetics are shown as spheres at backbone amide positions (PDB code 1YZB (22)). B–H, peptic fragments 34–57 (B), 62–74 (C), 75–102 (D), 134–163 (E), 143–163 (F), 151–163 (G), and 164–177 (H) represented in comparison with wild-type ataxin-3(Q64) (black), and ataxin-3(Q15) (gray).
Helix-α4 makes significant hydrophobic contacts with helix-α1 and the central β-sheet (Fig. 8A). Both Leu93 and Iso77 contribute to this hydrophobic packing, with Ser81 positioned at the solvent-exposed side of helix-α4 (Fig. 5F). Here, we find that alanine mutation significantly reduced the molecular mobility of helix-α4 (Fig. 7C), with upstream effects on the juxtaposed helix-α1 (Fig. 7, A and B). The mutation of Leu93 and Iso77 to the smaller hydrophobic alanine residue may have enhanced the packing of helix-α4 into the core of the domain by removing the steric hindrance of the bulkier side chains.
Finally, we observed no change in the rate or number of deuteriums exchanged in peptide 113–133 as compared with control ataxin-3(Q64) (Fig. 7D). The peptic fragments that showed no change in polyQ-dependent mobility for wild-type ataxin-3(Q64) (Fig. 4) largely showed no differences in the I77A, S81A, or L93A mutants (Fig. 8). However, some of the mutants demonstrated some decreased mobility in residues 143–163 (Fig. 8, F–G). These data highlight the importance of the hydrophobic packing between the catalytic helix-α1 and helix-α4 in controlling local mobility and the overall aggregation rate of ataxin-3.
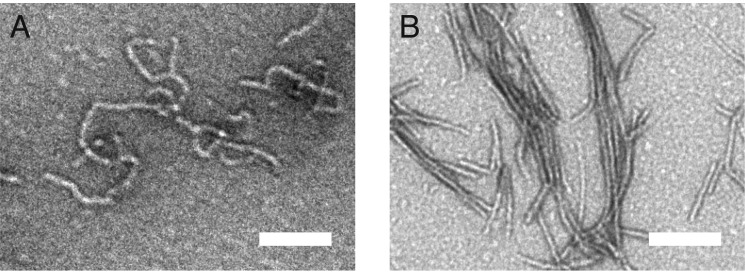
Together, these observations suggest that residues 76–81 of the Josephin domain undergo the initial conformational change that seeds the growth of ataxin-3 fibrils. To confirm the critical role of helix-α4 in nucleating fibril formation, we carried out limited proteolysis of Josephin domain fibrils. After extensive proteinase K digestion, Josephin domain fibrils maintain an amyloid-like morphology (Fig. 9). Critically, mass spectrometry of the digested Josephin domain fibrils identified residues 76–89 (helix-α4) as the core of the first-stage fibril.
FIGURE 9.
Helix-α4 forms the core of the first-stage fibril. A and B, TEM micrograph of the Josephin domain fibrils before (A) and after (B) digestion with proteinase K. Scale bar equals 100 nm. Mass spectrometry of the digested Josephin domain fibrils identified residues 76–89 (helix-α4) as the core of the first-stage fibril.
Discussion
Our data support a model in which polyQ expansion of ataxin-3 allosterically triggers aggregation by increasing the structural flexibility of a highly localized region of the catalytic Josephin domain (Fig. 10). Within the Josephin domain, helix-α1 makes numerous hydrophobic contacts with helix-α4, which together form part of the hydrophobic core situated above the central β-sheet (Fig. 10A). We observe a polyQ length-dependent increase in the HDX-MS rates of helix-α1 and helix-α4, consistent with transient local unfolding and exposure of backbone amides to the solvent. This increased molecular mobility is highly localized, with the remainder of the Josephin domain displaying little polyQ-dependent change in the rate of deuterium incorporation. These data are consistent with polyQ-dependent perturbations in α1 and α4 helical structure, which likely transiently disrupt the hydrophobic packing between the juxtaposed helix-α1 and helix-α4 and the Josephin domain core.
FIGURE 10.
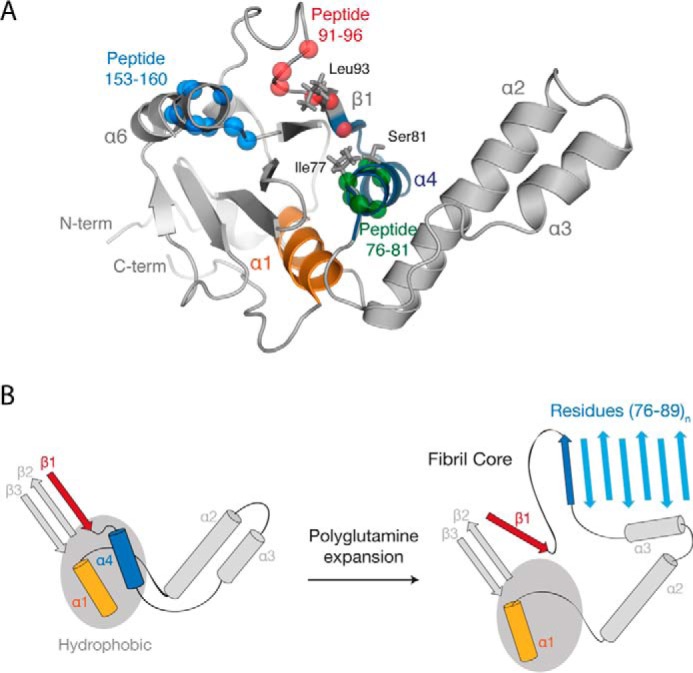
Model of the ataxin-3 aggregation mechanism. A, location of the identified amyloidogenic peptides (from Fig. 2), regions that displayed a polyQ-dependent increase in dynamics (from Fig. 3), and alanine-scanning mutations (from Fig. 5) within the Josephin domain (PDB code 1YZB (22)). B, schematic representation of the role of polyQ tract expansion in triggering ataxin-3 misfolding and aggregation.
The sequence of helix-α4 is highly aggregate-prone and situated at the solvent-exposed edge of the protein. Importantly, limited proteolysis established that residues 76–89 of helix-α4 form the core of the growing fibril. Together, these data suggest that structural conversion of helix-α4 to β-sheet initiates ataxin-3 aggregation (Fig. 10B). With longer polyQ tracts, the local unfolding of helix-α4 would become more prominent, increasing the likelihood of errant intermolecular interactions between ataxin-3 monomers. The topology of the Josephin domain likely further contributes to the aggregation mechanism. Loss of helix-α4 from the Josephin domain core would leave few gate-keeping interactions to inhibit the partial unraveling of the highly mobile helices α2-α3 from the body of the domain. Critically, the mobility of helix-α4 increases with polyQ tract length, mirroring both the increase in ataxin-3 aggregation rate and the earlier age of disease onset.
This connection between localized structural perturbations in the Josephin domain and ataxin-3 aggregation rate was confirmed by extensive mutagenesis studies. As compared with ataxin-3(Q15), pathologically expanded ataxin-3(Q64) has a much faster aggregation rate (26, 33), which is linked to a highly localized increase in Josephin domain mobility (Fig. 10). Mutation of Ile77, Ser81, or Leu93 within ataxin-3(Q64) decreased aggregation and Josephin domain mobility to that of ataxin-3(Q15). Thus, alanine-scanning mutagenesis reversed the effect of polyQ tract expansion and effectively converted the pathological-length ataxin-3(Q64) into non-pathogenic ataxin-3(Q15). Interestingly, a study published during manuscript preparation also linked the dynamics of a larger area of the Josephin domain (encompassing residues 76–89 identified here) to ataxin-3 aggregation using ion-mobility spectrometry-mass spectrometry (38).
Helix-α1 and helix-α4 are localized within Josephin domain regions that provide critical molecular interactions during both ubiquitin binding and deubiquitination (22, 39, 40). Previous studies have highlighted a role for ubiquitin interfacing residues (including those in helix-α1 and helix-α4) in Josephin domain aggregation (29). Furthermore, mutations in ubiquitin interfacing residues, or co-incubation with ubiquitin, slow the rate of Josephin domain aggregation (29). This has led to the intriguing hypothesis that protein function and aggregation are two competing pathways, whereby protein-protein binding can alleviate the risk of aggregation (29, 41, 42). Data reported here support this hypothesis and reveal that local molecular dynamics of helix-α1 and helix-α4 underlies this delicate balancing act. An essential role for conformational dynamics in substrate recognition by enzyme active sites during catalysis is well established (43). Here, it is compelling to surmise that the increased mobility within the Josephin domain (to allow substrate recognition and catalysis) also engenders high sensitivity to the allosteric effects of polyQ expansion. Future studies are required to determine whether other such highly dynamic regions within polyQ proteins (i.e. enzyme active sites, protein binding interfaces, etc.) are also sensitive to polyQ expansion.
How does upstream expansion of the polyQ tract increase the molecular mobility of the N-terminal Josephin domain? Studies have failed to find evidence of stable interactions between the ataxin-3 N and C termini (25, 44). Nevertheless, it is feasible that in solution, an elongated C-terminal polyQ tract could exert a degree of “mechanical pull” on the N-terminal Josephin domain, thereby increasing local conformational fluctuations and triggering aggregation. Indeed, we observed putative conformational differences in helix-α7 upon polyQ expansion (Fig. 3M), which may reflect a “mechanical pulling” of this helix away from the surface of the Josephin domain. Attempts to directly inhibit the aggregation of polyQ proteins have focused on the polyQ tract using short peptides or bivalent antibodies (45). This is inherently difficult due to a lack of structure within the polyQ tract prior to misfolding, and the necessity to cross the blood-brain barrier. The data presented here strongly suggest that targeting the hydrophobic cleft formed by helix-α4 with small molecules may represent a viable and alternative therapeutic approach.
In summary, we find that polyQ expansion provides an allosteric trigger, which increases the molecular mobility of key amyloidogenic residues within the catalytic Josephin domain to drive ataxin-3 aggregation. This provides the basis for the novel near-native polyQ misfolding pathway propelled by localized changes in molecular mobility, rather than global changes in stability. Critically, mutagenesis reversed the effect of polyQ expansion and effectively converted pathological-length ataxin-3(Q64) into non-pathogenic ataxin-3(Q15). These key amyloidogenic residues are intimately involved in enzyme catalysis and substrate recognition, illustrating the delicate balance between function and aggregation. Finally, data presented here suggest that small molecules aimed at limiting the conformational fluctuations of key amyloidogenic regions of ataxin-3 may effectively inhibit aggregation and the onset of spinocerebellar ataxia type-3.
Author Contributions
C. J. L., V. A. H, and A. M. E. performed the research; C. J. L., D. L. S., P. L. W., S. P. B., V. A. H., and A. M. E. designed research and contributed to data analysis and interpretation; and C. J. L. and A. M. E. wrote the manuscript, which was drafted by all authors.
Acknowledgments
We thank Michelle L. Halls and James C. Whisstock for critical advice.
This work was supported by grants from the National Health and Medical Research Council, Australia. The authors declare that they have no conflicts of interest with the contents of this article.
- polyQ
- polyglutamine
- HDX-MS
- hydrogen deuterium exchange coupled with mass spectrometry
- ThT
- thioflavin-T
- TEM
- transmission electron microscopy.
References
- 1. Cummings C. J., Zoghbi H. Y. (2000) Trinucleotide repeats: mechanisms and pathophysiology. Annu. Rev. Genomics Hum. Genet. 1, 281–328 [DOI] [PubMed] [Google Scholar]
- 2. Robertson A. L., Bottomley S. P. (2010) Towards the treatment of polyglutamine diseases: the modulatory role of protein context. Curr. Med. Chem. 17, 3058–3068 [DOI] [PubMed] [Google Scholar]
- 3. Scherzinger E., Lurz R., Turmaine M., Mangiarini L., Hollenbach B., Hasenbank R., Bates G. P., Davies S. W., Lehrach H., Wanker E. E. (1997) Huntingtin-encoded polyglutamine expansions form amyloid-like protein aggregates in vitro and in vivo. Cell 90, 549–558 [DOI] [PubMed] [Google Scholar]
- 4. Ross C. A., Poirier M. A. (2005) Opinion: What is the role of protein aggregation in neurodegeneration? Nat. Rev. Mol. Cell Biol. 6, 891–898 [DOI] [PubMed] [Google Scholar]
- 5. Todd T. W., Lim J. (2013) Aggregation formation in the polyglutamine diseases: protection at a cost? Mol. Cells 36, 185–194 [DOI] [PMC free article] [PubMed] [Google Scholar]
- 6. Orr H. T., Zoghbi H. Y. (2007) Trinucleotide repeat disorders. Annu. Rev. Neurosci. 30, 575–621 [DOI] [PubMed] [Google Scholar]
- 7. Arrasate M., Mitra S., Schweitzer E. S., Segal M. R., Finkbeiner S. (2004) Inclusion body formation reduces levels of mutant huntingtin and the risk of neuronal death. Nature 431, 805–810 [DOI] [PubMed] [Google Scholar]
- 8. He X.-H., Lin F., Qin Z.-H. (2010) Current understanding on the pathogenesis of polyglutamine diseases. Neurosci Bull. 26, 247–256 [DOI] [PMC free article] [PubMed] [Google Scholar]
- 9. Wetzel R. (2012) Physical chemistry of polyglutamine: intriguing tales of a monotonous sequence. J. Mol. Biol. 421, 466–490 [DOI] [PMC free article] [PubMed] [Google Scholar]
- 10. Chen S., Berthelier V., Hamilton J. B., O'Nuallain B., Wetzel R. (2002) Amyloid-like features of polyglutamine aggregates and their assembly kinetics. Biochemistry 41, 7391–7399 [DOI] [PubMed] [Google Scholar]
- 11. Chen S., Ferrone F. A., Wetzel R. (2002) Huntington's disease age-of-onset linked to polyglutamine aggregation nucleation. Proc. Natl. Acad. Sci. U.S.A. 99, 11884–11889 [DOI] [PMC free article] [PubMed] [Google Scholar]
- 12. Duennwald M. L., Jagadish S., Muchowski P. J., Lindquist S. (2006) Flanking sequences profoundly alter polyglutamine toxicity in yeast. Proc. Natl. Acad. Sci. U.S.A. 103, 11045–11050 [DOI] [PMC free article] [PubMed] [Google Scholar]
- 13. Darnell G., Orgel J. P. R. O., Pahl R., Meredith S. C. (2007) Flanking polyproline sequences inhibit β-sheet structure in polyglutamine segments by inducing PPII-like helix structure. J. Mol. Biol. 374, 688–704 [DOI] [PubMed] [Google Scholar]
- 14. Rockabrand E., Slepko N., Pantalone A., Nukala V. N., Kazantsev A., Marsh J. L., Sullivan P. G., Steffan J. S., Sensi S. L., Thompson L. M. (2007) The first 17 amino acids of Huntingtin modulate its sub-cellular localization, aggregation and effects on calcium homeostasis. Hum. Mol. Genet. 16, 61–77 [DOI] [PubMed] [Google Scholar]
- 15. Thakur A. K., Jayaraman M., Mishra R., Thakur M., Chellgren V. M., Byeon I.-J. L., Anjum D. H., Kodali R., Creamer T. P., Conway J. F., Gronenborn A. M., Wetzel R. (2009) Polyglutamine disruption of the huntingtin exon 1 N terminus triggers a complex aggregation mechanism. Nat. Struct. Mol. Biol. 16, 380–389 [DOI] [PMC free article] [PubMed] [Google Scholar]
- 16. Gu X., Greiner E. R., Mishra R., Kodali R., Osmand A., Finkbeiner S., Steffan J. S., Thompson L. M., Wetzel R., Yang X. W. (2009) Serines 13 and 16 are critical determinants of full-length human mutant huntingtin induced disease pathogenesis in HD mice. Neuron 64, 828–840 [DOI] [PMC free article] [PubMed] [Google Scholar]
- 17. Kar K., Jayaraman M., Sahoo B., Kodali R., Wetzel R. (2011) Critical nucleus size for disease-related polyglutamine aggregation is repeat-length dependent. Nat. Struct. Mol. Biol. 18, 328–336 [DOI] [PMC free article] [PubMed] [Google Scholar]
- 18. Ignatova Z., Thakur A. K., Wetzel R., Gierasch L. M. (2007) In-cell aggregation of a polyglutamine-containing chimera is a multistep process initiated by the flanking sequence. J. Biol. Chem. 282, 36736–36743 [DOI] [PMC free article] [PubMed] [Google Scholar]
- 19. Kawaguchi Y., Okamoto T., Taniwaki M., Aizawa M., Inoue M., Katayama S., Kawakami H., Nakamura S., Nishimura M., Akiguchi I. (1994) CAG expansions in a novel gene for Machado-Joseph disease at chromosome 14q32.1. Nat. Genet. 8, 221–228 [DOI] [PubMed] [Google Scholar]
- 20. Matos C. A., de Macedo-Ribeiro S., Carvalho A. L. (2011) Polyglutamine diseases: the special case of ataxin-3 and Machado-Joseph disease. Prog. Neurobiol. 95, 26–48 [DOI] [PubMed] [Google Scholar]
- 21. Masino L., Musi V., Menon R. P., Fusi P., Kelly G., Frenkiel T. A., Trottier Y., Pastore A. (2003) Domain architecture of the polyglutamine protein ataxin-3: a globular domain followed by a flexible tail. FEBS Lett. 549, 21–25 [DOI] [PubMed] [Google Scholar]
- 22. Nicastro G., Menon R. P., Masino L., Knowles P. P., McDonald N. Q., Pastore A. (2005) The solution structure of the Josephin domain of ataxin-3: structural determinants for molecular recognition. Proc. Natl. Acad. Sci. U.S.A. 102, 10493–10498 [DOI] [PMC free article] [PubMed] [Google Scholar]
- 23. Burnett B., Li F., Pittman R. N. (2003) The polyglutamine neurodegenerative protein ataxin-3 binds polyubiquitylated proteins and has ubiquitin protease activity. Hum. Mol. Genet. 12, 3195–3205 [DOI] [PubMed] [Google Scholar]
- 24. Winborn B. J., Travis S. M., Todi S. V., Scaglione K. M., Xu P., Williams A. J., Cohen R. E., Peng J., Paulson H. L. (2008) The deubiquitinating enzyme ataxin-3, a polyglutamine disease protein, edits Lys63 linkages in mixed linkage ubiquitin chains. J. Biol. Chem. 283, 26436–26443 [DOI] [PMC free article] [PubMed] [Google Scholar]
- 25. Masino L., Nicastro G., Menon R. P., Dal Piaz F., Calder L., Pastore A. (2004) Characterization of the structure and the amyloidogenic properties of the Josephin domain of the polyglutamine-containing protein ataxin-3. J. Mol. Biol. 344, 1021–1035 [DOI] [PubMed] [Google Scholar]
- 26. Ellisdon A. M., Thomas B., Bottomley S. P. (2006) The two-stage pathway of ataxin-3 fibrillogenesis involves a polyglutamine-independent step. J. Biol. Chem. 281, 16888–16896 [DOI] [PubMed] [Google Scholar]
- 27. Ellisdon A. M., Pearce M. C., Bottomley S. P. (2007) Mechanisms of ataxin-3 misfolding and fibril formation: kinetic analysis of a disease-associated polyglutamine protein. J. Mol. Biol. 368, 595–605 [DOI] [PubMed] [Google Scholar]
- 28. Cushman-Nick M., Bonini N. M., Shorter J. (2013) Hsp104 suppresses polyglutamine-induced degeneration post onset in a Drosophila MJD/SCA3 model. PLoS Genet. 9, e1003781. [DOI] [PMC free article] [PubMed] [Google Scholar]
- 29. Masino L., Nicastro G., Calder L., Vendruscolo M., Pastore A. (2011) Functional interactions as a survival strategy against abnormal aggregation. FASEB J. 25, 45–54 [DOI] [PMC free article] [PubMed] [Google Scholar]
- 30. Hübener J., Vauti F., Funke C., Wolburg H., Ye Y., Schmidt T., Wolburg-Buchholz K., Schmitt I., Gardyan A., Driessen S., Arnold H.-H., Nguyen H. P., Riess O. (2011) N-terminal ataxin-3 causes neurological symptoms with inclusions, endoplasmic reticulum stress and ribosomal dislocation. Brain 134, 1925–1942 [DOI] [PubMed] [Google Scholar]
- 31. Masino L., Nicastro G., De Simone A., Calder L., Molloy J., Pastore A. (2011) The Josephin domain determines the morphological and mechanical properties of ataxin-3 fibrils. Biophys. J. 100, 2033–2042 [DOI] [PMC free article] [PubMed] [Google Scholar]
- 32. Chiti F., Dobson C. M. (2009) Amyloid formation by globular proteins under native conditions. Nat. Chem. Biol. 5, 15–22 [DOI] [PubMed] [Google Scholar]
- 33. Chow M. K. M., Ellisdon A. M., Cabrita L. D., Bottomley S. P. (2004) Polyglutamine expansion in ataxin-3 does not affect protein stability: implications for misfolding and disease. J. Biol. Chem. 279, 47643–47651 [DOI] [PubMed] [Google Scholar]
- 34. Tsutsui Y., Liu L., Gershenson A., Wintrode P. L. (2006) The conformational dynamics of a metastable serpin studied by hydrogen exchange and mass spectrometry. Biochemistry 45, 6561–6569 [DOI] [PubMed] [Google Scholar]
- 35. Smith D. L., Deng Y., Zhang Z. (1997) Probing the non-covalent structure of proteins by amide hydrogen exchange and mass spectrometry. J. Mass Spectrom. 32, 135–146 [DOI] [PubMed] [Google Scholar]
- 36. Fernandez-Escamilla A.-M., Rousseau F., Schymkowitz J., Serrano L. (2004) Prediction of sequence-dependent and mutational effects on the aggregation of peptides and proteins. Nat. Biotechnol. 22, 1302–1306 [DOI] [PubMed] [Google Scholar]
- 37. Walsh I., Seno F., Tosatto S. C. E., Trovato A. (2014) PASTA 2.0: an improved server for protein aggregation prediction. Nucleic Acids Res. 42, W301–W307 [DOI] [PMC free article] [PubMed] [Google Scholar]
- 38. Scarff C. A., Almeida B., Fraga J., Macedo-Ribeiro S., Radford S. E., Ashcroft A. E. (2015) Examination of ataxin-3 aggregation by structural mass spectrometry techniques: a rationale for expedited aggregation upon polyglutamine expansion. Mol. Cell. Proteomics 14, 1241–1253 [DOI] [PMC free article] [PubMed] [Google Scholar]
- 39. Weeks S. D., Grasty K. C., Hernandez-Cuebas L., Loll P. J. (2011) Crystal structure of a Josephin-ubiquitin complex: evolutionary restraints on ataxin-3 deubiquitinating activity. J. Biol. Chem. 286, 4555–4565 [DOI] [PMC free article] [PubMed] [Google Scholar]
- 40. Nicastro G., Masino L., Esposito V., Menon R. P., De Simone A., Fraternali F., Pastore A. (2009) Josephin domain of ataxin-3 contains two distinct ubiquitin-binding sites. Biopolymers 91, 1203–1214 [DOI] [PubMed] [Google Scholar]
- 41. Pastore A., Temussi P. A. (2012) The two faces of Janus: functional interactions and protein aggregation. Curr. Opin. Struct. Biol. 22, 30–37 [DOI] [PubMed] [Google Scholar]
- 42. Gershenson A., Gierasch L. M., Pastore A., Radford S. E. (2014) Energy landscapes of functional proteins are inherently risky. Nat. Chem. Biol. 10, 884–891 [DOI] [PMC free article] [PubMed] [Google Scholar]
- 43. Boehr D. D., Nussinov R., Wright P. E. (2009) The role of dynamic conformational ensembles in biomolecular recognition. Nat. Chem. Biol. 5, 789–796 [DOI] [PMC free article] [PubMed] [Google Scholar]
- 44. Scarff C. A., Sicorello A., Tomé R. J. L., Macedo-Ribeiro S., Ashcroft A. E., Radford S. E. (2013) A tale of a tail: structural insights into the conformational properties of the polyglutamine protein ataxin-3. Int. J. Mass Spectrom. 345–347, 63–70 [DOI] [PMC free article] [PubMed] [Google Scholar]
- 45. Shao J., Diamond M. I. (2007) Polyglutamine diseases: emerging concepts in pathogenesis and therapy. Hum. Mol. Genet. 16, Spec No. 2, R115–R123 [DOI] [PubMed] [Google Scholar]


