

Abstract
Noise-induced hearing loss (NIHL) is a major public health issue worldwide. Uncovering the early molecular events associated with NIHL would reveal mechanisms leading to the hearing loss. Our aim is to investigate the immediate molecular responses after different levels of noise exposure and identify the common and distinct pathways that mediate NIHL. Previous work showed mice exposed to 116 decibels sound pressure level (dB SPL) broadband noise for 1 h had greater threshold shifts than the mice exposed to 110 dB SPL broadband noise, hence we used these two noise levels in this study. Groups of 4–8-week-old CBA/CaJ mice were exposed to no noise (control) or to broadband noise for 1 h, followed by transcriptome analysis of total cochlear RNA isolated immediately after noise exposure. Previously identified and novel genes were found in all data sets. Following exposure to noise at 116 dB SPL, the earliest responses included up-regulation of 243 genes and down-regulation of 61 genes, while a similar exposure at 110 dB SPL up-regulated 155 genes and down-regulated 221 genes. Bioinformatics analysis indicated that mitogen-activated protein kinase (MAPK) signaling was the major pathway in both levels of noise exposure. Nevertheless, both qualitative and quantitative differences were noticed in some MAPK signaling genes, after exposure to different noise levels. Cacna1b, Cacna1g, and Pla2g6, related to calcium signaling were down-regulated after 110 dB SPL exposure, while the fold increase in the expression of Fos was relatively lower than what was observed after 116 dB SPL exposure. These subtle variations provide insight on the factors that may contribute to the differences in NIHL despite the activation of a common pathway.
Keywords: Acoustic trauma, mitogen-activated protein kinase signaling, noise induced gene expression, noise induced hearing loss, permanent threshold shift
Introduction
The National Institute for Occupational Safety and Health estimates that 22 million American workers are exposed to hazardous noise, with a third of those workers demonstrating measurable noise induced hearing loss (NIHL).[1] Two types of hearing loss have been described following noise exposure. Permanent threshold shift (PTS) is an irreversible increase in hearing threshold due to loss of or changes in cochlear sensory cells and corresponding nerve fiber degeneration. In contrast, temporary threshold shift (TTS) is a relatively short-term transient loss of hearing that can resolve to a prenoise exposure level in minutes, hours, or days. However, in both TTS and PTS, the pattern of hearing loss varies depending on the differences in the noise paradigm to which they were exposed. Elucidation of the early molecular signatures that correspond to different levels of noise is a critical step in the prevention of NIHL.
Meltser et al. compared changes in certain cochlear proteins following noise exposures to TTS levels (100 dB SPL for 45 min) and PTS levels (110 dB SPL for 2 h) in CBA/CaSca mice sampled at 30 min, 2 h, and 24 h postexposure.[2] They found differences in three mitogen-activated protein kinases (MAPK) (ERK1/2, p38, and JNK1/2) between the acute phase of TTS and PTS: 24 h after exposure, the MAPK levels in TTS mice had not yet stabilized while it stabilized in PTS mice. In both exposures, brain-derived neurotrophic factor (BDNF) was elevated, but the elevation persisted only after PTS. BDNF’s receptor TrkB was down-regulated only after PTS. Although these data suggest that TTS and PTS are linked to two distinct processes, the differences in the molecular responses were detected at a much later time point after noise exposure. Since early intervention is crucial to the prevention of NIHL, it would be important to evaluate the molecular responses immediately after noise exposure, especially at intensities that are capable of inducing different levels of PTS.
Protective factors against NIHL implicate three contributors to noise-induced loss and hearing damage: Reactive oxygen species (ROS), intracellular stress apoptotic pathways, and excitotoxicity due to glutamate neurotransmission.[3] For ROS, Henderson et al. has hypothesized that the mechanism of PTS is dependent upon necrotic and signaled cell death generated by free-radical damage.[4] In animal models, cochlear treatment with both exogenous and endogenous forms of anti-oxidants such as R-N6-phenylisopropyladenoisine,[5] glutathione,[6] N-L-acetylcysteine, creatine,[7] tempol,[8] and vitamin C[9] have been reported to be protective against PTS in preexposure and postexposure regimens. Similarly, blockade of intracellular stress pathways such as c-Jun N-terminal kinase and induction of heat shock protein Hsp70 have been shown to be protective against noise-induced cell death.[10,11] Another hypothesis is that the excessive noise leads to glutamate excitotoxicity: Caroverine (a glutamate receptor antagonist) and riluzole (a glutamate release blocker) have also been efficacious in preventing cell death and subsequent hearing loss.[11,12] Despite these advances, however, therapies aimed at molecular targets linked directly to different patterns of NIHL remain to be developed.
While microarray analysis can provide clues into the regulatory pathways controlling NIHL, a relative paucity of studies has evaluated global gene expression in the period immediately following noise exposures.[13,14] Understanding the early molecular events that led to a shift in hearing threshold may provide insights toward the development of targeted therapeutic interventions against NIHL. Therefore, the purpose of this study was to look at gene expression immediately after noise exposure that induces different levels of hearing loss.
Methods
Figure 1 provides a schematic diagram of the experimental procedure used in this report.
Figure 1.
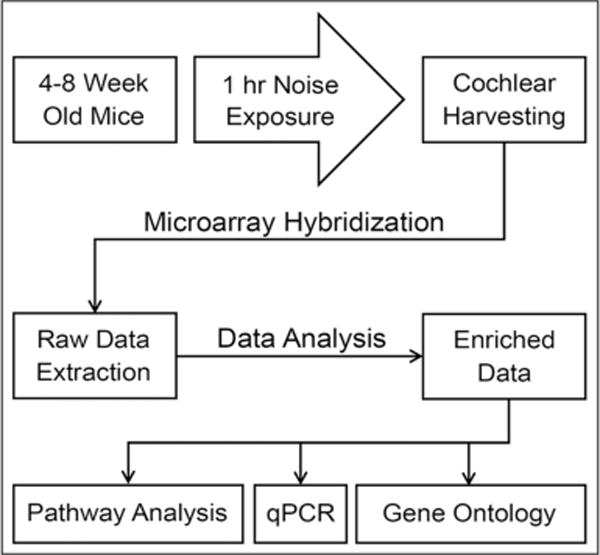
Flow diagram for methods used in this study. Total cochlear RNA recovered from three separate groups (116 dB SPL and 110 dB SPL noise exposure, and Control) were used for microarray hybridization and subsequent qPCR analysis. Differentially expressed genes, identified via analysis of variance and Benjamini-Hochberg analyses, were later used for GO studies and pathway analysis
Subjects
The study used 72 4–8-week-old female CBA/CaJ inbred mice (Jackson Laboratories, Bar Harbor, ME, USA). Animal procedures were approved by the University of Cincinnati Institutional Animal Care and Use Committee. The animals were housed, and all procedural activities were conducted in an Association for Assessment and Accreditation of Laboratory Animal Care accredited facility at the University of Cincinnati adhering to Laboratory Animal Medical Services policies and guidelines.
Auditory brainstem response evaluation
One week prior to noise exposure, the mice were tested for their ability to generate a normal auditory brainstem response (ABR) at 4, 8, 16, and 32 kHz. ABR data were recorded using Tucker-Davis Technologies System II hardware (Alachua, FL, USA) with BioSig® controlling software. In order to show that our exposure procedure can cause PTSs, a separate (test) batch of mice was exposed to identical conditions, and ABR recorded for the test batch of mice. The permanent effect of noise exposure on hearing is usually measured several days after noise exposure. In the test batch reported here, we recorded ABR 11 days after noise exposure. The ABR evaluation protocol described previously was used here without any change.[15]
Exposures
The mice were randomly divided into three groups exposed to no noise (control), exposed to 110 dB SPL, or exposed 116 dB SPL broadband noise for 1 h. The acoustic system consisted of a General Radio (Concord, MA, USA) Type 1310 random noise generator whose output signal was controlled by a Mackie (Loud Technologies Inc., Woodinville, WA, USA) mixer amplifier. The output was amplified by a Soundcraftsman® 4×300 Power Amplifier (Santa Ana, CA, USA), a single channel of which drove four Realistic super-tweeters (Radio Shack Corp, Ft. Worth, TX, USA, #40-1310B) built into the removable noise chamber cover. A graph of the one-third octave analysis of the broadband noise has been presented elsewhere.[16] It is virtually flat between 8 and 20 kHz. Calibration and monitoring of the noise level inside the chamber was performed by a Sennhauser MKE 2–3 electret microphone whose input was displayed and analyzed on a Brüel & Kjær 2608 Measuring Amplifier. Microphone calibrations were confirmed preexposure and postexposure by a G.R.A.S. 42AB Sound Level Calibrator (Holte, Denmark).
Tissue collection
Immediately following noise exposure, the mice were anesthetized with an overdose of tribromoethanol (Avertin). Temporal bones were immediately dissected from the skull. The cochlea was isolated and cleaned of bone and soft tissue under a dissecting microscope. RNALater® (Ambion Inc., Austin, TX, USA) was continuously applied over the inner ear. The cochleae were stored in 1.8 mL capped centrifuge tubes filled with RNALater® at ambient temperature, placed in an insulating container and shipped overnight to the Alagramam Laboratory.
Total RNA extraction
To conduct the experiment in triplicate, a total of 72 mice in three batches were used. Each batch consisted of 24 mice: 8 mice for 116 dB exposure, 8 mice for 110 dB exposure, and 8 mice for 0 dB (control). The mice exposed to noise for 1 h were sacrificed immediately, and the cochlear tissue was harvested. Cochleae from each exposure sub-group (116, 100 or 0 dB exposure) were pooled together in a ratio of 0.75 mL of Trizol (Invitrogen, Carlsbad CA, USA)/50 mg of sample. A pellet pestle (Kimble-Chase, Vineland, NJ, USA) was used to homogenize the samples. The resulting homogenate was incubated at room temperature for 5 min. Chloroform was then added to the mix at a ratio of 0.2 mL/0.75 mL of Trizol to induce phase separation. Samples were mixed by manually inverting the tube for 15 s, and incubated for 15 min at room temperature. The samples were centrifuged at 12,000g for 15 min at 4°C and the aqueous phase containing the total RNA was removed. RNA was precipitated from the aqueous phase through the addition of 0.5 mL isopropyl alcohol per 0.75 mL of Trizol. Samples were incubated at room temperature for 10 min and centrifuged at 12,000g for 10 min at 4°C. The RNA pellet was washed in 75% ethanol by vortexing and centrifuged at 7500 g for 5 min at 4°C. After a brief air-dry, the RNA was resolubilized in RNAase free water. Total RNA samples were further purified using an RNeasy Mini Kit (Qiagen Co., Chatsworth, CA, USA). Final samples from each exposure sub-group yielded between 0.75 and 1.75 μg/μl of total RNA. An aliquot of the samples was retained for further quantitative real-time polymerase chain reaction analysis, and the rest was forwarded to the Affymetrix Resource Facility at Yale University (http://ycga.yale.edu/index.aspx) for microarray hybridization.
Microarray data generation
Total RNA received by the Affymetrix Resource Facility was analyzed for quantity and purity. Absorbance ratios, measured by Nanodrop (Wilmington, DE, USA), were used to assess the amount and quality of the samples (2.1 ≥ A260/280 ≥ 1.8 and A260/230 ≥ 1.8). Further quality control was conducted with an Agilent 2100 Bioanalyzer (Foster City, CA, USA), which was used to score the RNA samples via an RNA Integrity Number (RIN). Measurements from the Nanodrop and Bioanalyzer (RIN >8) ensured the quality of RNA used for microarray hybridization. As described by the manufacturer, the Affymetrix Mouse Genome 430 2.0 Array (Santa Clara, CA, USA) contains an excess of 45,000 probe sets, with >34,000 characterized genes represented. In the present study, nine 430 arrays were used with each of the three exposure groups (control, 110 dB SPL, 116 dB SPL) performed in triplicate. Each array represents the pooled contribution of eight mice. Hybridization, washing, staining, and scanning of the 430 2.0 GeneChip were performed in accordance with the protocol outlined in the Affymetrix GeneChip Expression Analysis Technical Manual ver. 5 (Santa Clara, CA, USA). Briefly, 5 μg total RNA from each exposure experiment was reversed transcribed with Oligo (dT) primers generating first strand cDNA. First strand cDNA was used to generate double-stranded cDNA, which in turn was used as a template for the production of biotin labeled complementary RNA (cRNA) in an in vitro transcription reaction. About 20 μg of biotin-labeled cRNA was fragmented and later added to a hybridization cocktail used in a 16 h incubation. Washing, staining, and scanning steps were coordinated via the GeneChip Operating Software (GCOS) program (Santa Clara, CA, USA). Wash and stain steps were performed with an Affymetrix Fluidics Station 450. Scanning was performed using the Affymetrix GeneChip 3000 7G Scanner. The converted digital intensity signals were captured as a raw image file (.dat) and further refined by GCOS (.cel files).
Microarray data analysis
Files generated by GCOS (.cel files) were imported into Partek Genomics Suite (St. Louis, MO, USA) where the GC-RMA algorithm was applied for background noise correction, normalization, and summarization of the data set into individual expression measures.[17] Analysis of variance (ANOVA) was applied to this data set, within the Partek Genomics Suite, to identify differentially expressed probes across different exposure conditions.[18] This analysis returned a fold-change (FC) for each probe across different treatments (110 vs. control and 116 vs. control) and a P value for each comparison. For the purposes of this study, a minimum 1.2-FC (up- or down-regulated) was required for a probe to be considered a candidate for differential expression. A Benjamini-Hochberg false discovery rate (FDR) analysis was applied to the candidates so as to rule-in differentially expressed genes while controlling for the number of false positives present within the data set.[19] A 15% FDR for 110 versus control and 116 versus control was chosen. Though selection of a suitable FDR cutoff is somewhat arbitrary, an FDR of 15% was selected on the basis of ruling “in” as many previously identified noise induced genes (from comparable microarray expression studies) as possible while keeping the FDR percentage relatively low.[13,14,20,21]
Pathway analysis
Differentially expressed genes, as determined by the Benjamini-Hochberg analysis, were entered into a gene-ontology/pathway analysis tool: DAVID [Database for Annotation, Visualization and Integrated Discovery].[22] As of this writing, DAVID (http://david.abcc.ncifcrf.gov/) is freely available online. The enriched list from the previous microarray data analysis was entered into the program, which queried the entered list, looking for the annotations (e.g., gene ontology [GO] terms, pathways) that were enriched in comparison to what would be expected relatively to the background. The background was set to the entire genome-wide genes relevant to Mus musculus. DAVID’s functional annotation chart module uses a modified Fisher’s exact test (EASE score) to calculate gene-enrichment for a particular annotation.[23] An EASE score is modified in the sense that it removes one gene from a category of interest and calculates Fisher’s exact test with the remaining queried genes. By removing one gene, annotations with few gene members are greatly penalized, while slightly handicapping more robust annotations. This conservative approach allows ruling-out of less significant annotations due to false positive members. A smaller EASE score indicates greater enrichment, with a cutoff of ≤0.05 indicating significant enrichment.
Quantitative real-time polymerase chain reaction
Following manufacturer instructions, cDNA was generated by using the Superscript First-Strand Synthesis System for quantitative real-time polymerase chain reaction or qPCR (Invitrogen, Carlsbad, CA, USA) on the total RNA recovered from each of the previous exposures. About 500 ng of RNA pooled from each exposure group were used in separate reverse transcription reactions. Oligo-(dT)12–18 and random hexamer primers were used simultaneously in each reaction mix. The resultant 20 μl reaction mixtures were diluted 10-fold using RNAase free water and were later used for qPCR. Primer3 (http://frodo.wi.mit.edu/primer3/input.htm) was used in the design of each primer pair [Table 1]. When possible, primers were designed to span at least 1 intron, thereby allowing discrimination between cDNA amplified bands and possible genomic contamination. A final primer concentration of 200 nM of each forward and reverse primer was used per qPCR reaction. Sybr Green I (Sigma, St. Louis, MO, USA), a double-stranded-DNA binding dye, was used to dilute to a final concentration of ×0.4. qPCR reactions were monitored using the DNA Engine Opticon 2 qPCR detection system (Bio-Rad Laboratories, Inc., CA, USA). Opticon Monitor software (v 3.0, Bio-Rad Laboratories, Inc., CA, USA) gathered realtime data. The PCR cycle used for each reaction was as follows:
2 min-94.0°C,
20 s-94°C,
20 s-55°C,
15 s-72°C,
Plate read,
Jump to steps 2, 3, and 4 four more times,
Melting curve 55–99°C.
Table 1.
Primer sequences of genes selected for qPCR analysis
| Symbol | Gene title | PCR Primers | Sequences | Reference ID | Affymetrix ID |
|---|---|---|---|---|---|
| Actb | Actin, beta, cytoplasmic | Forward Reverse |
TTGCTGACAGGATGCAGAAG AGTCCGCCTAGAAGCACTTG |
NM_007393 | M12481_3_at |
| Cyr61 | Cysteine rich protein 61 | Forward Reverse |
TGGACAACCAGTGTACAGCA GATGCGGGCAGTTGTAGTTA |
BM202770 | 1438133_a_at |
| Egr1 | Early growth response 1 | Forward Reverse |
TCACCCACCATGGACAACTA AGCGGCCAGTATAGGTGATG |
NM_007913 | 1417065_at |
| Fos | FBJ osteosarcoma oncogene | Forward Reverse |
GAATGGTGAAGACCGTGTCA TGGGCTGCCAAAATAAACTC |
AV026617 | 1423100_at |
| Gem | GTP binding protein | Forward Reverse |
TAGTGCGGTGTCGAGAAGTG GACAGGTCATGGCAGGATTT |
U10551 | 1426063_a_at |
| H19 | H19 fetal liver mRNA | Forward Reverse |
AATGGTGCTACCCAGCTCAT GCAGAGTTGGCCATGAAGAT |
NM_023123 | 1448194_a_at |
| Igj | Immunoglobulin joining chain | Forward Reverse |
CCCTTTGAACAACAGGGAGA AGGTCTCAGGAACACCATCG |
BC006026 | 1424305_at |
| Mt1 | Metallothionein 1 | Forward Reverse |
CACCAGATCTCGGAATGGAC TGTCCCCAACAGAGAAGACC |
BC027262 | 1451612_at |
| Ntn1 | Netrin 1 | Forward Reverse |
TCCAAAGGCAAGCTGAAGAT GGCATTACCCAACAGCAAGT |
BI143915 | 1454974_at |
| Serpine1 | Serine (or cysteine) peptidase inhibitor, clade E, member 1 | Forward Reverse |
CCGATCCTTTCTCTTTGTGG GGATGCTGGTTGGAAAGATT |
NM_008871 | 1419149_at |
qPCR = Quantitative real-time polymerase chain reaction
All samples, including the housekeeping gene b-actin, were run in triplicate. Reactions with no cDNA template added, and reverse transcriptase-minus reactions with cDNA template provided the necessary negative controls. Specific products were verified by running products on 1.5% agarose gels with added ethidium bromide and melting curve analysis (data not shown). FC was calculated using the Pfaffl method.[24] The main distinction between using the common 2-DDCt method versus the Pfaffl method, is that efficiencies are assumed to be equal across primer pairs in the former method while their differences are accounted for in the latter. In other words, if the efficiencies between two separate PCRs were both 100%, the Pfaffl method would simplify to the 2-DDCt method. Efficiencies of each primer pair were calculated using the real-time PCR miner approach.[25]
Results
In this study, 4–8-week-old CBA/CaJ mice were exposed to two different noise conditions (116 dB SPL and 110 dB SPL) for 1 h, and to no noise (0 dB or control). Before proceeding with the main experiment (described below), we used a separate batch of CBA/CaJ mice to confirm that exposure to broadband noise at 110 and 116 dB SPL for 1 h results in ABR threshold shifts. The hearing loss induced by 116 dB SPL was 10–15 dB higher than that induced by 110 dB SPL noise exposure [Figure 2]. For the main experiment, immediately following noise exposure, the whole cochleae from each exposure group were harvested, and total RNA extracted for microarray hybridization and qPCR. Both microarray hybridization studies and qPCR analysis were performed in triplicate for each exposure. ANOVA analysis of the microarray data returned a relative FC and P value for each comparison (116 dB SPL vs. control, and 110 dB SPL vs. control). Enriched datasets were identified on the basis of FC and Benjamini-Hochberg analysis (FDR = 0.15–0.17).
Figure 2.
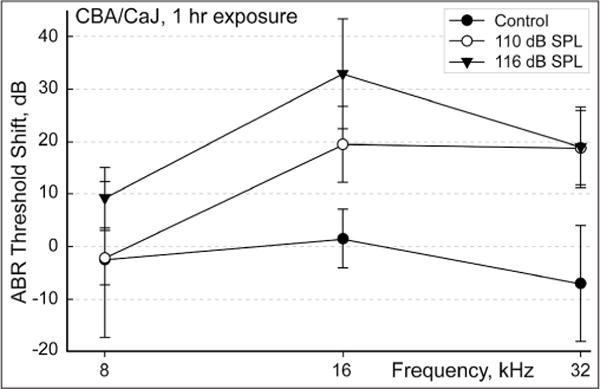
Noise-induced shift in hearing threshold. In a different experiment, separate groups of mice were noise-exposed using the same equipment and protocol. Auditory brain stem response was tested prior to noise exposure and 11 days postnoise exposure to assess the permanent noise-induced threshold shift. The graph illustrates the shifts in the threshold detected by auditory brainstem responses recorded at 8, 16, and 32 kHz in mice exposed to 110 dB SPL (n = 8) and 116 dB SPL (n = 6) noise (for one hour) in comparison to control (n = 7). Note that the 110 dB exposure produces a smaller threshold shift than the 116 dB exposure. The results are expressed as mean ± standard deviation
The differences in gene expression immediately following 1 h of 116 dB SPL noise exposure versus no noise exposure (116 vs. control) were compared. After applying Benjamini-Hochberg analysis (FDR = 0.15) and FC cutoff 1.2 to the microarray data, 243 genes were found to be up-regulated and 61 probes down-regulated. A volcano plot visualizes the probes that were ruled in for further study [Figure 3a]. Both previously studied genes and novel genes not previously reported were found in the data set [Tables 2a and 3a]. Pathway analysis indicated the enrichment of MAPK signaling and insulin signaling pathways in the cochlear response to 116 dB SPL noise exposure [Table 4a]. Nine MAPK signaling genes, which include Fos, Jun, Dusp1, Dusp14, Dusp5, Dusp6, Gadd45g, Nr4a1, and Srf, were up-regulated. Subsequent clustering analysis of GO terms relating to molecular function shows enrichment of the GO term “MAPK phosphatase activity” [Table 5a].
Figure 3.
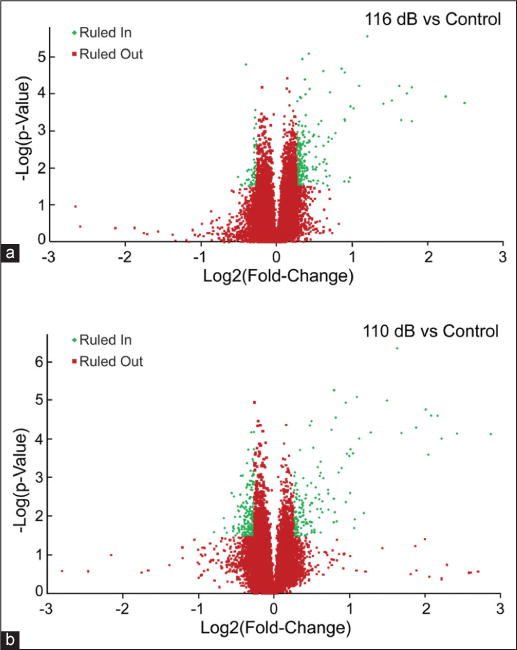
Volcano plots of microarray data. Analysis of variance was used to identify differentially expressed candidates in each of the comparisons evaluated in this study. This analysis returned a P value for the observed difference (i.e., fold-change [FC]) in expression for a given probe. In the following plots, Log2 (FC) on the X-axis was plotted against Log10(P value) on the Y-axis. The red dots indicate probes that were ruled out for further analysis, while the green dots indicate probes that were ruled in for pathway analysis via Benjamini-Hochberg analyses using a false discovery rate (FDR) as indicated: (a) 116 dB SPL versus control-FDR = 0.15; (b) 110 dB SPL versus control-FDR = 0.15
Table 2a.
Previously reported genes linked to 116 dB SPL noise exposure
| Symbol | Gene title | Fold-change | P | Reference ID |
|---|---|---|---|---|
| Transcriptional regulators | ||||
| Fosa*,b*,d | FBJ osteosarcoma oncogene | 5.6 | 0.0002 | AV026617 |
| Egr1a*,b* | Early growth response 1 | 4.7 | 0.0001 | NM_007913 |
| Nr4a3b | Nuclear receptor subfamily 4, group A, member 3 | 3.5 | 0.0005 | BE692107 |
| Nr4a1b* | Nuclear receptor subfamily 4, group A, member 1 | 3.3 | 0.0001 | NM_010444 |
| Atf3b* | Activating transcription factor 3 | 3.1 | 0.0001 | BC019946 |
| Junb | Jun oncogene | 1.6 | 0.0164 | NM_010591 |
| Zfp36b | Zinc finger protein 36 | 1.5 | 0.0075 | X14678 |
| Oxidative and inflammatory stress response | ||||
| Dusp1b* | Dual specificity phosphatase 1 | 2.0 | 0.0002 | NM_013642 |
| Dusp5b* | Dual specificity phosphatase 5 | 1.7 | 0.0015 | BB442784 |
| Ptgs2b* | Prostaglandin-endoperoxide synthase 2 | 1.6 | 0.0014 | M94967 |
| Pvrb | Poliovirus receptor | 1.4 | 0.0226 | BB049138 |
| Cell cycle/differentiation | ||||
| Btg2a*,b | B-cell translocation gene 2 | 1.6 | 0.0156 | NM_007570 |
| Btg2a*,b | B-cell translocation gene 2 | 1.6 | 0.0289 | NM_007570 |
| Gdf15b* | Growth differentiation factor 15 | 1.2 | 0.0299 | NM_011819 |
Prior NIHL study = 90 min noise exposures (PTS and TTS), 2.0-fold-changes; no FDR utilized (Cho et al. 2004),
Prior NIHL study = Impulse noise, 2.0-fold changes (P < 0.008), FDR = 0.25 (Kirkegaard et al., 2006),
Salicylate ototoxicity = 2-fold up-regulation; no FDR utilized (Im et al., 2007)
Prior NIHL study = 90 min noise exposures (PTS and TTS) (Lomax et al. 2001),
Microarray data confirmed by qPCR
Table 3a.
Novel genes linked to 116 dB SPL noise exposure
| Gene symbol | Gene title | Fold change | P | Reference ID |
|---|---|---|---|---|
| Transcriptional regulators | ||||
| Junb | Jun-B oncogene | 2.7 | 0.0002 | NM_008416 |
| Signal transduction | ||||
| Gem | GTP binding protein (gene overexpressed in skeletal muscle) | 3.1 | 0.0005 | U10551 |
| Extracellular/ECM associated/secreted proteins | ||||
| Apold1 | Apolipoprotein L domain containing 1 | 3.5 | 0.0001 | BM123813 |
| Serpine1 | Serine (or cysteine) peptidase inhibitor, clade E, member 1 | 2.9 | 0.0001 | NM_008871 |
| Cyr61** | Cysteine rich protein 61 | 2.3 | 0.0000 | NM_010516 |
| Cyr61** | Cysteine rich protein 61 | 2.1 | 0.0001 | BM202770 |
| Cyr61** | Cysteine rich protein 61 | 2.0 | 0.0176 | BB533736 |
| Other | ||||
| 3300001A09Rik | RIKEN cDNA 3300001A09 gene | 1.9 | 0.0226 | AK014341 |
| Usp53 | Ubiquitin specific peptidase 53 | 1.9 | 0.0005 | AV320152 |
| Zfp533 | Zinc finger protein 533 | −1.4 | 0.0168 | BE982894 |
Duplicate entries represent different isoforms of the same gene or the same gene identified with a different probe sequence, ECM = Extracellular matrix
Table 4a.
116 dB SPL noise exposure: Enriched pathways
| Term | Count | Percentage | P |
|---|---|---|---|
| MAPK signaling | 9 | 0.5 | 2.1E-3 |
| Insulin signaling | 6 | 0.3 | 7.2E-3 |
Table 5a.
116 dB SPL noise exposure: Functional annotation clustering of similar GO terms relating to molecular function
| MAPK phosphatase activity*
| ||
|---|---|---|
| EASE score averagea = 3.26 | EASE scoreb | Fold enrichmentc |
| GO:0033549~MAPK phosphatase activity | 3.27E-04 | 27.9 |
| GO:0017017~MAPK tyrosine/serine/threonine phosphatase activity | 3.27E-04 | 27.9 |
| GO:0008138~protein tyrosine/serine/threonine phosphatase activity | 1.58E-03 | 9.8 |
EASE score average represents the-Log of the averaged EASE score per cluster, where 1.3 = −Log (P = 0.05),
EASE scores are the P values of a modified Fisher’s exact test. EASE score <0.05 is considered significant,
Degree of GO enrichment relative to background present on Affymetrix Mouse Genome 430 2.0 array,
Represents the most commonly shared GO term per cluster, GO = Gene ontology
To evaluate the changes that occur in 110 dB SPL noise exposure, gene expression immediately following 1 h noise exposure at 110 dB SPL was compared with control (110 vs. control). A total of 155 probes were found to be up-regulated and 221 down-regulated. Regulated probes included both novel and previously studied genes [Tables 2b and 3b]. The greater inclusion of down-regulated probes is apparent on the volcano plot [Figure 3b]. Pathway analysis indicated the enrichment of MAPK signaling and seven other pathways in the cochlear response to 110 dB SPL noise exposure [Table 4b]. Clustering of GO terms relating to molecular function are enriched for (1) MAPK activity, (2) carbohydrate binding and (3) phosphatase activity [Table 5a].
Table 2b.
Previously reported genes linked to 110 dB SPL noise exposure
| Symbol | Gene title | Fold-change | P | Reference ID |
|---|---|---|---|---|
| Transcriptional regulators | ||||
| Fosa*,b*,d | FBJ osteosarcoma oncogene | 7.4 | 0.0001 | AV026617 |
| Egr1a*,b* | Early growth response 1 | 5.4 | 0.0001 | NM_007913 |
| Nr4a1b* | Nuclear receptor subfamily 4, group A, member 1 | 4.5 | 0.0000 | NM_010444 |
| Nr4a3b | Nuclear receptor subfamily 4, group A, member 3 | 4.1 | 0.0002 | BE692107 |
| Atf3b* | Activating transcription factor 3 | 4.0 | 0.0000 | BC019946 |
| Cebpbb | CCAAT/enhancer binding protein, beta | 2.4 | 0.0001 | NM_013154 |
| Maffc* | V-maf musculoaponeurotic fibrosarcoma oncogene family, protein F | 2.1 | 0.0000 | BC022952 |
| Junb | Jun oncogene | 2.0 | 0.0024 | NM_010591 |
| Zfp36b | Zinc finger protein 36 | 1.6 | 0.0025 | X14678 |
| Nab2d | Ngf-A binding protein 2 | 1.4 | 0.0255 | NM_008668 |
| Oxidative and inflammatory stress response | ||||
| Dusp1b* | Dual specificity phosphatase 1 | 2.2 | 0.0001 | NM_013642 |
| Dusp5b* | Dual specificity phosphatase 5 | 1.8 | 0.0007 | BB442784 |
| Ptgs2b* | Prostaglandin-endoperoxide synthase 2 | 2.0 | 0.0002 | M94967 |
| Pvrb | Poliovirus receptor | 1.3 | 0.0043 | BB049138 |
| Pvrb | Poliovirus receptor | 1.2 | 0.0076 | NM_009310 |
| Cell cycle/differentiation | ||||
| Btg2a*,b | B-cell translocation gene 2 | 1.9 | 0.0041 | NM_007570 |
| Btg2a*,b | B-cell translocation gene 2 | 1.8 | 0.0131 | NM_007570 |
| Gdf15b* | Growth differentiation factor 15 | 1.4 | 0.0044 | NM_011819 |
Prior NIHL study = 90 min noise exposures (PTS and TTS); 2.0-fold-changes; no FDR utilized (Cho et al. 2004),
Prior NIHL study = Impulse noise, 2.0-fold-changes (P < 0.008), FDR = 0.25 (Kirkegaard et al. 2006),
Salicylate ototoxicity = 2-fold up-regulation, No FDR utilized (Im et al. 2007),
Prior NIHL study = 90 min noise exposures (PTS and TTS) (Lomax et al. 2001),
Microarray data confirmed by qPCR
Table 3b.
Novel genes linked to 110 dB SPL noise exposure
| Gene symbol | Gene title | Fold-change | P | Reference ID |
|---|---|---|---|---|
| Transcriptional regulators | ||||
| Junb | Jun-B oncogene | 3.2 | 0.0001 | NM_008416 |
| Signal transduction | ||||
| Gem | GTP binding protein (gene overexpressed in skeletal muscle) | 4.7 | 0.0001 | U10551 |
| Extracellular/ECM associated/secreted proteins | ||||
| Serpine1 | Serine (or cysteine) peptidase inhibitor, clade E, member 1 | 4.2 | 0.0000 | NM_008871 |
| Apold1 | Apolipoprotein L domain containing 1 | 3.7 | 0.0000 | BM123813 |
| Cyr61** | Cysteine rich protein 61 | 3.1 | 0.0000 | NM_010516 |
| Cyr61** | Cysteine rich protein 61 | 2.8 | 0.0000 | BM202770 |
| Cyr61** | Cysteine rich protein 61 | 2.3 | 0.0080 | BB533736 |
| Cyr61** | Cysteine rich protein 61 | 2.1 | 0.0117 | BB533736 |
| Other | ||||
| H19 | H19 fetal liver mRNA | −1.7 | 0.0250 | NM_023123 |
Duplicate entries represent different isoforms of the same gene or the same gene identified with a different probe sequence, ECM = Extracellular matrix
Table 4b.
110 dB SPL noise exposure: Enriched pathways
| Term | Count | Percentage | P |
|---|---|---|---|
| MAPK signaling | 13 | 0.6 | 2.4E-5 |
| Type II diabetes mellitus | 4 | 0.2 | 1.6E-2 |
| Calcium signaling | 7 | 0.3 | 1.8E-2 |
| B cell receptor signaling | 4 | 0.2 | 5.7E-2 |
| Primary immunodeficiency | 3 | 0.1 | 5.9E-2 |
| Fc epsilon RI signaling | 4 | 0.2 | 6.1E-2 |
| Wnt signaling | 5 | 0.2 | 8.0E-2 |
| Fc gamma R-mediated phagocytosis | 4 | 0.2 | 9.2E-2 |
A subset of genes from the enriched data sets was selected for verification by qPCR. Genes selected for qPCR analysis included both novel genes (Gem, Serpine1, Cyr61, H19, Ntn1, IgJ) and genes previously identified in microarray studies following noise exposure (Fos, Egr1, Mt1). Good correlation was observed between the microarray and qPCR, as both methods showed consistent up-or down-regulation of selected genes [Figure 4a and b]. Out of the 14 comparisons verified via qPCR, one comparison (using IgJ primers) showed a significant difference in FC expression relative to its microarray counterpart. IgJ showed 3.9 times greater down-regulation (9.3-FC vs. 2.4-FC) via qPCR than in microarray studies. Since qPCR is a sensitive technique, a greater FC detected with qPCR compared with microarray hybridization for a specific gene is not surprising.
Figure 4.
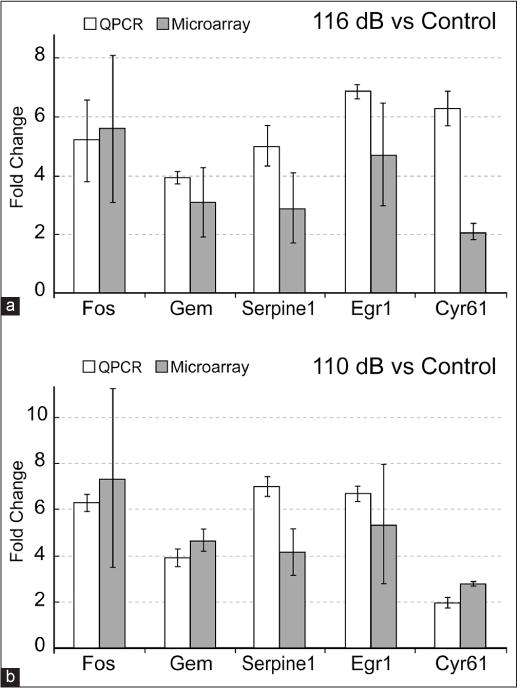
Comparison between microarray and real time polymerase chain reaction (PCR) results for selected genes. To verify the relative fold-changes (FCs) observed in the microarray analysis, total RNA recovered from each exposure group was used in real-time PCR (qPCR) analyses. Selected genes were evaluated for consistent up- or down-regulation. Relative FCs for each of the three different comparisons are as shown: (a) 116 dB SPL versus control, (b) 110 dB SPL versus control. qPCR assays were run in triplicate
Finally, since we carried out a genome-wide search, we wanted to examine whether the differentially expressed genes in our study were clustered to any specific chromosomes or if any loci had a high density of these genes. We mapped the location of each gene to its chromosome and found that there was no predilection to any one particular chromosome among the genes in our enriched data set [Table 6].
Table 6.
Mapping of differentially expressed genes to chromosome
| Chromosome | 116 versus control | 110 versus control |
|---|---|---|
| 1 | 20 | 23 |
| 2 | 27 | 30 |
| 3 | 26 | 22 |
| 4 | 19 | 27 |
| 5 | 11 | 18 |
| 6 | 23 | 21 |
| 7 | 16 | 25 |
| 8 | 10 | 19 |
| 9 | 14 | 17 |
| 10 | 16 | 18 |
| 11 | 21 | 25 |
| 12 | 15 | 12 |
| 13 | 13 | 15 |
| 14 | 6 | 9 |
| 15 | 14 | 16 |
| 16 | 8 | 13 |
| 17 | 10 | 23 |
| 18 | 8 | 15 |
| 19 | 8 | 8 |
| X | 10 | 10 |
We mapped the location of every gene from the three enriched data sets to their chromosome. Each number in a column represents the number of genes from a given data set that mapped to a specific chromosome. This data shows that there is no clustering of “NIHL genes” to any one particular chromosome among the genes in our enriched data set.
Discussion
Here, we present the first report of gene expression changes in CBA/CaJ mouse cochleae immediately following 1 h of noise exposure. Our study demonstrates that the activation of MAPK signaling is already present at this early time point in the mouse model. Good correlation between microarray and qPCR data validates the results obtained from global gene expression profiling of cochlear RNA after noise exposure as both methods showed consistent up- or down-regulation of all selected genes. The data presented here reveal a novel set of transcripts linked to early responses to noise exposure. This study provides further evidence that despite the activation of common signaling pathways, subtle differences in distinct transcriptomes differentiate the degree of hearing loss after different levels of noise exposure.
Previously identified and novel genes were found in both data sets [Tables 2 and 3]. For 116 dB SPL vs. control, 243 up-regulated and 61 down-regulated genes were identified. Cluster analysis of GO terms relating to molecular function shows enrichment for the GO term “MAPK phosphatase activity” and for pathways signaling transduction, inflammation, cytoprotective and stress response. For 110 dB SPL vs. control, 155 up-regulated and 221 down-regulated genes were identified. Pathway enrichment can be generally divided into categories of signal transduction, inflammation and stress response. We have identified a novel set of transcripts common to both exposures and a unique set of transcripts that distinguish subtle differences in the metabolic process induced by different levels of noise exposure. This observation is consistent with previous reports that compare different intensities of noise exposure.[2]
Interestingly, both levels of noise exposure appear to activate the MAPK signaling pathway to induce hearing loss, which is in agreement with the previous reports.[2,26,27] The observations of this study further suggest that, irrespective of the differences in the noise levels MAPK signaling is potentially a common and critical mediator in NIHL. Nevertheless, subtle differences were detected in the expression of some transcriptomes, even though the modulation of many of the signaling proteins in this pathway was similar in both levels of noise exposure. More importantly, the functional implications of the observed quantitative and qualitative differences are consistent with the corresponding differences in the pattern of hearing loss. For example, the noise-induced increases in the expression of Fos, which has been implicated in neuronal apoptosis and cell death,[28,29] was relatively lower in animals exposed to 110 dB SPL. This probably limits the hearing loss to a lower level than that observed with 116 dB SPL, in which the hearing threshold was 10–15 dB higher. In addition, the differential expressions of distinct MAPK signaling transcriptomes that facilitate a survival response also correspond with the levels of hearing loss. Particularly, genes that encode calcium channel proteins Cacna1b and Cacna1g and a calcium-independent phospholipase Pla2g6 were down-regulated at lower levels of noise exposure but were not altered at higher levels. Down-regulation of these genes in the cochlea might be part of the endogenous mechanism that is protective against low-level noise exposure. Noise exposure has been reported to favor the entry of calcium into the sensory cells, which in turn facilitates hearing loss.[30] The down-regulation of these genes could negatively impact this mechanism and contribute to the relatively lower levels of hearing loss observed at lower exposure levels. Taken together, these observations indicate that, despite the activation of common signaling pathways, the differential expression of distinct transcriptomes in MAPK signaling could determine the differences in the pattern of hearing loss after different levels of noise exposure. One important question relevant to the mechanism of NIHL is, “Which cell type(s) within the cochlear duct show differential expression or changes in specific signaling pathways?” Since the global expression study was carried out using whole cochlear tissue, it is not possible to assign cell type specific changes in gene expression or cell specific signaling pathways. One of the goals of a future study will be to investigate cell type specific changes in gene expression with a special focus on hair cells, support cells, ganglion cells and cells of the stria vascularis.
The partial overlap of our data set to previous noise exposure studies from other laboratories and those transcripts showing the same trend (up- or down-regulated) [Table 2] reveals several important points: First, irrespective of the animal model (mouse, chinchillas or guinea pigs), the type of noise exposure (TTS, PTS or impulse noise), or the duration of exposure to noise and/or the postexposure duration before tissue harvest,[13,14,20] our analysis reveals that a set of genes linked to transcriptional regulation, oxidative and inflammatory stress response and cell cycle/differentiation are up-regulated following noise exposure. In contrast, using a similar comparison to differential gene expression profiles in the salicylate ototoxicity of the mouse,[21] we found only two transcripts that overlapped with our data set. We propose that those genes noted in Table 2 are early-common responders to noise exposure and thus, generic biomarkers for noise exposure. Second, the cross-species consensus noted above suggests that a similar response is likely in humans following noise exposure. Third, noise exposure induces oxidative stress within an hour of exposure. Fourth, partial overlap of transcripts to previously reported studies noted above validates the methodology used to study the consequences to noise exposure at the molecular level.
In summary, different levels of acoustic over-stimulation result in profound changes in numerous common and divergent molecular pathways in as little as 1 h. We know that these pathways play important roles in tissues and organs outside of the ear. Thus, to interfere with the processes leading to different levels of threshold shifts, and therefore, rescue noise-damaged hearing, careful and targeted regulation of these metabolic pathways will be required. By better understanding the metabolic milieu of the noise-exposed ear, we hope to positively impact the current epidemic of NIHL.
Table 5b.
110 dB SPL noise exposure: Functional annotation clustering of similar GO terms relating to molecular function
| MAPK tyrosine/serine/threonine phosphatase activity* | ||
|---|---|---|
| EASE score averagea = 5.2 | EASE scoreb | Fold enrichmentc |
| GO:0017017~MAPK tyrosine/serine/ threonine phosphatase activity | 7.11E-07 | 30.6 |
| GO:0033549~MAPK phosphatase activity | 7.11E-07 | 30.6 |
| GO:0008138~protein tyrosine/serine/threonine phosphatase activity | 5.91E-04 | 8.6 |
| Carbohydrate binding | ||
| EASE score averagea=2.2 | EASE scoreb | Fold enrichmentc |
| GO:0005539~glycosaminoglycan binding | 1.08E-03 | 5.0 |
| GO:0030247~polysaccharide binding | 1.77E-03 | 4.6 |
| GO:0001871~pattern binding | 2.63E-03 | 4.3 |
| GO:0008201~heparin binding | 7.97E-03 | 4.8 |
| GO:0030246~carbohydrate binding | 1.59E-01 | 1.7 |
| Phosphatase activity | ||
| EASE score averagea=1.6 | EASE scoreb | Fold enrichmentc |
| GO:0004721~phosphoprotein phosphatase activity | 5.71E-03 | 3.3 |
| GO:0016791~phosphoric monoester hydrolase activity | 2.69E-02 | 2.4 |
| GO:0042578~phosphoric ester hydrolase activity | 8.79E-02 | 1.9 |
EASE score average represents the-Log of the averaged EASE score, where 1.3 = −Log (P = 0.05),
EASE scores are the P values of a modified Fisher’s exact test. EASE score <0.05 is considered significant.
The degree of GO enrichment relative to background present on Affymetrix Mouse Genome 430 2.0 array,
Represents the most commonly shared GO term per cluster, GO = Gene ontology
Acknowledgments
This work was supported by a grant (R21-DC07866) from the NIH to K.N.A. This work was carried out with the assistance of Nam Kim and David A. Custer; we appreciate their help and input.
Source of Support: This work was supported by a grant (R21-DC07866) from the NIH to K.N.A.
Footnotes
Conflict of Interest: None declared.
References
- 1.Tak S, Davis RR, Calvert GM. Exposure to hazardous workplace noise and use of hearing protection devices among US workers — NHANES, 1999–2004. Am J Ind Med. 2009;52:358–71. doi: 10.1002/ajim.20690. [DOI] [PubMed] [Google Scholar]
- 2.Meltser I, Tahera Y, Canlon B. Differential activation of mitogen-activated protein kinases and brain-derived neurotrophic factor after temporary or permanent damage to a sensory system. Neuroscience. 2010;165:1439–46. doi: 10.1016/j.neuroscience.2009.11.025. [DOI] [PubMed] [Google Scholar]
- 3.Bodmer D. Protection, regeneration and replacement of hair cells in the cochlea: Implications for the future treatment of sensorineural hearing loss. Swiss Med Wkly. 2008;138:708–12. doi: 10.4414/smw.2008.12260. [DOI] [PubMed] [Google Scholar]
- 4.Henderson D, Bielefeld EC, Harris KC, Hu BH. The role of oxidative stress in noise-induced hearing loss. Ear Hear. 2006;27:1–19. doi: 10.1097/01.aud.0000191942.36672.f3. [DOI] [PubMed] [Google Scholar]
- 5.Henderson D, McFadden SL, Liu CC, Hight N, Zheng XY. The role of antioxidants in protection from impulse noise. Ann N Y Acad Sci. 1999;884:368–80. doi: 10.1111/j.1749-6632.1999.tb08655.x. [DOI] [PubMed] [Google Scholar]
- 6.Walker MW, Kinter MT, Roberts RJ, Spitz DR. Nitric oxide-induced cytotoxicity: Involvement of cellular resistance to oxidative stress and the role of glutathione in protection. Pediatr Res. 1995;37:41–9. doi: 10.1203/00006450-199501000-00010. [DOI] [PubMed] [Google Scholar]
- 7.Duan M, Qiu J, Laurell G, Olofsson A, Counter SA, Borg E. Dose and time-dependent protection of the antioxidant N-L-acetylcysteine against impulse noise trauma. Hear Res. 2004;192:1–9. doi: 10.1016/j.heares.2004.02.005. [DOI] [PubMed] [Google Scholar]
- 8.Minami SB, Yamashita D, Ogawa K, Schacht J, Miller JM. Creatine and tempol attenuate noise-induced hearing loss. Brain Res. 2007;1148:83–9. doi: 10.1016/j.brainres.2007.02.021. [DOI] [PMC free article] [PubMed] [Google Scholar]
- 9.McFadden SL, Woo JM, Michalak N, Ding D. Dietary vitamin C supplementation reduces noise-induced hearing loss in guinea pigs. Hear Res. 2005;202:200–8. doi: 10.1016/j.heares.2004.10.011. [DOI] [PubMed] [Google Scholar]
- 10.Pirvola U, Xing-Qun L, Virkkala J, Saarma M, Murakata C, Camoratto AM, et al. Rescue of hearing, auditory hair cells, and neurons by CEP-1347/KT7515, an inhibitor of c-Jun N-terminal kinase activation. J Neurosci. 2000;20:43–50. doi: 10.1523/JNEUROSCI.20-01-00043.2000. [DOI] [PMC free article] [PubMed] [Google Scholar]
- 11.Ehrenberger K. Clinical experience with caroverine in inner ear diseases. Adv Otorhinolaryngol. 2002;59:156–62. doi: 10.1159/000059252. [DOI] [PubMed] [Google Scholar]
- 12.Ruel J, Wang J, Pujol R, Hameg A, Dib M, Puel JL. Neuroprotective effect of riluzole in acute noise-induced hearing loss. Neuroreport. 2005;16:1087–90. doi: 10.1097/00001756-200507130-00011. [DOI] [PubMed] [Google Scholar]
- 13.Cho Y, Gong TW, Kanicki A, Altschuler RA, Lomax MI. Noise overstimulation induces immediate early genes in the rat cochlea. Brain Res Mol Brain Res. 2004;130:134–48. doi: 10.1016/j.molbrainres.2004.07.017. [DOI] [PubMed] [Google Scholar]
- 14.Kirkegaard M, Murai N, Risling M, Suneson A, Järlebark L, Ulfendahl M. Differential gene expression in the rat cochlea after exposure to impulse noise. Neuroscience. 2006;142:425–35. doi: 10.1016/j.neuroscience.2006.06.037. [DOI] [PubMed] [Google Scholar]
- 15.Davis RR, Kuo MW, Stanton SG, Canlon B, Krieg E, Alagramam KN. N-Acetyl L-cysteine does not protect against premature age-related hearing loss in C57BL/6J mice: A pilot study. Hear Res. 2007;226:203–8. doi: 10.1016/j.heares.2006.07.003. [DOI] [PubMed] [Google Scholar]
- 16.Erway LC, Shiau YW, Davis RR, Krieg EF. Genetics of age-related hearing loss in mice. III. Susceptibility of inbred and F1 hybrid strains to noise-induced hearing loss. Hear Res. 1996;93:181–7. doi: 10.1016/0378-5955(95)00226-x. [DOI] [PubMed] [Google Scholar]
- 17.Wu Z, Irizarry RA, Gentleman R, Murillo FM, Spencer F. A Model Based Background Adjustment for Oligonucleotide Expression Arrays. Department of Biostatistics, Johns Hopkins University; 2004. (Working Papers). [Google Scholar]
- 18.Fisher RA. Statistical Methods for Research Workers. Edinburgh, London: Oliver and Boyd; 1925. [Google Scholar]
- 19.Benjamini Y, Hochberg Y. Controlling the false discovery rate — A practical and powerful approach to multiple testing. J R Stat Soc Series B Methodol. 1995;57:289–300. [Google Scholar]
- 20.Lomax MI, Gong TW, Cho Y, Huang L, Oh SH, Adler HJ, et al. Differential Gene Expression Following Noise Trauma in Birds and Mammals. Noise Health. 2001;3:19–35. [PubMed] [Google Scholar]
- 21.Im GJ, Jung HH, Chae SW, Cho WS, Kim SJ. Differential gene expression profiles in salicylate ototoxicity of the mouse. Acta Otolaryngol. 2007;127:459–69. doi: 10.1080/00016480600801365. [DOI] [PubMed] [Google Scholar]
- 22.Dennis G, Jr, Sherman BT, Hosack DA, Yang J, Gao W, Lane HC, et al. DAVID: Database for Annotation, Visualization, and Integrated Discovery. Genome Biol. 2003;4:P3. [PubMed] [Google Scholar]
- 23.Hosack DA, Dennis G, Jr, Sherman BT, Lane HC, Lempicki RA. Identifying biological themes within lists of genes with EASE. Genome Biol. 2003;4:R70. doi: 10.1186/gb-2003-4-10-r70. [DOI] [PMC free article] [PubMed] [Google Scholar]
- 24.Pfaffl MW. A new mathematical model for relative quantification in real-time RT-PCR. Nucleic Acids Res. 2001;29:e45. doi: 10.1093/nar/29.9.e45. [DOI] [PMC free article] [PubMed] [Google Scholar]
- 25.Zhao S, Fernald RD. Comprehensive algorithm for quantitative realtime polymerase chain reaction. J Comput Biol. 2005;12:1047–64. doi: 10.1089/cmb.2005.12.1047. [DOI] [PMC free article] [PubMed] [Google Scholar]
- 26.Jamesdaniel S, Hu B, Kermany MH, Jiang H, Ding D, Coling D, et al. Noise induced changes in the expression of p38/MAPK signaling proteins in the sensory epithelium of the inner ear. J Proteomics. 2011;75:410–24. doi: 10.1016/j.jprot.2011.08.007. [DOI] [PMC free article] [PubMed] [Google Scholar]
- 27.Maeda Y, Fukushima K, Omichi R, Kariya S, Nishizaki K. Time courses of changes in phospho- and total-MAP kinases in the cochlea after intense noise exposure. PLoS One. 2013;8:e58775. doi: 10.1371/journal.pone.0058775. [DOI] [PMC free article] [PubMed] [Google Scholar]
- 28.Ye X, Meeker HC, Kozlowski P, Carp RI. Increased c-Fos protein in the brains of scrapie-infected SAMP8, SAMR1, AKR and C57BL mice. Neuropathol Appl Neurobiol. 2002;28:358–66. doi: 10.1046/j.1365-2990.2002.00405.x. [DOI] [PubMed] [Google Scholar]
- 29.Mikula M, Gotzmann J, Fischer AN, Wolschek MF, Thallinger C, Schulte-Hermann R, et al. The proto-oncoprotein c-Fos negatively regulates hepatocellular tumorigenesis. Oncogene. 2003;22:6725–38. doi: 10.1038/sj.onc.1206781. [DOI] [PubMed] [Google Scholar]
- 30.Minami SB, Yamashita D, Schacht J, Miller JM. Calcineurin activation contributes to noise-induced hearing loss. J Neurosci Res. 2004;78:383–92. doi: 10.1002/jnr.20267. [DOI] [PubMed] [Google Scholar]