

Abstract
Objectives
The epidemiology of eosinophilic esophagitis (EoE) is rapidly evolving, and differences in climate could impact the prevalence of EoE. We aimed to examine the association between esophageal eosinophilia and climate zones in the U.S.
Methods
This was a cross-sectional study of esophageal biopsies from 2008 to 2010 in a large U.S. pathology database. Cases were patients with esophageal eosinophilia; controls had normal esophageal biopsies. A Köppen-Geiger (K-G) climate class was assigned to each patient, and the association between case-control status and the main K-G climate type (tropical, arid, temperate, or cold) was assessed.
Results
A total of 233,649 patients were included, 71,948 (30.8%) with normal esophageal biopsies and 9,995 (4.3%) with esophageal eosinophilia. Using the temperate zone as the referent and after multivariable analysis, the odds of esophageal eosinophilia were highest in the cold climate zone (OR = 1.39, 95% CI: 1.34-1.47), compared to the tropical zone (OR = 0.87; 95% CI: 0.71-10.8) and the arid zone (OR = 1.27; 95% CI: 1.19-1.36). Increased likelihood of EoE was also associated with increasing odds of being in the cold climate zone. Compared to patients with normal esophageal biopsies, patients with dysphagia, a clinical suspicion of EoE, no reflux or Barrett’s esophagus, esophageal eosinophilia, and eosinophilic microabscesses had the highest adjusted odds of being in a cold climate zone (OR 2.02; 1.78-2.28).
Conclusions
Esophageal eosinophilia differs significantly between K-G climate zones, with the highest prevalence in the cold and arid zones. Geographic and climate patterns may help identify candidate antigens characteristic to high-prevalence areas to be targeted for future investigation.
Keywords: Eosinophilic esophagitis, climate, epidemiology, Köppen-Geiger
Introduction
Eosinophilic esophagitis (EoE) is a chronic esophageal disease characterized by symptoms of esophageal dysfunction and dense esophageal eosinophilia in the absence of other etiologies (1, 2). Since its initial descriptions (3-5), both the incidence and prevalence of EoE have rapidly increased, particularly in the last decade (6-10), and EoE is now frequently found after endoscopic evaluation for esophageal symptoms (11-14).
Such dramatic epidemiologic shifts in a disease process are often associated with environmental exposures (15), and because EoE is frequently associated with atopy, immunopathogenetic mechanisms may be operative (2, 16). Climatic factors are major determinants of local flora, and consequently affect the airborne antigens to which a population is exposed. In some allergic and autoimmune conditions such as eczema, multiple sclerosis, and inflammatory bowel disease, poorly understood geographic factors appear to impact the observed incidence and prevalence of disease (17-25). It is unknown whether differences in geo-climatic factors could impact the prevalence of EoE.
The primary objective of this study was to determine the association between esophageal eosinophilia and climate zones in the United States in a large set of esophageal biopsy specimens. We hypothesized that there would be differences in the prevalence of esophageal eosinophilia by climate zone. The secondary objective was to determine whether the same associations would hold in patients suspected of having EoE.
Methods
Data Source
We conducted a cross-sectional study of all patients with esophageal biopsies examined between January 1, 2008 and November 26, 2010 by pathologists at Caris Diagnostics, a specialized pathology laboratory serving outpatient endoscopy and surgery centers throughout the United States. Samples are reviewed from 43 states, D.C., and Puerto Rico, with central specimen processing in one of three laboratories (Irving, Texas; Phoenix, Arizona; Boston, Massachusetts) following identical sectioning and staining procedures. The slides were originally reviewed for clinical purposes by sub-specialty trained gastrointestinal pathologists using a standardized approach to specimen handling and diagnostic criteria. A central database contains biopsy reports, demographic information (patient age and sex), indication for esophagogastroduodenoscopy (EGD), and location of the gastroenterology practice where the procedure was performed. For this study, we used a de-identified database of pre-existing records from unique patients with esophageal biopsies.
This study was approved by the Caris Institutional Review Board and the University of North Carolina Institutional Review Board.
Study population
Cases were patients with esophageal eosinophilia on esophageal biopsy. By definition, cases had histology demonstrating an epithelial infiltration of at least 15 eosinophils per high-power field (eos/hpf), with or without eosinophilic microabscesses, and were identified by two standardized codes used by Caris pathologists (26, 27). The first code was “active esophagitis with increased intraepithelial eosinophils”, which indicated that a biopsy from one location in the esophagus had at least 15 eos/hpf suggestive of EoE, but that there could be other potential diagnostic considerations. The second was “eosinophilic esophagitis pattern or injury”, which indicated the sample was consistent with EoE in the correct clinical context (biopsies from at least two esophageal locations had ≥ 15 eos/hpf, and other features supporting EoE such as basal zone hyperplasia or eosinophilic microabscesses were also present). Cases could have either of these two codes and were termed “esophageal eosinophilia”.
Controls were defined as patients with normal esophageal biopsies with unremarkable squamous mucosa. Specifically, controls had no evidence of pathologic processes or esophageal eosinophilia, including reflux-associated eosinophilia, non-eosinophilic inflammation of any type, epithelial erosion or ulceration, infection, intestinal metaplasia, dysplasia, or neoplasia.
Other histologic characteristics of interest included a quantification of the severity of esophageal eosinophilic density in ranges of eosinophils per high-power field (eos/hpf; 400 × with 22 mm oculars, equivalent to an area per hpf of 0.237 mm2), and the presence of eosinophilic microabscesses (defined as clusters of ≥ 4 contiguous eosinophils) (28).
Clinical characteristics of interest included selected upper gastrointestinal symptoms or conditions as derived from the indication for endoscopy (ie: suspected EoE or dysphagia symptoms).
The Köppen-Geiger Climate Zones
The main exposure was the Köppen-Geiger (K-G) climate class for the ZIP code in which each individual patient in the study was evaluated and biopsied. The K-G system, based on the work of Wladimir Köppen beginning in the late nineteenth century, is a widely used climate classification scheme derived from temperature and precipitation observations. Updated and modified versions of Köppen’s system, including a global climate map produced in collaboration with Rudolf Geiger, are employed in a number of disciplines seeking to regionalize climatic variables (29, 30). Because Köppen used vegetation distribution to identify and define the boundaries of climatic regions, the K-G classification has an established link to natural vegetation patterns (31-33).
The K-G scheme employs a three-letter system to classify and sub-classify geographic locations into climate zones. The first letter represents a location’s main climate type: tropical (A), arid (B), temperate (C), cold (D), or polar (E). A second letter is assigned based on annual and monthly precipitation as well as seasonal precipitation variation: desert (W), steppe (S), fully humid (f), dry summer (s), dry winter (w), or monsoonal (m). The majority of zones also receive a third letter designation based on annual and monthly temperature data: hot arid (h), cold arid (k), hot summer (a), warm summer (b), cool summer (c), extremely continental (d), polar frost (F), or polar tundra (T) (Table 1) (30, 32).
Table 1.
Definitions and examples of Köppen-Geiger climate zones represented in the study population
| Climate type and subclassifications | Representative city | ||
|---|---|---|---|
| A: Tropical climates; without frost, coolest month warmer than 65 F (18 C) | |||
| f: no dry season; rainfall throughout the year | Af: West Palm Beach, FL | ||
| m: pronounced wet season with short dry season | Am: Miami, FL | ||
| s: dry season | As: Pearl City, HI | ||
| B: Arid climates; evaporation exceeds precipitation | |||
| S: semiarid climate (steppe); low annual rainfall | h: mild, warm winter | BSh: McAllen, TX | |
| k: cool winter | BSk: Los Angeles, CA | ||
| W: arid climate (desert); minimal annual rainfall | h: mild, warm winter | BWh: Phoenix, AZ | |
| k: cool winter | BWk: Las Vegas, NV | ||
| C: Temperate, subtropical climates; eight months or more that average warmer than 50 F (10 C) | |||
| f: no dry season; rainfall throughout the year | a: average temperature of warmest month warmer than 72F (22 C) | Cfa: Nashville, TN | |
| b: average temperature of warmest month colder than 72 F (22 C) | Cfb: Beckley, WV | ||
| s: dry season in summer | a: average temperature of warmest month warmer than 72F (22 C) | Csa: Oceanside, CA | |
| b: average temperature of warmest month colder than 72 F (22 C) | Csb: San Jose, CA | ||
| D: Cold, temperate forest climates; four to eight months that average warmer than 50 F (10 C) | |||
| f: no dry season; rainfall throughout the year | a: average temperature of warmest month warmer than 72F (22 C) | Dfa: Chicago, IL | |
| b: average temperature of warmest month colder than 72F (22 C) | Dfb: Salt Lake City, UT | ||
| c: fewer than four months warmer than 50 F (10 C) | Dfc: Anchorage, AK | ||
Adapted from Bailey R. Description of the ecoregions of the United States. U.S. Fish and Wildlife Service, United States. Forest Service, 1980, and Kottek M, Grieser J, Beck C, Rudolf B, Rubel F. World map of the Köppen-Geiger climate classification updated. Meteorol Z 2006;15:259-263.
For this study we used an updated version of the Köppen-Geiger world map formulated by Kottek et al. in 2006 and based on data collected from 1951-2000 (30). This map divides the world’s climate into thirty-one zones. Our study population is drawn from fourteen of approximately twenty climate zones represented in the United States. Each patient was assigned to a K-G zone using geographic information system techniques and Kottek’s gridded map to link the ZIP code of each endoscopy center from which we received esophageal biopsies to a specific K-G climate zone (30). Geographic information systems are computer systems that integrate hardware, software, and data in order to capture, store, analyze and display geographically referenced information (34, 35). A map of the K-G zones in the United States is depicted in Figure 1 (33).
Figure 1.
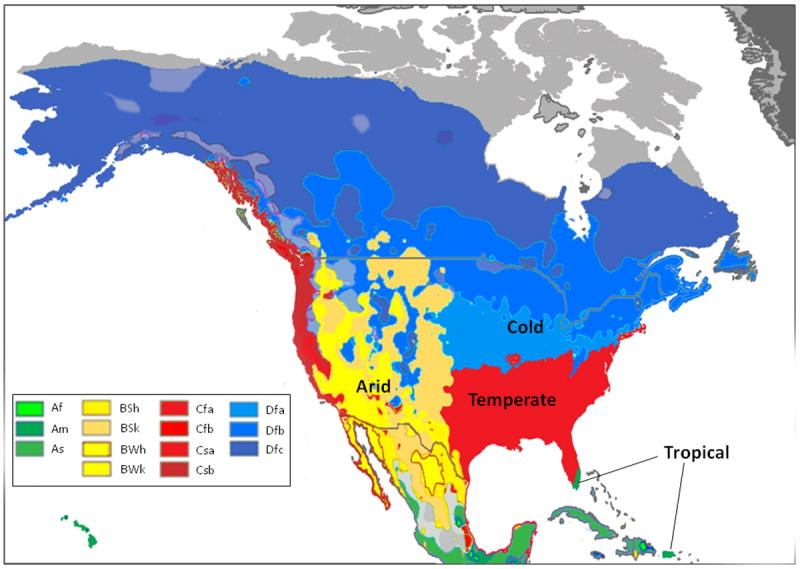
Köppen-Geiger (K-G) climate zones for the United States [adapted with permission from Peel MC, Finlayson BL, McMahon TA. Updated world map of the Koppen-Geiger climate classification. Hydrol Earth Syst Sci 2007;11:1633-1644]. The K-G scheme employs a three-letter system to define climate zones. The first letter represents a location’s main climate type: tropical (A), arid (B), temperate (C), cold (D), or polar (E). A second letter is assigned based on precipitation: desert (W), steppe (S), fully humid (f), dry summer (s), dry winter (w), or monsoonal (m). A third letter is designated based on temperature data: hot arid (h), cold arid (k), hot summer (a), warm summer (b), cool summer (c), extremely continental (d), polar frost (F), or polar tundra (T) (see also the supplemental table). The U.S. has approximately 20 of the 31 defined world-wide climate zones, and the 14 represented by the study population are highlighted in the box.
Statistical Analysis
To summarize the data, means and standard deviations were calculated for continuous variables and proportions were calculated for categorical data. Bivariate analyses were performed using Student’s t-test for continuous characteristics or Pearson’s chi-square for categorical characteristics. Unadjusted odds ratios (ORs) and 95% confidence intervals (CIs) were calculated to assess the association between case-control status and the main K-G climate type (A: tropical, B: arid, C: temperate or D: cold; the U.S. does not include any polar K-G zones). To adjust for potential confounders found on bivariate analysis, multivariate analyses were performed using logistic regression. A backwards elimination strategy was used to reduce the model, retaining those covariates whose removal would have caused a change in estimate greater than 10%. The initial model contained age, sex, dysphagia, abdominal pain, and reflux. Age was retained in the final model. Analyses were performed with STATA (version 9.2, College Station, Texas).
In addition to this main analysis, we performed an a priori sensitivity analysis to further explore the association between climate zone and an increasing clinical likelihood of EoE. We began with patients who were unlikely to have EoE who had pathology consistent with reflux esophagitis (defined as a mixed active/chronic inflammatory pattern with squamous papillomatosis and basal hyperplasia, but without evidence of eosinophilia). We then applied progressively restrictive limits on the presence of esophageal eosinophilia. First, we defined a group termed “histologic eosinophilic esophagitis”. This was a subgroup of the esophageal eosinophilia case group comprised of patients with at least 15 eos/hpf in two esophageal biopsy locations and with findings that the pathologist felt were consistent with EoE in the correct clinical context (as outlined above). We then restricted this group to those who also had an EGD indication of dysphagia or clinical suspicion for EoE, and had no histologic evidence of reflux esophagitis or Barrett’s esophagus. This definition was then further limited to patients who also had eosinophilic microabscesses in the esophageal epithelium.
Finally, we performed an analysis of the proportion of patients with esophageal eosinophilia in each climate zone as stratified by age range to determine if there was a cohort effect on the observed associations.
Results
Patient and biopsy characteristics
Over the study time frame, a total of 233,649 unique patients had esophageal biopsies with interpretations (Table 2). The mean age was 55.8 years and 46.2% were male. The most common indications for endoscopy were gastroesophageal reflux disease (GERD; 48.6%), abdominal pain (32.9%) and dysphagia (22.6%). There were 26,982 (11.6%) patients who underwent endoscopy for EoE suspected on a clinical basis. A total of 71,948 (30.8%) patients had normal esophageal biopsies and comprised the control group. There were 9,995 (4.3%) patients who had “esophageal eosinophilia” and who comprised the main case group. Of these, 7,156 (3.1%) had “histologic eosinophilic esophagitis”, indicating that the examining pathologist thought that the histopathologic findings were consistent with EoE in the correct clinical context.
Table 2.
Patient characteristics
| Clinical Characteristics | Esophageal Biopsies (n = 233,649) |
|---|---|
| Mean age ± SD | 55.8 ± 16.2 |
| Males (n, %) | 107,753 (46.2) |
| EGD indication (n, %)* | |
| Suspected EoE | 26,982 (11.6) |
| Dysphagia | 52,787 (22.6) |
| GERD/heartburn | 113,465 (48.6) |
| Barrett’s esophagus (screening or follow-up) | 32,257 (13.8) |
| Abdominal pain/dyspepsia | 76,935 (32.9) |
| Chest pain | 9,566 (4.1) |
| Nausea | 15,218 (6.5) |
| Vomiting | 8,850 (3.8) |
| Weight loss | 6,853 (2.9) |
| Failure-to-thrive | 96 (0) |
| Histologic Characteristics (n, %) | |
| Normal esophageal biopsies | 71,948 (30.8) |
| Esophageal eosinophilia† | 9,995 (4.3) |
| Histologic eosinophilic esophagitis‡ | 7,156 (3.1) |
| Eosinophilic microabscesses | 2,448 (1.0) |
| Köppen-Geiger climate zones (n, %)# | |
| All tropical | 3,286 (1.4) |
| Tropical – fully humid (Af) | 971 (0.4) |
| Tropical – monsoonal (Am) | 1,977 (0.9) |
| Tropical – dry summer (As) | 338 (0.1) |
| All arid | 26,884 (11.5) |
| Hot arid steppe (BSh) | 10,794 (4.6) |
| Cold arid steppe (BSk) | 7,322 (3.1) |
| Hot arid desert (BWh) | 3,952 (1.7) |
| Cold arid desert (BWk) | 4,816 (2.1) |
| All temperate | 169,695 (72.6) |
| Temperate – humid, hot summer (Cfa) | 147,268 (63.0) |
| Temperate – humid, warm summer (Cfb) | 154 (0.1) |
| Temperate – dry, hot summer (Csa) | 7,684 (3.3) |
| Temperate – dry, warm summer (Csb) | 14,589 (6.2) |
| All cold | 33,784 (14.5) |
| Cold – humid, hot summer (Dfa) | 16,554 (7.1) |
| Cold – humid, warm summer (Dfb) | 15,262 (6.5) |
| Cold – humid, cool summer (Dfc) | 1,968 (0.8) |
Patients could have more than one indication for EGD.
Any esophageal eosinophilia indicates that the examining pathologist noted prominent esophageal eosinophilia, but does not require that the findings were histologically consistent with EoE in the correct clinical context. This is the main case definition for this study.
Histologic eosinophilic esophagitis indicates that the examining pathologist thought that the finding were histologically consistent with EoE in the correct clinical context.
Percentages total to 100% for the 4 main categories (tropical, arid, temperate, and cold), and total to 100% for the 14 subcategories; see the supplemental table to specific definitions and examples of the climate zones.
Esophageal eosinophilia and climate zones
Fourteen climate zones throughout the United States were represented in this patient population (Table 2), with the most patients in a temperate zone (72.6%), fewest in tropical zones (1.4%), and the remainder in arid (11.5%) and cold (14.5%) zones. This distribution of patients reflects the general distribution of K-G zones in the United States (Figure 1). While the age and sex distributions of the overall study population were relatively similar across climate zones (Table 3), there were some differences for symptoms. For example, in the tropical zone, dysphagia was less common and nausea and abdominal pain were more common than in the other zones (p < 0.001 for each).
Table 3.
Patient characteristics by climate zone
| Clinical characteristics | Köppen-Geiger climate zones
|
|||
|---|---|---|---|---|
| A – tropical (n = 3,286) | B – arid (n = 26,884) | C – temperate (n = 169,695) | D – cold (n = 33,784) | |
| Mean age ± SD | 55.5 ± 14.5 | 56.9 ± 15.9 | 55.5 ± 16.3 | 56.4 ± 15.7 |
| Males (n, %) | 1,434 (43.6) | 12,741 (47.4) | 76,998 (45.4) | 16,580 (49.1) |
| EGD indication (n, %)* | ||||
| Suspected EoE | 280 (8.5) | 2,535 (9.43) | 20,381 (12.0) | 3,786 (11.2) |
| Dysphagia | 353 (10.7) | 6,516 (24.2) | 37,548 (22.1) | 8,370 (24.8) |
| GERD/heartburn | 1,741 (53.0) | 13,221 (49.2) | 82,325 (48.5) | 16,178 (47.9) |
| Abdominal pain/dyspepsia | 1,336 (40.7) | 8,046 (29.9) | 58,057 (34.2) | 9,496 (28.1) |
| Chest pain | 50 (1.5) | 1,007 (3.8) | 7,208 (4.3) | 1,301 (3.9) |
| Nausea | 394 (12.0) | 1,821 (6.8) | 10,919 (6.4) | 2,084 (6.2) |
| Vomiting | 58 (1.8) | 1,158 (4.3) | 6,412 (3.8) | 1,222 (3.6) |
| Weight loss | 60 (1.8) | 989 (3.7) | 4,819 (2.8) | 985 (2.9) |
| Failure-to-thrive | 0 | 31 (0.1) | 62 (0) | 3 (0) |
| Normal esophageal biopsies | 937 (28.5) | 7,272 (27.1) | 54,341 (32.0) | 9,398 (27.8) |
| Esophageal eosinophilia† | 98 (3.0) | 1,162 (4.3) | 7,118 (4.2) | 1,617 (4.8) |
| Histologic eosinophilic esophagitis‡ | 63 (1.9) | 823 (3.1) | 5,123 (3.0) | 1,147 (3.4) |
Patients could have more than one indication for EGD
Any esophageal eosinophilia indicates that the examining pathologist noted prominent esophageal eosinophilia, but does not require that the findings were histologically consistent with EoE in the correct clinical context. This is the main case definition for this study.
Histologic eosinophilic esophagitis indicates that the examining pathologist thought that the finding were histologically consistent with EoE in the correct clinical context.
As compared to patients with normal esophageal biopsies (Table 4), patients with esophageal eosinophilia were younger (44.4 years vs 53.7 years, p < 0.001) and more likely to be male (64.4% vs 35.5%, p < 0.001). They were also more likely to have dysphagia (54.0% vs 24.6%, p < 0.001) or EoE suspected on a clinical basis (44.4% vs 18.6%).
Table 4.
Comparison of patients with esophageal eosinophilia and normal esophageal biopsies
| Esophageal Eosinophilia (n = 9,995) | Normal Esophageal Biopsies (n = 71,948) | p-value* | |
|---|---|---|---|
| Mean age (± SD) | 44.4 ± 16.1 | 53.7 ± 17.0 | < 0.001 |
| Male (n, %) | 6,429 (64.4) | 25,532 (35.5) | < 0.001 |
| EGD indication (n, %)† | |||
| Suspected EoE | 4,433 (44.4) | 13,375 (18.6) | < 0.001 |
| Dysphagia | 5,392 (54.0) | 17,727 (24.6) | < 0.001 |
| GERD/heartburn | 4,077 (40.8) | 36,057 (50.1) | < 0.001 |
| Abdominal pain/dyspepsia | 2,315 (23.2) | 27,308 (38.0) | < 0.001 |
| Chest pain | 314 (3.1) | 4,485 (6.2) | < 0.001 |
| Nausea | 457 (4.6) | 5,327 (7.4) | < 0.001 |
| Vomiting | 336 (3.4) | 2,928 (4.1) | 0.001 |
| Weight loss | 140 (1.4) | 2,051 (2.8) | < 0.001 |
| Failure-to-thrive | 8 (0.1) | 57 (0.1) | 0.98 |
Based on t-test for continuous variables and Pearson’s chi-square for categorical variables
Patients could have more than one indication for EGD
The “cold” climate zone had the highest proportion of patients with esophageal eosinophilia (4.8%) compared to the “tropical” zone (3.0%), the arid zone (4.3%), and the temperate zone (4.2%; p < 0.001; Table 3). Using the temperate zone as the referent (Table 5), and after performing multivariate analysis, the adjusted odds of esophageal eosinophilia were highest in the cold climate zone (OR = 1.39, 95% CI: 1.34-1.47), compared to the tropical zone (OR = 0.87; 95% CI: 0.71-10.8) and the arid zone (OR = 1.27; 95% CI: 1.19-1.36).
Table 5.
Unadjusted and adjusted odds ratios for the association between any esophageal eosinophilia and Köppen-Geiger climate zones
| Esophageal eosinophilia | Normal esophageal biopsy | ORunadj (95% CI) | ORadj (95% CI)* | |
|---|---|---|---|---|
| Zone A – tropical | 98 | 937 | 0.80 (0.65-0.98) | 0.87 (0.71-1.08) |
| Zone B – arid | 1,162 | 7,272 | 1.22 (1.14-1.30) | 1.27 (1.19-1.36) |
| Zone C – temperate | 7,118 | 54,341 | 1.00 (ref) | 1.00 (ref) |
| Zone D – cold | 1,617 | 9,398 | 1.31 (1.24-1.39) | 1.39 (1.34-1.47) |
Adjusted for age on multivariate analysis with logistic regression
Increasing clinical suspicion of EoE was also associated with increasing odds of being in the cold climate zone (Table 6). Compared to patients with normal esophageal biopsies, and after performing multivariate analysis, patients with no suspicion of EoE and with reflux esophagitis on biopsy had minimally elevated adjusted odds of being in the cold climate zone (OR = 1.19; 95% CI: 1.16-1.23). Patients with “histologic eosinophilic esophagitis” had increased adjusted odds of being in a cold climate zone (OR = 1.39; 95% CI 1.30-1.49). This association was stronger when limited to those with dysphagia or a clinical suspicion of EoE, no reflux or Barrett’s esophagus, and with eosinophilic microabscesses, (OR 2.02; 1.78-2.28). A similar but less strong association was seen for increasing clinical suspicion of EoE and the arid climate zone, but not for the tropical zone.
Table 6.
Adjusted odds ratios for the association between Köppen-Geiger climate zones and increasing clinical suspicion of EoE
| Köppen-Geiger climate zones
|
||||
|---|---|---|---|---|
| A – tropical | B – arid | C – temperate | D – cold | |
| Reflux esophagitis on biopsy* | 1.22 (1.12-1.33) | 1.43 (1.38-1.47) | 1.00 (ref) | 1.19 (1.16-1.23) |
| Esophageal eosinophilia† | 0.87 (0.71-1.08) | 1.27 (1.19-1.36) | 1.00 (ref) | 1.39 (1.31-1.47) |
| Histologic eosinophilic esophagitis‡ | 0.80 (0.62-1.04) | 1.27 (1.17-1.37) | 1.00 (ref) | 1.39 (1.30-1.49) |
| Histologic eosinophilic esophagitis, with dysphagia or clinical suspicion for EoE, and no reflux or Barrett’s esophagus | 0.72 (0.52-1.00) | 1.32 (1.20-1.45) | 1.00 (ref) | 1.51 (1.39-1.63) |
| Histologic eosinophilic esophagitis, with dysphagia or clinical suspicion for EoE, and no reflux or Barrett’s esophagus, and esophageal eosinophilic microabscess | 0.71 (0.40-1.26) | 1.65 (1.43-1.91) | 1.00 (ref) | 2.02 (1.78-2.28) |
Reflux esophagitis was defined as defined as a mixed active/chronic inflammatory pattern with squamous papillomatosis and basal hyperplasia, but without evidence of eosinophilia.
Esophageal eosinophilia indicates that the examining pathologist noted prominent esophageal eosinophilia, but does not require that the findings were histologically consistent with EoE in the correct clinical context. This is the main case definition for this study.
Histologic eosinophilic esophagitis indicates that the examining pathologist thought that the finding were histologically consistent with EoE in the correct clinical context.
There were also differences in prevalence of esophageal eosinophilia by climate zone when stratified by age range (Figure 2). For ages 40 years and below, as compared to normal esophageal biopsies, the prevalence of esophageal eosinophilia was again highest in the cold climate zones, next highest in the arid zones, and lowest in the tropical zones. However, after age 50, there were no substantial differences in the prevalence of esophageal eosinophilia by climate zone.
Figure 2.
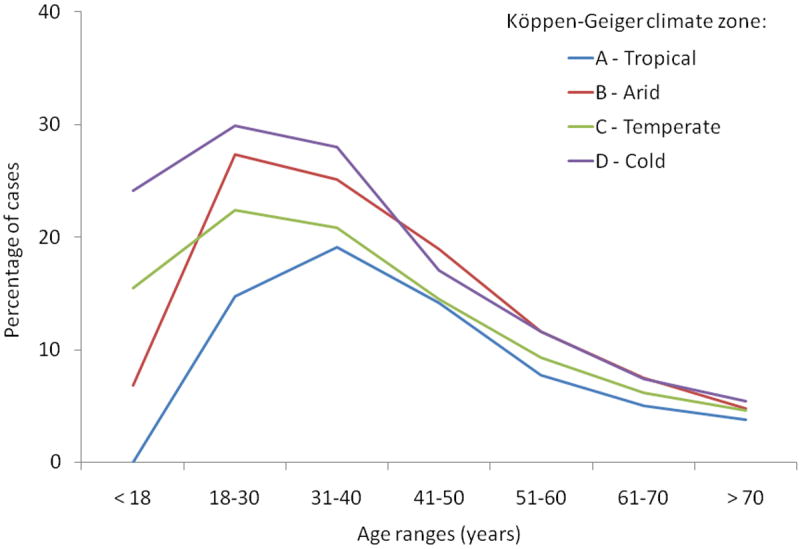
Age cohort analysis by Köppen-Geiger climate zone for esophageal eosinophilia as compared to normal biopsies. The largest differences were seen in those age of 40 and under, with no substantial differences in prevalence of esophageal eosinophilia after age 50.
Discussion
The epidemiology of EoE has evolved rapidly over the past decade with increasing incidence and prevalence (1, 2, 6-14, 36, 37). While the true etiology is incompletely understood, it seems likely that environmental factors are playing a role. For example, we have recently described an inverse association between esophageal eosinophilia and Helicobacter pylori (27), and others have identified specific food allergens or environmental triggers (38-41).
In this study, we analyzed a national pathology database to determine whether the prevalence of esophageal eosinophilia varied by Köppen-Geiger climate zone, hypothesizing that because climatic factors are major determinants of local flora, the subsequent airborne antigens could trigger EoE at different rates. We found that esophageal eosinophilia was strongly associated with cold climates, and, to a lesser extent, with arid climates. With increasingly stringent case definitions approximating EoE on a clinical basis, the odds of a cold or arid climate location also increased significantly, and this relationship help after adjusting for potential confounding factors.
This relationship between climate and esophageal eosinophilia has not been reported previously in the EoE literature. Several studies, however, have hinted at environmental associations. For example, in an initial case report highlighting this association, a patient’s esophageal eosinophil count was markedly increased during pollen seasons and normalized when the pollen was not present (42). Since then, larger studies have confirmed a relationship between aeroallergens and eosinophilic esophagitis in humans (41, 43), a relationship that has been established as causal in a murine model of EoE (44, 45). Seasonal variation has also been reported in multiple studies of EoE, a pattern that also argues for possible environmental triggers (6, 9, 40, 41, 46, 47). Interestingly, in preliminary data presented in abstract form from the same database used in this study, there was no clear trend in seasonal variation (48).
Other non-EoE allergic and autoimmune diseases have been found to have geographic variation potentially impacted by climate. A north-south gradient has been repeatedly reported for inflammatory bowel disease, though the underlying explanation for this finding remains elusive (21-25). Similar gradients have also been reported for multiple sclerosis (19, 20) and type-1 diabetes (49), while geographic variation has been noted for eczema (17, 18). Our findings that esophageal eosinophilia is increased in the cold and arid K-G climate zones is consistent with this existing literature, and while the design of our study cannot evaluate this, it is intriguing to hypothesize that certain flora might generate more potent aeroallergens in these regions compared to the flora, for example, in the tropical zone. Other potential hypotheses generated by our study could include differential use of air condition or heating in the arid or cold climates, differences in immunization patterns, or gradients in ultraviolet radiation exposure or vitamin D levels. Future studies which collect more granular environmental, social, health, and vegetation data would be able to investigate these hypotheses in more detail, using the associations presented here as a starting point.
It is also interesting to note that the difference in esophageal eosinophilia prevalence was limited to those patients under the age of 40, and was most prominent in the youngest cohort of patients. There are several potential explanations for this. First, during the last four decades there could have been a new exposure introduced in all zones, but one that was more common in the cold and arid zones than in the tropical zone. Second, perhaps place of birth or location during early childhood is important, or younger people are more affected by environmental factors. Third, this could represent detection bias, with increasing awareness of EoE in younger people leading to increasing diagnosis. Finally, it is possible that climate zone and geographic variation is lost in the older age ranges because people tend to move more throughout the country, blunting the effect. However, it appears that while people frequently change locations in the U.S., the majority tend to stay in the same county and the proportion of people who move tends to decrease substantially after the age of 44 (50). While our study design is observational in nature and does not allow conclusions to be drawn about these issues, the findings are hypothesis generating and should form the basis for future etiologic investigation of esophageal eosinophilia and EoE.
This study has several potential limitations. First, it is retrospective and cross-sectional, so only associations can be described and no conclusions about causality can be inferred. Second, given the data source, our main outcome was esophageal eosinophilia rather than confirmed cases of EoE. However, because we recognized this possible drawback during the design of the study, we were able to incorporate a sensitivity analysis to directly address this issue. When we examined increasingly stringent case definitions of EoE which combined histologic findings consistent with EoE and clinical symptoms to approximate a definitive clinicopathologic diagnosis, the observed relationships were found to be stronger. Finally, issues of confounding need to be considered. Patient race should be considered as a possible confounding factor because esophageal eosinophilia was increased in regions where there is a higher proportion of Caucasians, and it has been reported that EoE is more common in Caucasians (2). While we cannot directly test this because racial data is not included in the pathology database, several recent studies suggest that there are few differences in the presentation of EoE between African-American and Caucasians,(13, 51-53) and that the purported higher proportion of Caucasians with EoE might itself be due to the selection bias of the centers performing the studies.(53) In some centers located in areas with a large African-American population, more than 40% of patients with EoE are African-American.(13, 52) Another possible source of confounding is that the association between esophageal eosinophilia and climate zone could simply be related to differences in practice patterns between regions. However, this seems to be unlikely for empirically drawn climate (rather than geopolitical) zones, and is minimized by the study design that required all patients to have esophageal biopsies to be included, compared biopsies with esophageal eosinophilia to normal specimens, and found that the results held after multivariable analysis. Because this is a retrospective database analysis, we are limited in our ability to identify and account for all potential confounders, and given that the absolute increase in the ORs was modest (thought statistically significant), the results should be interpreted in this context.
In addition, the study has multiple strengths. The sample size is large and yields a correspondingly large number of patients with esophageal eosinophilia. All biopsies were rigorously and carefully characterized using standardized interpretation criteria with quality checks routinely performed on a clinical basis, so there is little chance of misclassification of esophageal eosinophilia case status. The choice of exposure, the K-G climate zone, is also a strength. While there are simpler ways to divide the country, such as by U.S. census regions (Northeast, Midwest, West, and South, with further subdivisions possible) or by states, the K-G system is the most accurate indicator of climate and flora currently available, and is widely used in atmospheric science and research (30, 32). Moreover, using regional- or state-based grouping introduces artificial boundaries whereas climate zones can cross states and regions and provide a more precise way to begin isolating the relationship between EoE and unidentified environmental antigens. State-based grouping might also make biases related to local practice patterns more prominent.
In conclusion, in this study of esophageal biopsies from a large U.S. national pathology database, we found that esophageal eosinophilia differed significantly between K-G climate zones, with the highest prevalence of cases in the cold and arid zones. Moreover, the findings were stronger with increasingly restrictive clinical and pathologic definitions of EoE. While the design of this study cannot speak directly to specific causative agents, it is hypothesis generating. Differences in practice patterns, patient characteristics, and living conditions may affect our findings and will need to be explored in future studies. However, since the distribution of vegetation is an expression of climate, our results support the possibility that exposure to airborne antigens may play a role in the etiology of EoE. Geographic and climate patterns identified in this large patient population may help identify candidate antigens characteristic to high-prevalence areas to be targeted for future investigation.
Study highlights.
What is current knowledge?
Eosinophilic esophagitis has a rapidly evolving epidemiology with increasing incidence and prevalence.
These changes could be due to environmental factors, but it is unknown whether differences in climatic factors could impact the prevalence of EoE throughout the United States.
What is new here?
The prevalence of esophageal eosinophilia differed significantly between climate zones, with the highest prevalence in the cold and arid zones.
With increasingly restrictive case definitions of eosinophilic esophagitis, the odds of being in a cold or arid climate zone also increased compared to the temperate climate zone.
The relationship between climate pattern and esophageal eosinophilia may help to generate hypotheses to identify candidate antigens characteristic to high-prevalence areas.
Acknowledgments
Financial support:
Grant support: This work is funded, in part, by NIH award number KL2RR025746 from the National Center for Research Resources (ESD).
The study sponsors had no role in the study design, collection, analysis, or interpretation of the data.
Guarantor of the article: Evan Dellon
Abbreviations
- CI
Confidence interval
- EGD
Esophagogastroduodenoscopy
- EoE
Eosinophilic esophagitis
- GERD
Gastroesophageal reflux disease
- K-G
Köppen-Geiger
- OR
Odds ratio
- U.S.
United Statues
Appendix – permission to adapt and reproduce Figure 1
From: Janina Schulz [janina.schulz@copernicus.org]
Sent: Tuesday, August 16, 2011 3:51 AM
To: Jennifer Hurrell
Subject: Re: Permission
Dear Jennifer Hurrell,
thank you for your mail.
Answering your question, please use the following link for more information:
http://publications.copernicus.org/for_authors/license_and_copyright.html.
In summary this means, that the copy rights of that paper are retained by the authors.
If you have any further questions, please do not hesitate to contact me.
With kind regards,
Janina Schulz
****************************************************
Copernicus Publications
The Innovative Open Access Publisher
Janina Schulz
Publication Production
Bahnhofsallee 1e
37081 Göttingen
Germany
Tel: +49-551-900339-59
Fax: +49-551-900339-70
****************************************************
Copernicus Gesellschaft mbH
USt-IdNr.: DE216566440
Based in Göttingen, Germany
Registered in HRB 131 298
County Court Göttingen
Managing Director Martin Rasmussen
***************************************************
Footnotes
Specific author contributions (all authors approved the final draft):
Hurrell: project conception and design; data acquisition/database construction; data analysis; data interpretation; drafting of the article and critical revision
Genta: project conception and design; data acquisition/database construction; data interpretation; critical revision; supervision
Dellon: database construction; data analysis; data interpretation; drafting of the article and critical revision; supervision
Potential competing interests:
Robert M. Genta is employed by Caris Diagnostics, Irving, Texas. There are no other potential conflicts of interest for any of the authors pertaining to this study
References
- 1.Furuta GT, Liacouras CA, Collins MH, et al. Eosinophilic esophagitis in children and adults: a systematic review and consensus recommendations for diagnosis and treatment. Gastroenterology. 2007;133:1342–63. doi: 10.1053/j.gastro.2007.08.017. [DOI] [PubMed] [Google Scholar]
- 2.Liacouras CA, Furuta GT, Hirano I, et al. Eosinophilic esophagitis: Updated consensus recommendations for children and adults. J Allergy Clin Immunol. 2011;128:3–20.e6. doi: 10.1016/j.jaci.2011.02.040. [DOI] [PubMed] [Google Scholar]
- 3.Landres RT, Kuster GG, Strum WB. Eosinophilic esophagitis in a patient with vigorous achalasia. Gastroenterology. 1978;74:1298–1301. [PubMed] [Google Scholar]
- 4.Attwood SE, Smyrk TC, Demeester TR, et al. Esophageal eosinophilia with dysphagia. A distinct clinicopathologic syndrome. Dig Dis Sci. 1993;38:109–16. doi: 10.1007/BF01296781. [DOI] [PubMed] [Google Scholar]
- 5.Straumann A, Spichtin HP, Bernoulli R, et al. Idiopathic eosinophilic esophagitis: a frequently overlooked disease with typical clinical aspects and discrete endoscopic findings. Schweiz Med Wochenschr. 1994;124:1419–29. [PubMed] [Google Scholar]
- 6.Prasad GA, Alexander JA, Schleck CD, et al. Epidemiology of eosinophilic esophagitis over three decades in Olmsted County, Minnesota. Clin Gastroenterol Hepatol. 2009;7:1055–61. doi: 10.1016/j.cgh.2009.06.023. [DOI] [PMC free article] [PubMed] [Google Scholar]
- 7.Straumann A, Simon HU. Eosinophilic esophagitis: escalating epidemiology? J Allergy Clin Immunol. 2005;115:418–9. doi: 10.1016/j.jaci.2004.11.006. [DOI] [PubMed] [Google Scholar]
- 8.Ronkainen J, Talley NJ, Aro P, et al. Prevalence of oesophageal eosinophils and eosinophilic oesophagitis in adults: The population-based Kalixanda study. Gut. 2007;56:615–20. doi: 10.1136/gut.2006.107714. [DOI] [PMC free article] [PubMed] [Google Scholar]
- 9.Dellon ES, Gibbs WB, Fritchie KJ, et al. Clinical, endoscopic, and histologic findings distinguish eosinophilic esophagitis from gastroesophageal reflux disease. Clin Gastroenterol Hepatol. 2009;7:1305–1313. doi: 10.1016/j.cgh.2009.08.030. [DOI] [PMC free article] [PubMed] [Google Scholar]
- 10.Noel RJ, Putnam PE, Rothenberg ME. Eosinophilic esophagitis. N Engl J Med. 2004;351:940–1. doi: 10.1056/NEJM200408263510924. [DOI] [PubMed] [Google Scholar]
- 11.Prasad GA, Talley NJ, Romero Y, et al. Prevalence and Predictive Factors of Eosinophilic Esophagitis in Patients Presenting With Dysphagia: A Prospective Study. Am J Gastroenterol. 2007;102:2627–32. doi: 10.1111/j.1572-0241.2007.01512.x. [DOI] [PubMed] [Google Scholar]
- 12.Mackenzie SH, Go M, Chadwick B, et al. Clinical trial: eosinophilic esophagitis in patients presenting with dysphagia: a prospective analysis. Aliment Pharmacol Ther. 2008;28:1140–6. doi: 10.1111/j.1365-2036.2008.03795.x. [DOI] [PubMed] [Google Scholar]
- 13.Veerappan GR, Perry JL, Duncan TJ, et al. Prevalence of Eosinophilic Esophagitis in an Adult Population Undergoing Upper Endoscopy: A Prospective Study. Clin Gastroenterol Hepatol. 2009;7:420–426. doi: 10.1016/j.cgh.2008.10.009. [DOI] [PubMed] [Google Scholar]
- 14.Desai TK, Stecevic V, Chang CH, et al. Association of eosinophilic inflammation with esophageal food impaction in adults. Gastrointest Endosc. 2005;61:795–801. doi: 10.1016/s0016-5107(05)00313-5. [DOI] [PubMed] [Google Scholar]
- 15.Okada H, Kuhn C, Feillet H, et al. The ‘hygiene hypothesis’ for autoimmune and allergic diseases: an update. Clin Exp Immunol. 2010;160:1–9. doi: 10.1111/j.1365-2249.2010.04139.x. [DOI] [PMC free article] [PubMed] [Google Scholar]
- 16.Rothenberg ME. Biology and treatment of eosinophilic esophagitis. Gastroenterology. 2009;137:1238–49. doi: 10.1053/j.gastro.2009.07.007. [DOI] [PMC free article] [PubMed] [Google Scholar]
- 17.McNally NJ, Williams HC, Phillips DR, et al. Is there a geographical variation in eczema prevalence in the UK? Evidence from the 1958 British Birth Cohort Study. Br J Dermatol. 2000;142:712–20. doi: 10.1046/j.1365-2133.2000.03416.x. [DOI] [PubMed] [Google Scholar]
- 18.Schafer T. The impact of allergy on atopic eczema from data from epidemiological studies. Curr Opin Allergy Clin Immunol. 2008;8:418–22. doi: 10.1097/ACI.0b013e32830e71a7. [DOI] [PubMed] [Google Scholar]
- 19.Simpson S, Jr, Blizzard L, Otahal P, et al. Latitude is significantly associated with the prevalence of multiple sclerosis: a meta-analysis. J Neurol Neurosurg Psychiatry. 2011 doi: 10.1136/jnnp.2011.240432. [DOI] [PubMed] [Google Scholar]
- 20.Risco J, Maldonado H, Luna L, et al. Latitudinal prevalence gradient of multiple sclerosis in Latin America. Mult Scler. 2011 doi: 10.1177/1352458511405562. [DOI] [PubMed] [Google Scholar]
- 21.Shivananda S, Lennard-Jones J, Logan R, et al. Incidence of inflammatory bowel disease across Europe: is there a difference between north and south? Results of the European Collaborative Study on Inflammatory Bowel Disease (EC-IBD) Gut. 1996;39:690–7. doi: 10.1136/gut.39.5.690. [DOI] [PMC free article] [PubMed] [Google Scholar]
- 22.Armitage EL, Aldhous MC, Anderson N, et al. Incidence of juvenile-onset Crohn’s disease in Scotland: association with northern latitude and affluence. Gastroenterology. 2004;127:1051–7. doi: 10.1053/j.gastro.2004.06.024. [DOI] [PubMed] [Google Scholar]
- 23.Michel P, St-Onge L, Lowe AM, et al. Geographical variation of Crohn’s disease residual incidence in the Province of Quebec, Canada. Int J Health Geogr. 2010;9:22. doi: 10.1186/1476-072X-9-22. [DOI] [PMC free article] [PubMed] [Google Scholar]
- 24.Nerich V, Monnet E, Weill A, et al. Fine-scale geographic variations of inflammatory bowel disease in France: correlation with socioeconomic and house equipment variables. Inflamm Bowel Dis. 2010;16:813–21. doi: 10.1002/ibd.21122. [DOI] [PubMed] [Google Scholar]
- 25.Logan I, Bowlus CL. The geoepidemiology of autoimmune intestinal diseases. Autoimmun Rev. 2010;9:A372–8. doi: 10.1016/j.autrev.2009.11.008. [DOI] [PubMed] [Google Scholar]
- 26.Kapel RC, Miller JK, Torres C, et al. Eosinophilic esophagitis: a prevalent disease in the United States that affects all age groups. Gastroenterology. 2008;134:1316–21. doi: 10.1053/j.gastro.2008.02.016. [DOI] [PubMed] [Google Scholar]
- 27.Dellon ES, Peery AF, Shaheen NJ, et al. Inverse association of esophageal eosinophilia with Helicobacter pylori based on analysis of a US pathology database. Gastroenterology. 2011 doi: 10.1053/j.gastro.2011.06.081. In press, Epub July 19, 2011. [DOI] [PMC free article] [PubMed] [Google Scholar]
- 28.Collins MH. Histopathologic features of eosinophilic esophagitis. Gastrointest Endosc Clin N Am. 2008;18:59–71. viii–ix. doi: 10.1016/j.giec.2007.09.014. [DOI] [PubMed] [Google Scholar]
- 29.Köppen W, Geiger R. Wall Map. Vol. 1. Mill, Klett-Perthes; Gotha: 1954. Klima der Erde (Climate of the Earth) p. 16. [Google Scholar]
- 30.Kottek M, Grieser J, Beck C, et al. World map of the Köppen-Geiger climate classification updated. Meteorol Z. 2006;15:259–263. [Google Scholar]
- 31.Thornthwaite CW. An Approach Toward a Rational Classification of Climate. Geogr Rev. 1948;38:55–94. [Google Scholar]
- 32.Oliver JE. Encyclopedia of World Climatology. Springer; 2005. pp. 219–221. [Google Scholar]
- 33.Peel MC, Finlayson BL, McMahon TA. Updated world map of the Koppen-Geiger climate classification. Hydrol Earth Syst Sci. 2007;11:1633–1644. [Google Scholar]
- 34. [September 1, 2011]; http://egsc.usgs.gov/isb/pubs/gis_poster/index.html.
- 35. [September 1, 2011]; http://www.gis.com/content/what-gis.
- 36.Katzka DA. Eosinophilic Esophagitis: From Rookie of the Year to Household Name. Clin Gastroenterol Hepatol. 2009;7:370–371. doi: 10.1016/j.cgh.2008.10.029. [DOI] [PubMed] [Google Scholar]
- 37.Peery AF, Shaheen NJ, Dellon ES. Practice patterns for the evaluation and treatment of eosinophilic esophagitis. Aliment Pharmacol Ther. 2010;32:1373–82. doi: 10.1111/j.1365-2036.2010.04476.x. [DOI] [PMC free article] [PubMed] [Google Scholar]
- 38.Markowitz JE, Spergel JM, Ruchelli E, et al. Elemental diet is an effective treatment for eosinophilic esophagitis in children and adolescents. Am J Gastroenterol. 2003;98:777–82. doi: 10.1111/j.1572-0241.2003.07390.x. [DOI] [PubMed] [Google Scholar]
- 39.Kagalwalla AF, Sentongo TA, Ritz S, et al. Effect of Six-Food Elimination Diet on Clinical and Histologic Outcomes in Eosinophilic Esophagitis. Clin Gastroenterol Hepatol. 2006;4:1097–1102. doi: 10.1016/j.cgh.2006.05.026. [DOI] [PubMed] [Google Scholar]
- 40.Almansa C, Krishna M, Buchner AM, et al. Seasonal distribution in newly diagnosed cases of eosinophilic esophagitis in adults. Am J Gastroenterol. 2009;104:828–33. doi: 10.1038/ajg.2008.169. [DOI] [PubMed] [Google Scholar]
- 41.Moawad FJ, Veerappan GR, Lake JM, et al. Correlation between eosinophilic oesophagitis and aeroallergens. Aliment Pharmacol Ther. 2010;31:509–15. doi: 10.1111/j.1365-2036.2009.04199.x. [DOI] [PubMed] [Google Scholar]
- 42.Fogg MI, Ruchelli E, Spergel JM. Pollen and eosinophilic esophagitis. J Allergy Clin Immunol. 2003;112:796–7. doi: 10.1016/s0091-6749(03)01715-9. [DOI] [PubMed] [Google Scholar]
- 43.Plaza-Martin AM, Jimenez-Feijoo R, Andaluz C, et al. Polysensitization to aeroallergens and food in eosinophilic esophagitis in a pediatric population. Allergol Immunopathol (Madr) 2007;35:35–37. doi: 10.1016/s0301-0546(07)70227-6. [DOI] [PubMed] [Google Scholar]
- 44.Mishra A, Hogan SP, Brandt EB, et al. An etiological role for aeroallergens and eosinophils in experimental esophagitis. J Clin Invest. 2001;107:83–90. doi: 10.1172/JCI10224. [DOI] [PMC free article] [PubMed] [Google Scholar]
- 45.Mishra A, Rothenberg ME. Intratracheal IL-13 induces eosinophilic esophagitis by an IL-5, eotaxin-1, and STAT6-dependent mechanism. Gastroenterology. 2003;125:1419–27. doi: 10.1016/j.gastro.2003.07.007. [DOI] [PubMed] [Google Scholar]
- 46.Wang FY, Gupta SK, Fitzgerald JF. Is there a seasonal variation in the incidence or intensity of allergic eosinophilic esophagitis in newly diagnosed children? J Clin Gastroenterol. 2007;41:451–3. doi: 10.1097/01.mcg.0000248019.16139.67. [DOI] [PubMed] [Google Scholar]
- 47.Spergel JM, Brown-Whitehorn TF, Beausoleil JL, et al. 14 years of eosinophilic esophagitis: clinical features and prognosis. J Pediatr Gastroenterol Nutr. 2009;48:30–6. doi: 10.1097/MPG.0b013e3181788282. [DOI] [PubMed] [Google Scholar]
- 48.Hurrell JM, Sonnenberg A, Genta RM. Seasonal patterns in eosinophilic esophagitis: An analysis by month of diagnosis and month of birth. Am J Gastroenterol. 2011;106(Suppl 2):S2. Ab 5. [Google Scholar]
- 49.Staples JA, Ponsonby AL, Lim LL, et al. Ecologic analysis of some immune-related disorders, including type 1 diabetes, in Australia: latitude, regional ultraviolet radiation, and disease prevalence. Environ Health Perspect. 2003;111:518–23. doi: 10.1289/ehp.5941. [DOI] [PMC free article] [PubMed] [Google Scholar]
- 50. [August 10, 2011]; http://www.census.gov/population/www/pop-profile/geomob.html.
- 51.Bohm M, Sebastiano C, Malik ZA, et al. Racial Differences in Symptoms and Endoscopic Findings in Adults With Eosinophilic Esophagitis: A 10 Year Experience in an Urban Hospital. Gastroenterology. 2011;140(Suppl 1):S244. [Google Scholar]
- 52.Sharma HP, Mansoor DK, Sprunger AC, et al. Racial disparities in the presentation of pediatric eosinophilic esophagitis. J Allergy Clin Immunol. 2011;127:AB110. [Google Scholar]
- 53.Sperry SLW, Woosley JT, Shaheen NJ, et al. Influence of race and gender on the presentation of eosinophilic esophagitis. Am J Gastroenterol. 2011 doi: 10.1038/ajg.2011.342. Epub October 4, 2011. [DOI] [PMC free article] [PubMed] [Google Scholar]