

Abstract
Background
Many studies assessed the impact of marine omega-3 fatty acids on glycemic homeostasis and lipid profiles in patients with type 2 diabetes (T2DM), but reported controversial results. Our goal was to systematically evaluate the effects of omega-3 on glucose control and lipid levels.
Methods
Medline, Pubmed, Cochrane Library, Embase, the National Research Register, and SIGLE were searched to identify eligible randomized clinical trials (RCTs). Extracted data from RCTs were analyzed using STATA 11.0 statistical software with fixed or random effects model. Effect sizes were presented as weighted mean differences (WMD) with 95% confidence intervals (95% CI). Heterogeneity was assessed using the Chi-square test with significance level set at p < 0.1.
Results
20 RCT trials were included into this meta-analysis. Among patients with omega-3 supplementation, triglyceride (TG) levels were significantly decreased by 0.24 mmol/L. No marked change in total cholesterol (TC), HbA1c, fasting plasma glucose, postprandial plasma glucose, BMI or body weight was observed. High ratio of EPA/DHA contributed to a greater decreasing tendency in plasma insulin, HbAc1, TC, TG, and BMI measures, although no statistical significance was identified (except TG). FPG levels were increased by 0.42 mmol/L in Asians. No evidence of publication bias was observed in this meta-analysis.
Conclusions
The ratio of EPA/DHA and early intervention with omega 3 fatty acids may affect their effects on glucose control and lipid levels, which may serve as a dietary reference for clinicians or nutritionists who manage diabetic patients.
Introduction
Type 2 diabetes (T2DM) is a metabolic disorder characterized by hyperglycemia in the context of insulin resistance and β-cell dysfunction. Its prevalence is increasing at an alarming rate worldwide [1–3]. Epidemiological and clinical trials have demonstrated that lifestyle, in particular daily diet, is of importance in the development and therapy of T2DM. That adherence to a healthy diet can improve glycemic control has been getting more and more attention of clinicians and nutritionists [4,5].
It was reported that high fish and seafood consumption could significantly reduce the incidence of T2DM in the Finnish population [6–8]. Bang et al. attributed such benefits of fish consumption to its main components, omega 3 fatty acids (in particular for eicosapentaenoic acid (C20:5n-3, EPA) and docosahexaenoic acid (C22:6n-3,DHA))—a group of homologue fatty acids belonging to polyunsaturated fatty acids (PUFAs) [7]. However, recent studies raised inverse standpoints on the benefits of administering omega-3 to diabetic patients for T2DM prevention [9–12], which may result in the underestimation the potential benefit of omega 3 in T2DM patients.
These findings trigger the investigations of omega 3 supplementation on glucose homeostasis [13–32]. Nevertheless, inconsistent conclusions still remain. These discrepancies may be attributed to differences in study designs such as trial design and duration, ethnic population of participants recruited, as well as dosage administered. Reaching clear-cut conclusions about the benefits of omega-3 administration in diabetic patients is therefore difficult, making a meta-analysis to be of significance as a dietary reference for clinicians.
According to the first related publication of systematic review in the year 2000, omega-3 had no adverse effects on glycemic control in people with diabetes [33]. The most recent systematic review was reported by Hartweg et al, in which omega 3 supplementation was found to lower the plasma level of triglyceride (TG) but have no statistical effect on glucose or insulin [34]. These previous systematic reviews were inconclusive for the diet guidance in diabetic patients. Thus, we systematically examined the randomized clinical trials (RCTs) to explore the definitive evidence on the benefit of omega-3 in patients with T2DM and to identify the appropriate dosage/compositions of omega 3 supplementation.
Methods
Data sources and searches
We searched the Medline, Pubmed, Cochrane Library, Embase, the National Research Register, and SIGLE (from the beginning of each database until last search of the latter in January 2015) (S1 Table) and we used Medical Subject Heading (MeSH) terms and keywords to search for records in English to identify trials involving omega-3 or n-3 or ω-3 fatty acids; docosapentaenoic acid or DPA; eicosapentaenoic or EPA; docosahexaenoic or DHA; fish oil(s)). We combined this with diabetes mellitus, type 2 diabetes or T2DM, to identify participants with T2DM. The bibliographic sections of all publications of included or excluded trials were searched manually for additional retrieval (S1 Fig).
Study selection
Two separate investigators reviewed the titles, abstracts and keywords to determine the relevance of studies. RCTs were considered. Full articles were retrieved for further assessment if the study 1) included subjects with T2DM, 2) included omega 3 fatty acids and placebo/vegetable oil for comparison, 3) had a minimum duration of 2 weeks, 4) assessed clinical measures including HbA1c, fasting plasma glucose (FPG), postprandial plasma glucose (PPG), fasting insulin (INS), triglycerides (TG), total cholesterol (TC), BMI, or body weight (S2 Table).
Studies were excluded if 1) omega 3 supplementation was not assessed; or 2) multifactorial intervention was not included; or 3) duration of trials were less than 2 weeks; or 4) only an effect estimate was reported with no means to calculate the corresponding CI (S2 Table).
Data extraction
To minimize bias, all data were extracted independently from the studies by two investigators. Disagreements were resolved by consensus. The data extraction form was comprised of the type of trial (parallel, cross-over, or before-after), type of omega-3 fatty acids, control supplementations, length of intervention, study setting, diabetes diagnosis, baseline characteristics of included subjects (including patient number, age, gender, race, disease duration, complications), and relevant clinical outcomes (including HbA1c, FPG, PPG, INS, TG, TC, BMI, and body weight).
Quality assessment
Two investigators assessed quality scores of studies independently, with inconsistency settled by consensus. We adopted the criterion system developed by Jadad and Schulz [35,36], which had a possible range from 0 to 5 with 2 as a cutoff for the selection of high-quality studies.
Statistical analysis
Extracted data from RCTs were analyzed separately to evaluate potential interactions between omega-3 and glycemic control using STATA 11.0 statistical software with fixed-effects model. A random-effects model was applied when the heterogeneity was notable (p<0.1). Effect sizes are presented as weighted mean differences (WMD) with 95% confidence intervals (95% CI). Heterogeneity was assessed using the Chi-square method with significance value set at p<0.1. Risk of publication bias was evaluated using Egger’s test with p-value<0.1 as significant bias [37].
Subgroup analyses were undertaken for the following variables: 1) duration of intervention (less than 8 weeks, longer than 8 weeks); 2) dose of EPA (less than 1.8g/d EPA, more than 1.8g/d EPA); 3) dose of DHA (less than 1.0g/d DHA, more than 1.0g/d DHA); 4) ratio of EPA/DHA (EPA/DHA<1.4, 1.4≤EPA/DHA≤1.5; EPA/DHA>1.5); 5) race (US/European versus Asian).
Meta-regression analysis was performed to identify the potential sources of heterogeneity between included studies. p-value<0.1 was set to be statistically significant. Dose of EPA and DHA, ratio of EPA/DHA, trial duration, and race were analyzed in the regression model.
Sensitivity analyses for RCTs were carried out on studies that fulfill 1) higher than 2 points on quality scale; 2) blinding (blinded studies); 3) parallel study design; 4) exclusion of any study especially on large scale (studies with a sample size larger than 100) to estimate the degree they dominate the results.
Results
Description of studies
1445 papers were obtained from electronic searches performed in 2015 and one further trial was found from manual searching. 1324 studies were excluded for not meeting the inclusion criteria, giving a total of 111 studies for full-text articles screen. Finally, 20 RCTs were potentially eligible, which were further described below (Fig 1). The PRISMA statement is shown in S1 Dataset.
Fig 1. Flow chart on the articles selection process.

The effect of omega-3 fatty acids on glycemic control and lipid levels was the focus of 20 included RCTs. Criteria for RCTs exclusion included 24 non-randomized studies, 19 non-controlled studies, 13 publications which did not assess omega 3 supplementation, 25 studies including multifactorial intervention, 6 studies that did not include human or adult participants, and 4 trials with short duration less than 2 weeks.
The 20 RCTs included 9 parallel group design [13–21], 7 cross-over design studies [22–27,32] and 4 self-control design studies [28–31] (S3 Table). The RCTs could be classified into two categories according to the Jadad system: high quality (score > 2, n = 13), and low quality (score ≤ 2, n = 7) (S4 Table). The RCTs with high quality include 1 study scoring 5/5 [13], 5 scoring 4/5 [14,15,18,22,23] and 7 scoring 3/5 [16,17,19,20,24,25,32], which provided complete information for outcome data, adequate sequence generation, allocation concealment, and withdrawl number. All the included RCTs showed no outcome reporting bias.
A total of 1209 T2DM patients were recruited in the RCTs. The individual study sample size ranged from 6 to 414. The majority of subjects were male, aged between 51 to 64 years. Most participants had a T2DM history of 1 to 17 years, who were treated with lifestyle control or oral anti-diabetic drugs. Few of these included patients presented diabetic complications. The dose of omega-3 varied from 0.52 to 3.89g of EPA and 0 to 3.69g of DHA in T2DM patients. The dose of vegetable oil (including olive oil, safflower oil, corn oil, etc) was comparable to that of omega-3 fatty acids. In all included trials, omega-3 fatty acids were supplemented to the diet instead of a replacement for some dietary fat intake.
Effects of interventions
14 of 20 RCT trials with 735 participants reported data on TG (Fig 2G). Omega 3 supplementation was related to a mean (pooled WMD) decrease of plasma TG concentration of 0.24 mmol/L (-0.33 to -0.15 mmol/L, 95% CI) compared to placebo (including vegetable oils). This decrease was remarkably significant (p<0.01) (Fig 2G). 17 of 20 RCT trials with 906 participants reported data on TC. But the outcome failed to show a significant decrease. Similarly, both glucose control outcomes (FPG, PPG, INS, and HbA1c) and body weight parameters (weight and BMI) with omega 3 intervention presented a non-significant difference when compared with control groups.
Fig 2. Effects of omega 3 fatty acids on BMI (A), weight (B), FPG (C), PPG (D), HbA1c (E), INS (F), TG (G), and TC (H).
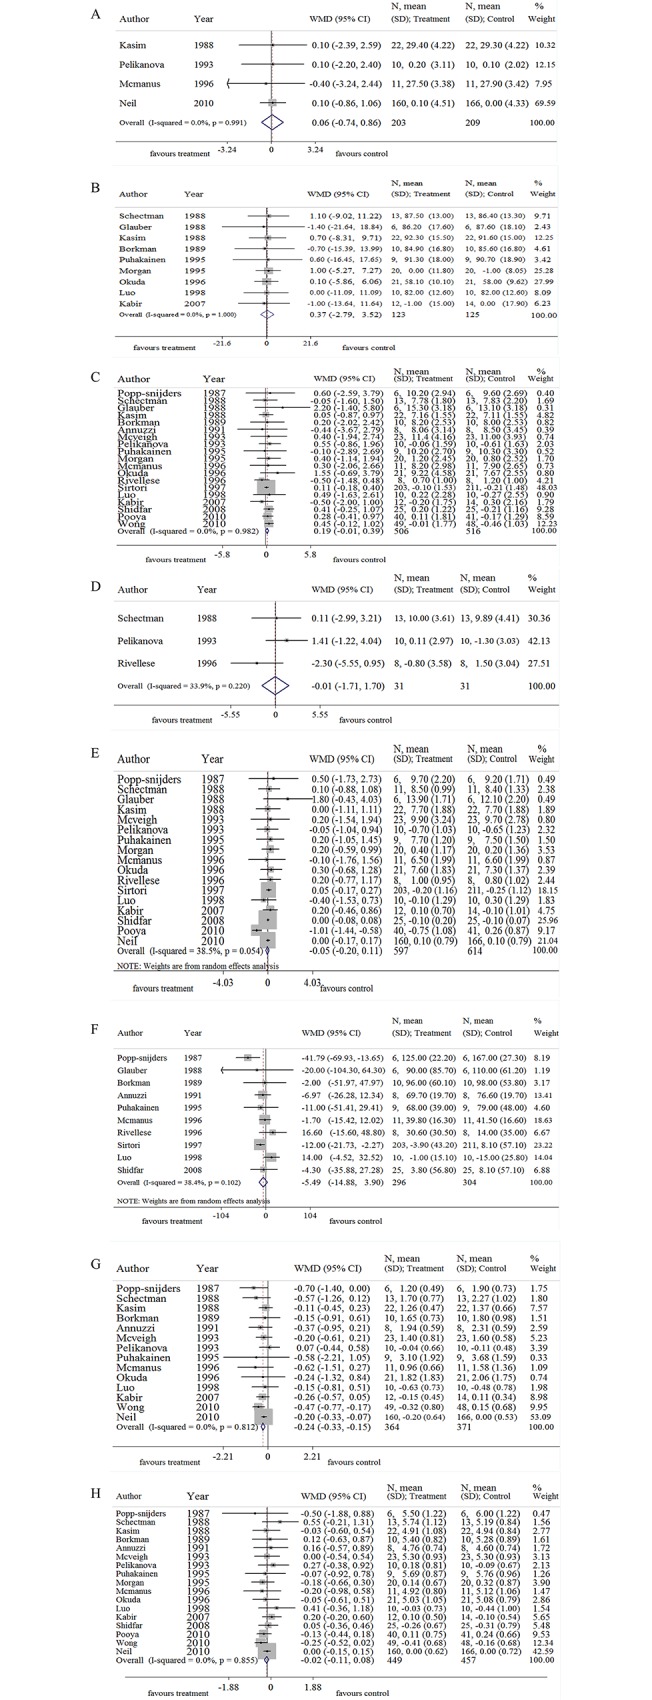
Note: BMI, body mass index; FPG, fast plasma glucose; PPG, postprandial glucose; HbA1c, glycosylated hemoglobin; INS, insulin; TG, Triglyceride; TC, total cholesterol; WMD, weighted mean difference.
A moderate heterogeneity was detected in HbA1c (I-squared = 38.5, p = 0.054, Fig 2E). Thus, we analyzed these data according to the consumption dose of omega-3 (EPA and DHA), ratio of EPA/DHA, the trial duration, and ethnic populations.
Subgroup analysis and heterogeneity
Table 1 shows the data from trials with high doses (more than 1.8g EPA) and low doses of EPA (less than 1.8g EPA). The levels of TG in the high dose groups were reduced by 0.3 mmol/L (-0.56 to -0.03 mmol/L, 95% CI, p = 0.03), similar with that in the low dose groups by 0.24mmol/L (-0.34 to -0.13 mmol/L, 95% CI, p<0.01). Besides plasma TG, no significant difference was identified in other clinical measures. Table 2 shows data from trials with high and low doses of DHA and Table 3 demonstrates the data from trials with different durations (Duration > 8 weeks and Duration≤8 weeks). Similar with EPA subgroups, pooled WMD was significant only in TG levels either according to DHA dosage or duration sub-grouping. Additionally, the high dose (EPA or DHA) and long duration subgroups all contributed to a greater reduction in TG levels.
Table 1. Omega-3 versus placebo (subgroups EPA dose).
| Overall effect | Heterogeneity | ||||||
|---|---|---|---|---|---|---|---|
| Outcome | No. of studies | No. of participants | Statistical method | Effect size[95%CI] | P | I2,% | P' |
| Glycemic control | |||||||
| FPG (mmol/L) | 17 | 990 | WMD (IV, Fixed) | 0.181[-0.022,0.385] | 0.081 | 0.0 | 0.964 |
| Low dose (<1.8 g/d EPA) [13,14,16–19,22,23,30] | 9 | 220 | WMD (IV, Fixed) | 0.165[-0.047,0.376] | 0.127 | 0.0 | 0.819 |
| High dose (≥1.8 g/d EPA) [20,24–29,32] | 8 | 770 | WMD (IV, Fixed) | 0.396[-0.364,1.157] | 0.307 | 0.0 | 0.910 |
| PPG (mmol/L) | 2 | 42 | WMD (IV, Fixed) | -1.036[-3.280,1.208] | 0.366 | 9.5 | 0.293 |
| Low dose (<1.8 g/d EPA) [19] | 1 | 16 | WMD (IV, Fixed) | -2.300[-5.555,0.955] | 0.166 | ― | ― |
| High dose (≥1.8 g/d EPA) [25] | 1 | 26 | WMD (IV, Fixed) | 0.110[-2.988,3.208] | 0.954 | ― | ― |
| HbAc1 (%) | 15 | 1179 | WMD (D+L, Random) | -0.050[-0.219,0.119] | 0.565 | 45.7 | 0.028 |
| Low dose (<1.8 g/d EPA) [14–19,22,23,30] | 9 | 999 | WMD (D+L, Random) | -0.103[-0.301,0.094] | 0.305 | 64.1 | 0.004 |
| High dose (≥1.8 g/d EPA) [20,24,25,28,29,32] | 6 | 180 | WMD (D+L, Random) | 0.266[-0.187,0.719] | 0.250 | 0.0 | 0.852 |
| INS (pmol/L) | 9 | 588 | WMD (D+L, Random) | -4.288[-10.911,2.335] | 0.204 | 2.8 | 0.411 |
| Low dose (<1.8 g/d EPA) [16,18,19,22,23] | 5 | 522 | WMD (D+L, Random) | -0.448[-11.760,10.863] | 0.938 | 49.4 | 0.095 |
| High dose (≥1.8 g/d EPA) [24,26–28] | 4 | 66 | WMD (D+L, Random) | -7.572[-23.717,8.572] | 0.358 | 0.0 | 0.983 |
| Lipid parameters | |||||||
| TG (mmol/L) | 12 | 703 | WMD (IV, Fixed) | -0.243[-0.339,-0.147] | <0.001 | 0.0 | 0.912 |
| Low dose (<1.8 g/d EPA) [13,15,17,22,23,30] | 6 | 535 | WMD (IV, Fixed) | -0.235[-0.338,-0.133] | <0.001 | 0.0 | 0.543 |
| High dose (≥1.8 g/d EPA) [24–27,29,32] | 6 | 168 | WMD (IV, Fixed) | -0.297[-0.564,-0.030] | 0.029 | 0.0 | 0.950 |
| TC(mmol/L) | 15 | 874 | WMD (IV, Fixed) | -0.023[-0.120,0.073] | 0.635 | 0.0 | 0.831 |
| Low dose (<1.8 g/d EPA) [13–17,22,23,30] | 8 | 666 | WMD (IV, Fixed) | -0.033[-0.138,0.073] | 0.542 | 0.0 | 0.544 |
| High dose (≥1.8 g/d EPA) [20,24–27,29,32] | 7 | 208 | WMD (IV, Fixed) | 0.024[-0.213,0.262] | 0.840 | 0.0 | 0.828 |
| BMI (kg/m2) | 3 | 392 | WMD (IV, Fixed) | 0.055[-0.800,0.909] | 0.900 | 0.0 | 0.947 |
| Low dose (<1.8 g/d EPA) [15,23,30] | 3 | 392 | WMD (IV, Fixed) | 0.055[-0.800,0.909] | 0.900 | 0.0 | 0.947 |
| Weight(kg) | 9 | 248 | WMD (IV, Fixed) | 0.365[-2.788,3.518] | 0.820 | 0.0 | 1.000 |
| Low dose (<1.8 g/d EPA) [17,22,30] | 3 | 90 | WMD (IV, Fixed) | 0.088[-6.030,6.206] | 0.977 | 0.0 | 0.977 |
| High dose (≥1.8 g/d EPA) [20,24,25,27–29] | 6 | 158 | WMD (IV, Fixed) | 0.466[-3.214,4.145] | 0.804 | 0.0 | 1.000 |
Notes: BMI, body mass index; FPG, fast plasma glucose; PPG, postprandial glucose; HbA1c, glycosylated hemoglobin; INS, insulin; TG, Triglyceride; TC, total cholesterol; WMD, weighted mean difference; IV, inverse variance; D+L, DerSimonian & Laird;-, not available.
Table 2. Omega-3 versus placebo (subgroups DHA dosage).
| Overall effect | Heterogeneity | ||||||
|---|---|---|---|---|---|---|---|
| Outcome | No. of studies | No. of participants | Statistical method | Effect size[95%CI] | P | I2,% | P' |
| Glycemic control | |||||||
| FPG (mmol/L) | 17 | 990 | WMD (IV, Fixed) | 0.181[-0.022,0.385] | 0.081 | 0.0 | 0.964 |
| Low dose (≤1.0 g/d DHA) [13,14,16–18,22,23,29] | 8 | 752 | WMD (IV, Fixed) | 0.219[-0.003,0.440] | 0.053 | 0.0 | 0.801 |
| High dose (>1.0 g/d DHA) [19,20,24–28,30,32] | 9 | 238 | WMD (IV, Fixed) | -0.023[-0.538,0.493] | 0.932 | 0.0 | 0.939 |
| PPG (mmol/L) | 2 | 42 | WMD (IV, Fixed) | -1.036[-3.280,1.208] | 0.366 | 9.5 | 0.293 |
| High dose (>1.0 g/d DHA) [19,25] | 2 | 42 | WMD (IV, Fixed) | -1.036[-3.280,1.208] | 0.366 | 9.5 | 0.293 |
| HbAc1 (%) | 15 | 1179 | WMD (D+L, Random) | -0.050[-0.219,0.119] | 0.565 | 45.7 | 0.028 |
| Low dose (≤1.0 g/d DHA) [14–18,22,23,29] | 8 | 981 | WMD (D+L, Random) | -0.106[-0.313,0.101] | 0.318 | 68.9 | 0.002 |
| High dose (>1.0 g/d DHA) [19,20,24,25,28,30,32] | 7 | 198 | WMD (D+L, Random) | 0.210[-0.209,0.628] | 0.326 | 0.0 | 0.906 |
| INS (pmol/L) | 9 | 588 | WMD (D+L, Random) | -4.288[-10.911,2.335] | 0.204 | 2.8 | 0.411 |
| Low dose (≤1.0 g/d DHA) [16,18,22,23] | 4 | 506 | WMD (D+L, Random) | -2.353[-13.970,9.264] | 0.691 | 52.1 | 0.100 |
| High dose (>1.0 g/d DHA) [19,24,26–28] | 5 | 82 | WMD (D+L, Random) | -2.716[-17.148,11.715] | 0.712 | 0.0 | 0.755 |
| Lipid parameters | |||||||
| TG (mmol/L) | 12 | 703 | WMD (IV, Fixed) | -0.243[-0.339,-0.147] | <0.001 | 0.0 | 0.912 |
| Low dose (≤1.0 g/d DHA) [13,15,17,22,23,29] | 6 | 533 | WMD (IV, Fixed) | -0.248[-0.355,-0.141] | <0.001 | 0.0 | 0.628 |
| High dose (>1.0 g/d DHA) [24–27,30,32] | 6 | 170 | WMD (IV, Fixed) | -0.225[-0.438,-0.011] | 0.039 | 0.0 | 0.867 |
| TC (mmol/L) | 15 | 874 | WMD (IV, Fixed) | -0.023[-0.120,0.073] | 0.635 | 0.0 | 0.831 |
| Low dose (≤ 1.0 g/d DHA) [13–17,22,23,29] | 8 | 664 | WMD (IV, Fixed) | -0.033[-0.139,0.072] | 0.533 | 0.0 | 0.543 |
| High dose (>1.0 g/d DHA) [20,24–27,30,32] | 7 | 210 | WMD (IV, Fixed) | 0.028[-0.210,0.266] | 0.815 | 0.0 | 0.832 |
| BMI (kg/m2) | 3 | 392 | WMD (IV, Fixed) | 0.055[-0.800,0.909] | 0.900 | 0.0 | 0.947 |
| Low dose (≤ 1.0 g/d DHA) [15,23] | 2 | 348 | WMD (IV, Fixed) | 0.049[-0.861,0.959] | 0.916 | 0.0 | 0.744 |
| High dose (>1.0 g/d DHA) [30] | 1 | 44 | WMD (IV, Fixed) | 0.100[-2.394,2.594] | 0.937 | ― | ― |
| Weight(kg) | 9 | 248 | WMD (IV, Fixed) | 0.365[-2.788,3.518] | 0.820 | 0.0 | 1.000 |
| Low dose (≤1.0 g/d DHA) [17,22,29] | 3 | 88 | WMD (IV, Fixed) | -0.081[-4.929,4.767] | 0.974 | 0.0 | 0.988 |
| High dose (>1.0 g/d DHA) [20,24,25,27,28,30] | 6 | 160 | WMD (IV, Fixed) | 0.693[-3.459,4.844] | 0.744 | 0.0 | 1.000 |
Notes: BMI, body mass index; FPG, fast plasma glucose; PPG, postprandial glucose; HbA1c, glycosylated hemoglobin; INS, insulin; TG, Triglyceride; TC, total cholesterol; WMD, weighted mean difference; IV, inverse variance; D+L, DerSimonian & Laird;-, not available.
Table 3. Omega-3 versus placebo (subgroups study duration).
| Overall effect | Heterogeneity | ||||||
|---|---|---|---|---|---|---|---|
| Outcome | No. of studies | No. of participants | Statistical method | Effect size[95%CI] | P | I2,% | P' |
| Glycemic control | |||||||
| FPG (mmol/L) | 19 | 1022 | WMD (IV, Fixed) | 0.190[-0.011,0.391] | 0.064 | 0.0 | 0.982 |
| Duration > 8 weeks [13,16,18–20,23,29] | 7 | 681 | WMD (IV, Fixed) | 0.190[-0.039,0.419] | 0.104 | 0.0 | 0.556 |
| Duration≤ 8 weeks [14,17,21,22,24–28,30–32] | 12 | 341 | WMD (IV, Fixed) | 0.191[-0.228,0.610] | 0.372 | 0.0 | 0.992 |
| PPG (mmol/L) | 3 | 62 | WMD (IV, Fixed) | -0.005[-1.712,1.702] | 0.995 | 33.9 | 0.220 |
| Duration > 8 weeks [19] | 1 | 16 | WMD (IV, Fixed) | -2.300[-5.555,0.955] | 0.166 | ― | ― |
| Duration≤8 weeks [21] | 2 | 46 | WMD (IV, Fixed) | 0.866[-1.139,2.870] | 0.397 | 0.0 | 0.531 |
| HbAc1 (%) | 17 | 1211 | WMD (D+L, Random) | -0.046[-0.204,0.112] | 0.568 | 38.5 | 0.054 |
| Duration >8 weeks [15,16,18–20,23,29] | 7 | 910 | WMD (D+L, Random) | 0.009[-0.061,0.079] | 0.799 | 0.0 | 0.988 |
| Duration≤8 weeks [14,17,21,22,24,25,28,30–32] | 10 | 301 | WMD (D+L, Random) | -0.081[-0.555,0.394] | 0.739 | 51.6 | 0.029 |
| INS (pmol/L) | 10 | 600 | WMD (D+L, Random) | -5.489[-14.882,3.905] | 0.252 | 38.4 | 0.102 |
| Duration >8 weeks [16,18,19,23] | 4 | 502 | WMD (D+L, Random) | -5.829[-15.011,3.354] | 0.213 | 18.5 | 0.298 |
| Duration≤8 weeks [22,24,26–28,31] | 6 | 98 | WMD (D+L, Random) | -8.948[-27.854,9.957] | 0.354 | 54.0 | 0.054 |
| Lipid parameters | |||||||
| TG (mmol/L) | 14 | 735 | WMD (IV, Fixed) | -0.240[-0.334,-0.147] | <0.001 | 0.0 | 0.812 |
| Duration >8 weeks [13,15,23,29] | 4 | 487 | WMD (IV, Fixed) | -0.249[-0.365,-0.133] | <0.001 | 11.2 | 0.337 |
| Duration≤8 weeks [17,21,22,24–27,30–32] | 10 | 248 | WMD (IV, Fixed) | -0.225[-0.382,-0.068] | 0.005 | 0.0 | 0.832 |
| TC (mmol/L) | 17 | 906 | WMD (IV, Fixed) | -0.019[-0.114,0.076] | 0.690 | 0.0 | 0.855 |
| Duration >8 weeks [13,15,16,20,23] | 6 | 577 | WMD (IV, Fixed) | -0.058[-0.172,0.057] | 0.326 | 0.0 | 0.671 |
| Duration≤8 weeks [14,17,21,22,24–27,31,32] | 11 | 329 | WMD (IV, Fixed) | 0.064[-0.106,0.234] | 0.459 | 0.0 | 0.841 |
| BMI (kg/m2) | 4 | 412 | WMD (IV, Fixed) | 0.060[-0.741,0.861] | 0.883 | 0.0 | 0.991 |
| Duration >8 weeks [15,23] | 2 | 348 | WMD (IV, Fixed) | 0.049[-0.861,0.959] | 0.916 | 0.0 | 0.744 |
| Duration≤8 weeks [30] [21] | 2 | 64 | WMD (IV, Fixed) | 0.100[-1.590,1.790] | 0.908 | 0.0 | 1.000 |
| Weight (kg) | 9 | 248 | WMD (IV, Fixed) | 0.365[-2.788,3.518] | 0.820 | 0.0 | 1.000 |
| Duration >8 weeks [20] [29] | 2 | 82 | WMD (IV, Fixed) | 0.527[-3.793,4.847] | 0.811 | 0.0 | 0.838 |
| Duration≤8 weeks [17,22,24,25,27,28,30] | 7 | 166 | WMD (IV, Fixed) | 0.181[-4.432,4.794] | 0.939 | 0.0 | 1.000 |
Notes: BMI, body mass index; FPG, fast plasma glucose; PPG, postprandial glucose; HbA1c, glycosylated hemoglobin; INS, insulin; TG, Triglyceride; TC, total cholesterol; WMD, weighted mean difference; IV, inverse variance; D+L, DerSimonian & Laird;-, not available.
Table 4 shows data from trials with high EPA/DHA ratio (EPA/DHA>1.5), intermediate ratio (1.4≤EPA/DHA≤1.5), and low ratio (EPA/DHA≤1.5). Similarly, TG levels were reduced significantly in these three subgroups with the more significant TG decrease in the high ratio subgroup (high ratio, -0.48 mmol/L, -0.736 to -0.230 mmol/L; intermediate ratio, -0.21 mmol/L, -0.384 to -0.033 mmol/L; low ratio, -0.20 mmol/L, -0.328 to -0.072 mmol/L). Additionally, a more obvious decreasing tendency was observed in HbAc1, INS, TC, and BMI measures within high ratio subgroup when compared to either low ratio or intermediate subgroups. Although no statistic significance was obtained, the downward trend of these measures was parallel to the increase of the ratios (Table 4).
Table 4. Omega-3 versus placebo (subgroups EPA/DHA).
| Overall effect | Heterogeneity | ||||||
|---|---|---|---|---|---|---|---|
| Outcome | No. of studies | No. of participants | Statistical method | Effect size[95%CI] | P | I2,% | P' |
| Glycemic control | |||||||
| FPG (mmol/L) | 17 | 990 | WMD (IV, Fixed) | 0.181[-0.022,0.385] | 0.081 | 0.0 | 0.964 |
| 1.4≤EPA/DHA≤1.5 [17,18,22,24,26–28,30,32] | 9 | 616 | WMD (IV, Fixed) | 0.103[-0.160,0.366] | 0.444 | 0.0 | 0.972 |
| EPA/DHA>1.5 [13,14,23,25,29] | 5 | 268 | WMD (IV, Fixed) | 0.386[-0.024,0.796] | 0.065 | 0.0 | 0.829 |
| EPA/DHA<1.4 [16,19,20] | 3 | 106 | WMD (IV, Fixed) | 0.157[-0.359,0.673] | 0.551 | 16.2 | 0.303 |
| PPG (mmol/L) | 2 | 42 | WMD (IV, Fixed) | -1.036[-3.280,1.208] | 0.366 | 9.5 | 0.293 |
| EPA/DHA>1.5 [25] | 1 | 26 | WMD (IV, Fixed) | 0.110[-2.988,3.208] | 0.945 | - | - |
| EPA/DHA<1.4 [19] | 1 | 16 | WMD (IV, Fixed) | -2.300[-5.555,0.955] | 0.166 | - | - |
| HbAc1 (%) | 15 | 1179 | WMD (D+L, Random) | -0.050[-0.219,0.119] | 0.565 | 45.7 | 0.028 |
| 1.4≤EPA/DHA≤1.5 [17,18,22,24,28,30,32] | 7 | 580 | WMD (D+L, Random) | 0.067[-0.130,0.264] | 0.503 | 0.0 | 0.779 |
| EPA/DHA>1.5 [14,23,25,29] | 4 | 167 | WMD (D+L, Random) | -0.277[-1.069,0.514] | 0.492 | 66.7 | 0.029 |
| EPA/DHA<1.4 [15,16,19,20] | 4 | 432 | WMD (D+L, Random) | 0.003[-0.071,0.077] | 0.938 | 0.0 | 0.939 |
| INS (pmol/L) | 9 | 588 | WMD (IV, Fixed) | -4.568[-10.943,1.807] | 0.160 | 2.8 | 0.411 |
| 1.4≤EPA/DHA≤1.5 [18,22,24,26–28] | 6 | 500 | WMD (IV, Fixed) | -6.642[-14.239,0.956] | 0.087 | 18.2 | 0.295 |
| EPA/DHA>1.5 [23] | 1 | 22 | WMD (IV, Fixed) | -1.700[-15.419,12.019] | 0.808 | - | - |
| EPA/DHA<1.4 [16,19] | 2 | 66 | WMD (IV, Fixed) | 5.947[-16.599,28.493] | 0.605 | 0.0 | 0.364 |
| Lipid parameters | |||||||
| TG (mmol/L) | 12 | 703 | WMD (IV, Fixed) | -0.243[-0.339,-0.147] | <0.001 | 0.0 | 0.912 |
| 1.4≤EPA/DHA≤1.5 [17,22,24,26,27,30,32] | 7 | 190 | WMD (IV, Fixed) | -0.209[-0.384,-0.033] | 0.020 | 0.0 | 0.986 |
| EPA/DHA>1.5 [13,23,25] | 4 | 187 | WMD (IV, Fixed) | -0.483[-0.736,-0.230] | <0.001 | 0.0 | 0.950 |
| EPA/DHA<1.4 [15] | 1 | 326 | WMD (IV, Fixed) | -0.200[-0.328,-0.072] | 0.002 | - | - |
| TC (mmol/L) | 15 | 874 | WMD (IV, Fixed) | -0.023[-0.120,0.073] | 0.635 | 0.0 | 0.831 |
| 1.4≤EPA/DHA≤1.5 [17,22,24,26,27,30,32] | 7 | 190 | WMD (IV, Fixed) | 0.116[-0.110,0.343] | 0.313 | 0.0 | 0.968 |
| EPA/DHA>1.5 [13,14,23,25,29] | 5 | 268 | WMD (IV, Fixed) | -0.141[-0.321,0.040] | 0.127 | 0.0 | 0.417 |
| EPA/DHA<1.4 [15,16,20] | 3 | 416 | WMD (IV, Fixed) | -0.008[-0.140,0.124] | 0.902 | 0.0 | 0.748 |
| BMI (kg/m2) | 3 | 392 | WMD (IV, Fixed) | 0.055[-0.800,0.909] | 0.900 | 0.0 | 0.947 |
| 1.4≤EPA/DHA≤1.5 [30] | 1 | 44 | WMD (IV, Fixed) | 0.100[-2.394,2.594] | 0.937 | - | - |
| EPA/DHA>1.5 [23] | 1 | 22 | WMD (IV, Fixed) | -0.400[-3.242,2.442] | 0.783 | - | - |
| EPA/DHA<1.4 [15] | 1 | 326 | WMD (IV, Fixed) | 0.100[-0.860,1.060] | 0.838 | - | - |
| Weight (kg) | 6 | 248 | WMD (IV, Fixed) | 0.365[-2.788,3.518] | 0.820 | 0.0 | 1.000 |
| 1.4≤EPA/DHA≤1.5 [17,22,24,27,28,30] | 2 | 140 | WMD (IV, Fixed) | -0.060[-5.243,5.123] | 0.982 | 0.0 | 1.000 |
| EPA/DHA>1.5 [25,29] | 1 | 68 | WMD (IV, Fixed) | 0.358[-4.777,5.493] | 0.891 | 0.0 | 0.867 |
| EPA/DHA< 1.4 [20] | 9 | 40 | WMD (IV, Fixed) | 1.000[-5.271,7.271] | 0.755 | - | - |
Notes: BMI, body mass index; FPG, fast plasma glucose; PPG, postprandial glucose; HbA1c, glycosylated hemoglobin; INS, insulin; TG, Triglyceride; TC, total cholesterol; WMD, weighted mean difference; IV, inverse variance; D+L, DerSimonian & Laird;-, not available.
To our surprise, FPG level was slightly elevated in Asians (0.42 mmol/L, 0.058 to 0.781 mmol/L, p = 0.023) but with no significant change in Western population (0.09 mmol/L, -0.154 to 0.330 mmol/L, p = 0.477). Due to the limitation in study number, pooled analysis failed to be performed for PPG parameter (Table 5). Moreover, Asians showed a more marked decrease in TG level when compared to subjects within US/European group. Non-significant results were found for other assessed biomarkers including plasma insulin, HbA1c, TC, BMI, and weight although ethnic population subgroups were analyzed (Table 5).
Table 5. Omega-3 versus placebo (subgroups Ethnicity).
| Overall effect | Heterogeneity | ||||||
|---|---|---|---|---|---|---|---|
| Outcome | No. of studies | No. of participants | Statistical method | Effect size[95%CI] | P | I2,% | P' |
| Glycemic control | |||||||
| FPG (mmol/L) | 19 | 1022 | WMD (IV, Fixed) | 0.190[-0.011,0.391] | 0.064 | 0.0 | 0.982 |
| US/European [17–28,30–32] | 15 | 752 | WMD (IV, Fixed) | 0.088[-0.154,0.330] | 0.477 | 0.0 | 0.993 |
| Asian [13,14,16,29] | 4 | 270 | WMD (IV, Fixed) | 0.419[0.058, 0.781] | 0.023 | 0.0 | 0.766 |
| PPG (mmol/L) | 3 | 62 | WMD (IV, Fixed) | -0.005[-1.712,1.702] | 0.995 | 33.9 | 0.220 |
| HbAc1 (%) | 17 | 1211 | WMD (D+L, Random) | -0.046[-0.204,0.112] | 0.568 | 38.5 | 0.054 |
| US/European [15,17–25,28,30–32] | 14 | 1038 | WMD (D+L, Random) | 0.037[-0.087,0.161] | 0.561 | 0.0 | 0.991 |
| Asian [14,16,29] | 3 | 173 | WMD (D+L, Random) | -0.287[-1.067,0.493] | 0.471 | 90.5 | 0.000 |
| INS (pmol/L) | 10 | 600 | WMD (D+L, Random) | -5.489[-14.882,3.905] | 0.252 | 38.4 | 0.102 |
| US/European [18,19,22–24,26–28,31] | 9 | 550 | WMD (D+L, Random) | -5.583[-15.887,4.722] | 0.288 | 45.2 | 0.067 |
| Asian [16] | 1 | 50 | WMD (D+L, Random) | -4.300[-35.879,27.279] | 0.790 | - | - |
| Lipid parameters | |||||||
| TG (mmol/L) | 14 | 735 | WMD (IV, Fixed) | -0.240[-0.334,-0.147] | <0.001 | 0.0 | 0.812 |
| US/European [15,17,21–27,30–32] | 12 | 596 | WMD (IV, Fixed) | -0.215[-0.313,-0.116] | <0.001 | 0.0 | 0.881 |
| Asian [13,29] | 2 | 139 | WMD (IV, Fixed) | -0.454[-0.739,-0.169] | 0.002 | 0.0 | 0.688 |
| TC (mmol/L) | 17 | 906 | WMD (IV, Fixed) | -0.019[-0.114,0.076] | 0.690 | 0.0 | 0.855 |
| US/European [15,17,20–27,30–32] | 13 | 636 | WMD (IV, Fixed) | 0.032[-0.081,0.146] | 0.578 | 0.0 | 0.915 |
| Asian [13,14,16,29] | 4 | 270 | WMD (IV, Fixed) | -0.139[-0.312,0.034] | 0.116 | 0.0 | 0.644 |
| BMI (kg/m2) | 4 | 412 | WMD (IV, Fixed) | 0.060[-0.741,0.861] | 0.883 | 0.0 | 0.991 |
| US/European [15,21,23,30] | 4 | 412 | WMD (IV, Fixed) | 0.060[-0.741,0.861] | 0.883 | 0.0 | 0.991 |
| Weight (kg) | 9 | 248 | WMD (IV, Fixed) | 0.365[-2.788,3.518] | 0.820 | 0.0 | 1.000 |
| US/European [17,20,22,24,25,27,28,30] | 8 | 206 | WMD (IV, Fixed) | 0.469[-3.247,4.184] | 0.805 | 0.0 | 1.000 |
| Asian [29] | 1 | 42 | WMD (IV, Fixed) | 0.100[-5.859,6.059] | 0.974 | 0.0 | - |
Notes: BMI, body mass index; FPG, fast plasma glucose; PPG, postprandial glucose; HbA1c, glycosylated hemoglobin; INS, insulin; TG, Triglyceride; TC, total cholesterol; WMD, weighted mean difference; IV, inverse variance; D+L, DerSimonian & Laird;-, not available.
Moderate degree of heterogeneity for HbA1c was observed in all subgroup analyses. Thus, we performed meta-regression analysis to explore the source of heterogeneity based on the following covariates: dose of EPA (p = 0.551) and DHA (p = 0.514), ratio of EPA/DHA (p = 0.421), trial duration (p = 0.415), and race (p = 0.134). The results revealed that no one significant factor was responsible; however, the race tended toward heterogeneity (p = 0.134).
Risk of bias and sensitivity analyses
No evidence of publication bias was observed in this meta-analysis (S2 Fig). The p-value for each clinical measure was 0.404 for FPG, 0.274 for PPG, 0.886 for HbA1c, 0.889 for INS, 0.102 for TG, 0.377 for TC, 0.424 for BMI, 0.159 for body weight. Sensitivity analyses were shown in S5 Table. The overall effect of omega-3 intervention remained unchanged for most markers (FFG, PPG, HbA1c, TG, TC, BMI, and Body Weight) when 1) quality score of included studies were three or more; or 2) included studies were parallel design; or 3) included studies were blinded; or 4) studies with large sample size were excluded [18]. This means that the combined results for clinical outcomes listed above were stable though the specified variables changed. The outcome of insulin levels was more sensitive to study design. Including only parallel group studies resulted in a significant decrease of fasting insulin.
Discussion
This meta-analysis pooled 20 RCTs of omega-3 supplementation with a total of 1209 T2DM patients to extend previous systematic reviews. It was found that, in the reviewed RCT studies, supplementation of omega-3 fatty acids presented a statistically significant TG decreasing effect. This effect was most remarkable in studies that gave a high dose of omega-3 and with a longer duration, which were in accordance with previous reviews [33,34]. However, omega-3 supplementation did not cause any significant change in TC, FPP, PPP, HbA1c, INS or BMI.
Interestingly, this study found that relatively high ratio of EPA/DHA contributed to a greater decreasing tendency in HbAc1, INS, TC, TG, and BMI measures. It is known that omega-3 (n-3) fatty acids include EPA, DHA, etc. Although no statistical significance was identified in these clinical outcomes (except TG), this meta-analysis study assumes the ratio and percentage of consumed mixed omega-3 fatty acids (in particular for the ratio of EPA/DHA) to be one important variable which influences the effects of omega 3 fatty acids on glucose homeostasis and lipid profiles.
Although no statistical significance but the decreasing trend identified in fasting insulin according to our analysis, animal studies supported the positive effect of omega 3 on the improvement of insulin sensitivity [38,39]. A more recent study by Molinar-Toribio et al reported that the relatively high ratio of EPA/DHA supplementation significantly decreased inflammation status and resultantly improved the insulin sensitivity in pre-diabetic rats [40], which is accordant with our speculations. The small sample size, limited study number, and short trial duration may contribute to the non-statistical effect. Additionally, there is no consensus on the optimal cutoff of the ratio of EPA/DHA. Amongst the included trials, the ratios ranged from 0.60 to 1.87 with the cut-off points 1.4 and 1.5 as the tertiles. An appropriate cut-off for this ratio is remained to be explored, which may be a helpful reference for dietary counseling: whether daily supplementation of omega-3 with high EPA/DHA ratio is necessary in T2DM patients.
Similarly, our findings from RCT trials suggest that omega-3 supplementation was unable to affect either plasma glucose levels or HbA1c except increased fasting glucose levels in Asians. Can these findings discourage the use of omega-3 in T2DM patients? Recent meta-analyses from observational studies obtained a positive conclusion that omega 3 could significantly reduce T2DM risk in Asians [12,41,42], which is contrary to our findings. The study duration may be one possible explanation for such discrepancy. Most of the included RCT trials were performed within 12 weeks, which is far shorter than those observational studies. The short duration of RCT trials may cause the null effect on glucose control. It is known that HbA1c represents an integrated measure of glycemic control over a period of approximately 12 weeks. The use of such measurements in studies of short duration may under-estimate any effects on glycemic control. Longer duration of RCT trials is required to obtain more reliable conclusion. Additionally, elevated FPG in Asians may be attributed to the included T2DM subjects in RCTs. The subjects recruited in observational studies were healthy individuals rather than diabetic patients. Thus, we assumed that early intervention with omega 3 in healthy population may be important; while the effect of omega 3 on glucose control may be decreased or eliminated when individuals have already developed to T2DM.
Our data may provide some dietary reference for clinicians or nutritionists who treat or manage patients with T2DM. The composition of mixed omega 3 fatty acids (especially the ratio of EPA/DHA) may affect their effect on glucose control and lipid levels. Additionally, early supplementation of omega 3 in healthy individuals may bring out more beneficial clinical outcomes.
Supporting Information
(TIF)
Bias was evaluated by Egger’s test with p-value<0.1 as significant bias. WMD, Weighted mean difference.
(TIF)
(XLSX)
(XLSX)
(XLSX)
(XLSX)
(XLSX)
(DOC)
Data Availability
All relevant data are within the paper and its Supporting Information files.
Funding Statement
This work was supported by a grant from National Natural Science Foundation of China (81100581 to S. Shao) and by a grant from China International Medical Foundation (CIMF) - novo nordisk China β Academy Funding (20110059 to S. Shao). S. Shao is in charge of these two grants.
References
- 1. American Diabetes A (2009) Diagnosis and classification of diabetes mellitus. Diabetes Care 32 Suppl 1: S62–67. 10.2337/dc09-S062 [DOI] [PMC free article] [PubMed] [Google Scholar]
- 2. Shaw JE, Sicree RA, Zimmet PZ (2010) Global estimates of the prevalence of diabetes for 2010 and 2030. Diabetes Res Clin Pract 87: 4–14. 10.1016/j.diabres.2009.10.007 [DOI] [PubMed] [Google Scholar]
- 3. Gubitosi-Klug RA, Group DER (2014) The diabetes control and complications trial/epidemiology of diabetes interventions and complications study at 30 years: summary and future directions. Diabetes Care 37: 44–49. 10.2337/dc13-2148 [DOI] [PMC free article] [PubMed] [Google Scholar]
- 4. Ley SH, Hamdy O, Mohan V, Hu FB (2014) Prevention and management of type 2 diabetes: dietary components and nutritional strategies. Lancet 383: 1999–2007. 10.1016/S0140-6736(14)60613-9 [DOI] [PMC free article] [PubMed] [Google Scholar]
- 5. American Diabetes A (2015) (4) Foundations of care: education, nutrition, physical activity, smoking cessation, psychosocial care, and immunization. Diabetes Care 38 Suppl: S20–30. 10.2337/dc15-S007 [DOI] [PubMed] [Google Scholar]
- 6. Sagild U, Littauer J, Jespersen CS, Andersen S (1966) Epidemiological studies in Greenland 1962–1964. I. Diabetes mellitus in Eskimos. Acta Med Scand 179: 29–39. [DOI] [PubMed] [Google Scholar]
- 7. Bang HO, Dyerberg J, Sinclair HM (1980) The composition of the Eskimo food in north western Greenland. Am J Clin Nutr 33: 2657–2661. [DOI] [PubMed] [Google Scholar]
- 8. Kromann N, Green A (1980) Epidemiological studies in the Upernavik district, Greenland. Incidence of some chronic diseases 1950–1974. Acta Med Scand 208: 401–406. [PubMed] [Google Scholar]
- 9. Patel PS, Forouhi NG, Kuijsten A, Schulze MB, van Woudenbergh GJ, Ardanaz E, et al. (2012) The prospective association between total and type of fish intake and type 2 diabetes in 8 European countries: EPIC-InterAct Study. Am J Clin Nutr 95: 1445–1453. 10.3945/ajcn.111.029314 [DOI] [PMC free article] [PubMed] [Google Scholar]
- 10. Zhou Y, Tian C, Jia C (2012) Association of fish and n-3 fatty acid intake with the risk of type 2 diabetes: a meta-analysis of prospective studies. Br J Nutr 108: 408–417. 10.1017/S0007114512002036 [DOI] [PubMed] [Google Scholar]
- 11. Li D (2015) Omega-3 polyunsaturated fatty acids and non-communicable diseases: meta-analysis based systematic review. Asia Pac J Clin Nutr 24: 10–15. 10.6133/apjcn.2015.24.1.21 [DOI] [PubMed] [Google Scholar]
- 12. Muley A, Muley P, Shah M (2014) ALA, fatty fish or marine n-3 fatty acids for preventing DM?: a systematic review and meta-analysis. Curr Diabetes Rev 10: 158–165. [DOI] [PubMed] [Google Scholar]
- 13. Wong CY, Yiu KH, Li SW, Lee S, Tam S, Lau CP, et al. (2010) Fish-oil supplement has neutral effects on vascular and metabolic function but improves renal function in patients with Type 2 diabetes mellitus. Diabet Med 27: 54–60. 10.1111/j.1464-5491.2009.02869.x [DOI] [PubMed] [Google Scholar]
- 14. Pooya S, Jalali MD, Jazayery AD, Saedisomeolia A, Eshraghian MR, Toorang F (2010) The efficacy of omega-3 fatty acid supplementation on plasma homocysteine and malondialdehyde levels of type 2 diabetic patients. Nutr Metab Cardiovasc Dis 20: 326–331. 10.1016/j.numecd.2009.04.002 [DOI] [PubMed] [Google Scholar]
- 15. Neil HA, Ceglarek U, Thiery J, Paul S, Farmer A, Holman RR (2010) Impact of atorvastatin and omega-3 ethyl esters 90 on plasma plant sterol concentrations and cholesterol synthesis in type 2 diabetes: a randomised placebo controlled factorial trial. Atherosclerosis 213: 512–517. 10.1016/j.atherosclerosis.2010.09.013 [DOI] [PubMed] [Google Scholar]
- 16. Shidfar F, Keshavarz A, Hosseyni S, Ameri A, Yarahmadi S (2008) Effects of omega-3 fatty acid supplements on serum lipids, apolipoproteins and malondialdehyde in type 2 diabetes patients. East Mediterr Health J 14: 305–313. [PubMed] [Google Scholar]
- 17. Kabir M, Skurnik G, Naour N, Pechtner V, Meugnier E, Rome S, et al. (2007) Treatment for 2 mo with n 3 polyunsaturated fatty acids reduces adiposity and some atherogenic factors but does not improve insulin sensitivity in women with type 2 diabetes: a randomized controlled study. Am J Clin Nutr 86: 1670–1679. [DOI] [PubMed] [Google Scholar]
- 18. Sirtori CR, Paoletti R, Mancini M, Crepaldi G, Manzato E, Rivellese A, et al. (1997) N-3 fatty acids do not lead to an increased diabetic risk in patients with hyperlipidemia and abnormal glucose tolerance. Italian Fish Oil Multicenter Study. Am J Clin Nutr 65: 1874–1881. [DOI] [PubMed] [Google Scholar]
- 19. Rivellese AA, Maffettone A, Iovine C, Di Marino L, Annuzzi G, Mancini M, et al. (1996) Long-term effects of fish oil on insulin resistance and plasma lipoproteins in NIDDM patients with hypertriglyceridemia. Diabetes Care 19: 1207–1213. [DOI] [PubMed] [Google Scholar]
- 20. Morgan WA, Raskin P, Rosenstock J (1995) A comparison of fish oil or corn oil supplements in hyperlipidemic subjects with NIDDM. Diabetes Care 18: 83–86. [DOI] [PubMed] [Google Scholar]
- 21. Pelikanova T, Kohout M, Valek J, Kazdova L, Base J (1993) Metabolic effects of omega-3 fatty acids in type 2 (non-insulin-dependent) diabetic patients. Ann N Y Acad Sci 683: 272–278. [DOI] [PubMed] [Google Scholar]
- 22. Luo J, Rizkalla SW, Vidal H, Oppert JM, Colas C, Boussairi A, et al. (1998) Moderate intake of n-3 fatty acids for 2 months has no detrimental effect on glucose metabolism and could ameliorate the lipid profile in type 2 diabetic men. Results of a controlled study. Diabetes Care 21: 717–724. [DOI] [PubMed] [Google Scholar]
- 23. McManus RM, Jumpson J, Finegood DT, Clandinin MT, Ryan EA (1996) A comparison of the effects of n-3 fatty acids from linseed oil and fish oil in well-controlled type II diabetes. Diabetes Care 19: 463–467. [DOI] [PubMed] [Google Scholar]
- 24. Puhakainen I, Ahola I, Yki-Jarvinen H (1995) Dietary supplementation with n-3 fatty acids increases gluconeogenesis from glycerol but not hepatic glucose production in patients with non-insulin-dependent diabetes mellitus. Am J Clin Nutr 61: 121–126. [DOI] [PubMed] [Google Scholar]
- 25. Schectman G, Kaul S, Kissebah AH (1988) Effect of fish oil concentrate on lipoprotein composition in NIDDM. Diabetes 37: 1567–1573. [DOI] [PubMed] [Google Scholar]
- 26. Annuzzi G, Rivellese A, Capaldo B, Di Marino L, Iovine C, Marotta G, et al. (1991) A controlled study on the effects of n-3 fatty acids on lipid and glucose metabolism in non-insulin-dependent diabetic patients. Atherosclerosis 87: 65–73. [DOI] [PubMed] [Google Scholar]
- 27. Borkman M, Chisholm DJ, Furler SM, Storlien LH, Kraegen EW, Simons LA, et al. (1989) Effects of fish oil supplementation on glucose and lipid metabolism in NIDDM. Diabetes 38: 1314–1319. [DOI] [PubMed] [Google Scholar]
- 28. Glauber H, Wallace P, Griver K, Brechtel G (1988) Adverse metabolic effect of omega-3 fatty acids in non-insulin-dependent diabetes mellitus. Ann Intern Med 108: 663–668. [DOI] [PubMed] [Google Scholar]
- 29. Okuda Y, Mizutani M, Ogawa M, Sone H, Asano M, Asakura Y, et al. (1996) Long-term effects of eicosapentaenoic acid on diabetic peripheral neuropathy and serum lipids in patients with type II diabetes mellitus. J Diabetes Complications 10: 280–287. [DOI] [PubMed] [Google Scholar]
- 30. Kasim SE, Stern B, Khilnani S, McLin P, Baciorowski S, Jen KL (1988) Effects of omega-3 fish oils on lipid metabolism, glycemic control, and blood pressure in type II diabetic patients. J Clin Endocrinol Metab 67: 1–5. [DOI] [PubMed] [Google Scholar]
- 31. Popp-Snijders C, Schouten JA, Heine RJ, van der Meer J, van der Veen EA (1987) Dietary supplementation of omega-3 polyunsaturated fatty acids improves insulin sensitivity in non-insulin-dependent diabetes. Diabetes Res 4: 141–147. [PubMed] [Google Scholar]
- 32. McVeigh GE, Brennan GM, Johnston GD, McDermott BJ, McGrath LT, Henry WR, et al. (1993) Dietary fish oil augments nitric oxide production or release in patients with type 2 (non-insulin-dependent) diabetes mellitus. Diabetologia 36: 33–38. [DOI] [PubMed] [Google Scholar]
- 33. Montori VM, Farmer A, Wollan PC, Dinneen SF (2000) Fish oil supplementation in type 2 diabetes: a quantitative systematic review. Diabetes Care 23: 1407–1415. [DOI] [PubMed] [Google Scholar]
- 34. Hartweg J, Farmer AJ, Holman RR, Neil A (2009) Potential impact of omega-3 treatment on cardiovascular disease in type 2 diabetes. Curr Opin Lipidol 20: 30–38. [DOI] [PubMed] [Google Scholar]
- 35. Jadad AR, Moore RA, Carroll D, Jenkinson C, Reynolds DJ, Gavaghan DJ, et al. (1996) Assessing the quality of reports of randomized clinical trials: is blinding necessary? Control Clin Trials 17: 1–12. [DOI] [PubMed] [Google Scholar]
- 36.Schulz KF, Chalmers I, Altman DG, Grimes DA, Dore CJ (1995) The methodologic quality of randomization as assessed from reports of trials in specialist and general medical journals. Online J Curr Clin Trials Doc No 197: [81 paragraphs]. [PubMed]
- 37. Egger M, Davey Smith G, Schneider M, Minder C (1997) Bias in meta-analysis detected by a simple, graphical test. BMJ 315: 629–634. [DOI] [PMC free article] [PubMed] [Google Scholar]
- 38. Yan Y, Jiang W, Spinetti T, Tardivel A, Castillo R, Bourquin C, et al. (2013) Omega-3 fatty acids prevent inflammation and metabolic disorder through inhibition of NLRP3 inflammasome activation. Immunity 38: 1154–1163. 10.1016/j.immuni.2013.05.015 [DOI] [PubMed] [Google Scholar]
- 39. Gonzalez-Periz A, Horrillo R, Ferre N, Gronert K, Dong B, Morán-Salvador E, et al. (2009) Obesity-induced insulin resistance and hepatic steatosis are alleviated by omega-3 fatty acids: a role for resolvins and protectins. FASEB J 23: 1946–1957. 10.1096/fj.08-125674 [DOI] [PMC free article] [PubMed] [Google Scholar]
- 40. Molinar-Toribio E, Perez-Jimenez J, Ramos-Romero S, Romeu M, Giralt M, Taltavull N, et al. (2015) Effect of n-3 PUFA supplementation at different EPA:DHA ratios on the spontaneously hypertensive obese rat model of the metabolic syndrome. Br J Nutr 113: 878–887. 10.1017/S0007114514004437 [DOI] [PubMed] [Google Scholar]
- 41. Zheng JS, Huang T, Yang J, Fu YQ, Li D (2012) Marine N-3 polyunsaturated fatty acids are inversely associated with risk of type 2 diabetes in Asians: a systematic review and meta-analysis. PLoS One 7: e44525 10.1371/journal.pone.0044525 [DOI] [PMC free article] [PubMed] [Google Scholar]
- 42. Wallin A, Di Giuseppe D, Orsini N, Patel PS, Forouhi NG, Wolk A (2012) Fish consumption, dietary long-chain n-3 fatty acids, and risk of type 2 diabetes: systematic review and meta-analysis of prospective studies. Diabetes Care 35: 918–929. 10.2337/dc11-1631 [DOI] [PMC free article] [PubMed] [Google Scholar]
Associated Data
This section collects any data citations, data availability statements, or supplementary materials included in this article.
Supplementary Materials
(TIF)
Bias was evaluated by Egger’s test with p-value<0.1 as significant bias. WMD, Weighted mean difference.
(TIF)
(XLSX)
(XLSX)
(XLSX)
(XLSX)
(XLSX)
(DOC)
Data Availability Statement
All relevant data are within the paper and its Supporting Information files.