Abstract
During B cell development, RAG endonuclease cleaves immunoglobulin heavy chain (IgH) V, D, and J gene segments and orchestrates their fusion as deletional events that assemble a V(D)J exon in the same transcriptional orientation as adjacent Cμ constant region exons1,2. In mice, six additional sets of constant region exons (CHs) lie 100-200 kb downstream in the same transcriptional orientation as V(D)J and Cμ exons2. Long repetitive switch (S) regions precede Cμ and downstream CHs. In mature B cells, class switch recombination (CSR) generates different antibody classes by replacing Cμ with a downstream CH2. Activation-Induced Cytidine Deaminase (AID) initiates CSR by promoting deamination lesions within Sμ and a downstream acceptor S region2,3; these lesions are converted into DNA double-strand breaks (DSBs) by general DNA repair factors3. Productive CSR must occur in a deletional orientation by joining the upstream end of an Sμ DSB to the downstream end of an acceptor S region DSB (Fig. 1a). However, the relative frequency of deletional to inversional CSR junctions had not been measured. Thus, whether orientation-specific joining is a programmed mechanistic feature of CSR as it is for V(D)J recombination and, if so, how this is achieved was unknown. To address this question, we adapted high-throughput genome-wide translocation sequencing (HTGTS)4 into a highly sensitive DSB end-joining assay and applied it to endogenous AID-initiated S region DSBs. We find that CSR indeed is programmed to occur in a productive deletional orientation and does so via an unprecedented mechanism that involves in cis IgH organizational features in combination with frequent S region DSBs initiated by AID. We further implicate ATM-dependent DSB response (DSBR) factors in enforcing this mechanism and provide a solution to the enigma of why CSR is so reliant on the 53BP1 DSBR factor.
Most chromosomal DSB ends join to ends of separate DSBs genome-wide without orientation (end) specificity4,5. In this regard, non-productive “inversional” CSR joins were found in transformed B cells6-9, suggesting CSR may not be orientation-restricted10 (Fig. 1a). To address this possibility, we employed digestion-circularization PCR (DC-PCR, Extended Data Fig. 1a) to identify orientation of CSR joins between Sμ and Sγ1 in purified mouse B cells stimulated with αCD40 plus IL4 to activate AID-targeting to Sγ1 and Sε, and class-switching to IgG1 (and IgE). Most Sμ to Sγ1 junctions identified by this semi-quantitative approach were deletional (Extended Data Fig.1b).
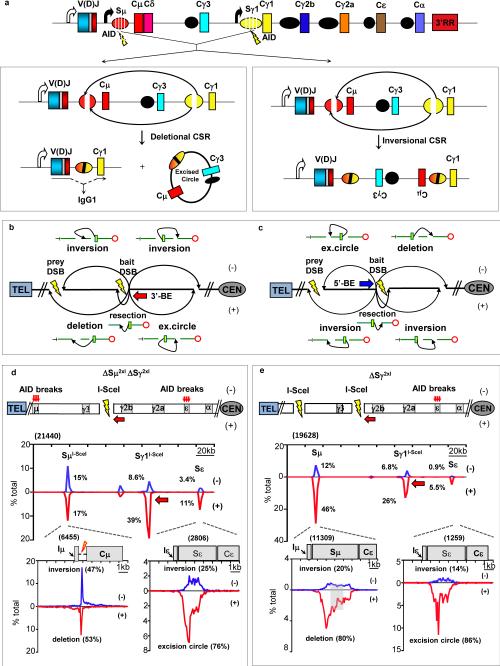
Figure 1. S region-dependent orientation-biased joining in CSR-stimulated B cells.
(a) Upper: IgH CH locus with AID-targeting (bolts) in Sμ and Sγ1. Lower: Productive (left) CSR via deletional Sμ to Sγ1 joins plus excision circles; Inversional (right) CSR. (b, c). Joining outcomes from 3’ (red arrow) or 5’ (blue arrow) bait BEs (bolts/gaps) to prey BEs5. (d) Upper: Joining between I-SceI DSBs at Sγ1 and Sμ in ΔSγ12xIΔSμ2xI B cells12. Middle: Location of bait BE junctions to I-SceI-generated ΔSμ2xI or AID-initiated Sε prey BEs in either + (red) or - (blue) orientation (five experiments) as percentage of total IgH junctions (2 kb) bins. Lower: Junction distribution to 10 kb region encompassing I-Sce1 prey DSBs at Sμ and AID-initiated prey DSBs at Sε. (e) Results from Sγ12xI/WT B cells12 plotted as in (d). Grey box indicates prey junctions not assignable to single core-Sμ sequence. Numbers in parenthesis denote total unique junctions. Statistical analyses in Extended Data Fig. 2h,j.
To confirm DC-PCR findings and analyze potential mechanisms, we used HTGTS, an unbiased genome-wide approach that identifies “prey” DSB junctions to a fixed “bait” DSB with nucleotide resolution4,5 (Extended Data Fig. 1c). We refer to broken ends (“BEs”) of bait IgH DSBs as 5′-BEs and 3′-BEs, respectively; specific primers allow use of each as bait4 (Fig. 1b,c). Prey junctions are denoted + if prey is read from the junction in a centromere-to-telomere direction and - if in the opposite direction4 (Fig. 1b,c). The + and - outcomes for intra-chromosomal joining of BEs of different DSBs on the same chromosome include rejoining of a DSB subsequent to resection, or joining BEs of two separate DSBs to form intra-chromosomal inversions, deletions, or excision circles4,5 (Fig. 1b,c). To assess relative frequency at which non-AID-initiated IgH DSBs join in deletional versus inversional orientation, we expressed I-SceI endonuclease in αCD40/IL-4-activated, AID-deficient B cells in which I-SceI targets were inserted upstream of Sμ and downstream of Sγ1 (“IgHI-96k” allele11; Extended Data Fig. 1d,e), or in AID-sufficient B cells in which Sγ1 and Sμ were replaced with I-SceI targets (ΔSμ2xI/ΔSγ12xI allele12; Fig. 1d; Extended Data Fig.1f). HTGTS with primers that, respectively, captured junctions involving 3′BEs or 5′BEs of Sγ1 locale bait I-SceI-generated DSBs revealed that a major class of recovered junctions were re-joins of bait DSBs following resection (Fig. 1d; Extended Data Fig. 1d-f). A second major class of Sγ1 locale bait junctions involved intact or resected 5′BEs or 3′BEs of Sμ locale I-SceI-generated DSBs, which comprised relatively similar numbers of deletional (+) and inversional (-) junctions for bait 3′BEs (Fig. 1d; Extended Data Fig. 1d) and similar numbers of excision circle (-) versus inversional (+) junctions for bait 5′BEs (Extended Data Fig. 1e,f). As expected4, bait 3′BEs and 5′BEs from the Sγ1 locale recovered similar levels of + and - junctions genome-wide (Extended Data Fig. 2a-d). We conclude that joining between two I-SceI DSBs in different IgH S region locations in CSR-activated B cells lacks marked preference for or against inversional versus deletional joins.
In AID-deficient IgHI-96k B cells, I-SceI 5′ and 3′ BE baits downstream of Sγ1 did not capture IgH DSB hotspots beyond I-SceI-generated BEs upstream of Sμ (Extended Data Fig. 1d,e). In contrast, I-SceI 5′ and 3′BEs from the ΔSμ2xI/ΔSγ12xI allele in AID-sufficient B cells joined frequently to AID-initiated Sε DSBs 60 kb downstream (Fig. 1d, Extended Data Fig. 1f), with the majority (~80%) of 3′ and 5′ ΔSμ2xI/ΔSγ12xI BE joins distributed across the 4 kb Sε in orientations that generate, respectively, excision circles (Fig. 1d) or deletions (Extended Data Fig. 1f). We also performed HTGTS on activated, I-SceI-expressing B cells in which only Sγ1 was replaced by an I-SceI cassette (ΔSγ12xI allele12; Fig. 1e). Beyond break-site junctions, major IgH hotspot regions of 3′ ΔSγ12xI-BEs were Sμ and Sε (Fig. 1e; Extended Data Fig. 2j). Junctions occurred broadly across Sμ with 80% in deletional orientation; while 90% of Sε junctions were in the reciprocal excision circle orientation (Fig. 1e; Extended Data Fig. 2j). CH12F3 B lymphoma cells in which Sα was replaced with an I-Sce1 site had a similar orientation bias of Sα I-SceI 3′BE joining to Sμ DSBs (Extended Data Fig. 2n-q). Joining of the 5′BEs of ΔSμ2xI (on the ΔSμ2xI/ΔSγ12xI allele) to AID-initiated DSBs in Sγ3, Sγ2b and Sγ2a in LPS plus αIgD-dextran-activated B cells were similarly orientation-biased (Extended Data Fig. 3a-c). However, joining of the 5′BEs of ΔSμ2xI across an array a 28xI-SceI sites replacing Sγ113 was not orientation-biased (Extended Data Fig. 3d,e). Together, these findings suggest that orientation-specific CSR joining requires an S region sequence and/or unique aspects of S region DSBs.
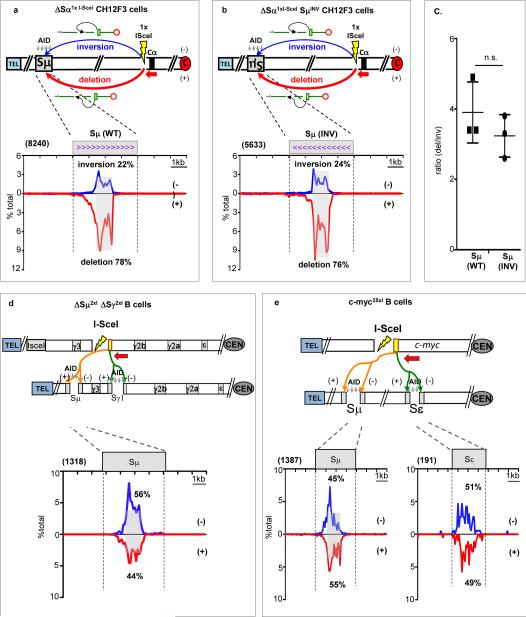
Mammalian S regions are G-rich on the non-template strand, giving AID-initiated 5′ and 3′ S region BEs a potential end-sequence bias. Also, when transcribed in “sense” direction, S regions generate stable R-loops14,15, which could differentially affect 5′ and 3′ S region BE structure. To test potential roles of S regions in orientation-specific CSR, we used a Cas9/gRNA approach to invert Sμ on the productiveallele of CH12F3 B cells--which modestly reduced CSR (Extended Data Fig. 3f-h). We then assayed CH12F3 cells in which Sα was replaced with an I-SceI site and Sμ was in normal or inverted orientation. These assays revealed that joins of I-SceI-generated 3′BEs at the Sα locale to Sμ DSBs were similarly biased for deletional junctions independent of Sμ orientation (Fig.2a-c). Consistent with low-level trans CSR16, HTGTS libraries from activated ΔSμ2xI/ΔSγ12xI B cells contained numerous junctions from ΔSγ12xI 3’-BEs across the trans Sμ; which, in contrast to cis ΔSγ12xI 3’-BE Sμ junctions, occurred in + and - orientations at similar frequency (Fig. 2d). Likewise, bait 3′BEs from the ΔSγ12xI Igh allele identified approximately equal numbers of (+) versus (-) junctions to AID off-target DSBs in Il4ra on chr 7 (Extended Data Fig. 2e). Finally, translocations between bait 5′ I-SceI DSB BEs in c-myc4 and prey AID-initiated Sμ and Sε BEs in CSR-activated B cells lacked orientation bias (Fig. 2e). We conclude that orientation-dependent CSR joining does not require orientation-associated features of Sμ sequence, transcription, or transcripts. Moreover, AID-initiated DSBs per se are not sufficient to promote orientation-specificity, as demonstrated by orientation-independence of DSB joining to them in trans. Thus, beyond S region sequences and/or high frequency AID-initiated DSBs within them, aspects of IgH locus organization in cis must play a critical role in promoting orientation-dependent CSR joining.
Figure 2. S regions are not sufficient to promote orientation-biased CSR joining.
(a) and (b) Upper: HTGTS in CSR-activated CH12F3 cells for joining between 3′ BEs of I-SceI DSB in cassette replacing Sα and AID-initiated Sμ DSBs in which Sμ is in normal (a) or inverted (b) orientation. Lower: Junctions from I-SceI DSB 3′BEs to normal (left) or inverted (right) Sμ plotted as in Fig. 1d. (c) Bar graphs show ratio (average ± s.d.) of + (deletional) and - (inversional) joins (n=3), with significance calculated by unpaired two-tailed t-test (p=0.307). (d) Upper: HTGTS junctions from ΔSγ12xI-3’BEs to AID-induced Sμ BEs on trans chromosome in + (red) and (-) orientations in activated ΔSγ12xIΔSμ2xI cells. Lower: Distribution of junctions in 10 kb trans-Sμ (n=5). (e) Joining of bait I-SceI 5’BEs of c-myc25x-IsceI cassette4 on chr 15 and AID-induced Sμ and Sε IgH breaks in (+) or (-) orientation as in Fig.1d. Lower: linear distribution of junctions in Sμ(left) or Sε(right) (n=4). Statistical analysis in Extended Data Fig. 2k-m.
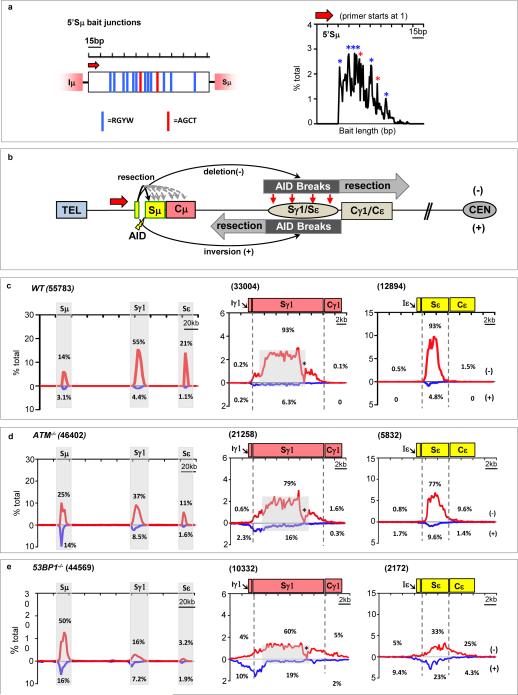
We tested whether joining between two sets of endogenous AID-initiated S region DSBs is orientation-dependent. Use of core S regions DSBs as HTGTS bait is confounded by their highly repetitive nature. Therefore, we used as bait a 150 bp sequence at the 5′ end of Sμ (“5′Sμ”), which retains 14 of approximately 500 Sμ AID target motifs (Fig. 3a, left panel). HTGTS of αCD40/IL4-stimulated B cells with the 5′Sμ BE primer revealed break-site junctions, as well as Sγ1 and Sε junctions (Fig. 3b,c). Consistent with AID-initiation, bait junctions were enriched at AID-targets within the 5′Sμ bait (Fig. 3a, right panel). 5′Sμ BE junctions spread broadly over prey S regions, with up to 95% in deletional orientation (Fig. 3c). For comparison, we tested a 150-bp 5′ remnant of Sμ (“rSμ”; Extended Data Fig. 4a, left panel), retained when the rest of Sμ was deleted17. B cells homozygous for rSμ have reduced IgG1 CSR but nearly normal IgE CSR18. HTGTS with either 5′-rSμ or 3′-rSμ BE primers of αCD40/IL4- and LPS/αIgD dextran-stimulated B cells, respectively, revealed junctions to Sγ1 and Sε and to Sγ3, Sγ2b, and Sγ2a (Extended Data Fig. 4). 5′ rSμ BE junctions spread over target S regions, with >90% in deletional orientation (Extended Data Fig. 4b,f); while >90% of 3′ rSμ BEs junctions were in the complementary excision circle orientation (Extended Data Fig. 4c,g). Within the bait rSμ, junctions again were enriched at AID targets (Extended Data Fig. 4a). Consistent with IgH class-switching patterns, rSμ HTGTS junctions occurred more frequently to Sε than those from the 5′Sμ bait in the context of full-length Sμ (Extended Data Fig.4b). Analyses of rSμ−mutant CH12F3 cells gave similar results (Extended Data Fig. 5a-c). Thus, AID-initiated Sμ DSB joining to all downstream acceptor S regions is strongly biased towards deletional orientation.
Figure 3. Orientation-biased joining of AID-initiated endogenous S region breaks.
(a) Left: 150-bp 5′Sμ sequence used as HTGTS bait. Red arrow denotes 5′Sμ primer. Red and blue vertical lines indicate AGCT or other AID-targeting motifs, respectively. Right panels: Distribution and frequency of 5’Sμ breakpoints in junctions to downstream S regions recovered from αCD40/IL-4-stimulated WT B cells. Asterisks indicate position of AGCT or other RGYW motifs. (b) Junctional outcomes from 5′Sμ AID-initiated BE junctions to AID-initiated DSBs in Sγ1 and Sε including deletions (-) or inversions (+); long resections indicated by grey arrows. Break-site 5′Sμ resections also are depicted. (c-e) Linear distribution of pooled junctions along 200 kb CH locus (left) or at Sγ1 and Sε (middle and right) recovered from three independent experiments with αCD40/IL4-stimulated WT (c), ATM-/- (d) or 53BP1-/- (e) B cells. Grey boxes indicate repetitive sequences with junctions mapping to multiple locations in Sγ1; asterisk indicates G-rich Sγ1 region devoid of AID motifs and junctions.
CSR DSBs generate a DSB response (DSBR) in which ATM activates histone H2AX and 53BP1 in chromatin flanking DSBs, thereby contributing to end-joining19-21. ATM- or H2AX-deficiency moderately reduces CSR (Extended Data Fig. 6a)2,19. However, 53BP1-deficiency causes a more drastic reduction (Extended Data Fig. 6a), suggesting specialized CSR roles2,19,22,, such as promoting S region synapsis or protecting S region DSBs from resection11,23-25. To elucidate influences on orientation-specific CSR, we employed HTGTS to assay joining of AID-initiated 5′Sμ BEs to AID-initiated Sγ1 and Sε DSBs in αCD40/IL-4-activated ATM-, H2AX-, and 53BP1-deficient B cells, as well as in B cells deficient for Rif-1, a 53BP1-associated factor that mediates resection-blocking26,27. ATM-, H2AX-, and Rif1-deficient B cells had reduced Sγ1 and Sε junctions compared to WT; 53BP1-deficient B cells had a greater reduction, with most localizing to the break-site region (Fig. 3d,e; Extended Data Fig. 6b-d). Most break-site junctions were resections, which were longest (up to about 6 kb) for 53BP1-deficiency (Extended Data Fig. 6e,f; discussion in Extended Data Fig. 6f legend). Compared to WT, bait 5′Sμ junctions to Sγ1 and Sε DSBs in different DSBR-deficient backgrounds had varying decreases in orientation-specificity, with H2AX-deficiency having the smallest and 53BP1-deficiency the largest (Fig. 3d,e; Extended Data Fig. 6c,d; Fig. 4a; Extended Data Table 1a,b). Indeed, residual junctions of 5′Sμ to Sγ1 and Sε locales in 53BP1-deficient B cells showed relatively normalized inversion/deletion ratios (Fig.4a), a finding confirmed by DC-PCR (Extended Data Fig. 1b). Finally, 53BP1-deficiency did not impact joining orientation of 5′Sμ and 3′Sγ1 I-SceI-generated BEs in AID-deficient IgHI-96k B cells (Extended Data Fig. 1g).
Figure 4. Mechanisitic roles of IgH organization and DSBR factors in deletional CSR.
(a) Ratios of inversional to deletional 5’Sμ joins to Sγ1 (left) or Sε (right) in wild-type and mutant cells. Average ± s.d. calculated from at least three separate experiments. (b) Sγ1 and Sε resection junctions mapping to (-) deletional resection region beyond where WT junctions descend to background plotted as percent of total junctions in deletional orientation from cells in (a). For panels a-b, more than 1000 unique junctions (up to tens of thousands in some cases) were analyzed. Statistical significance or insignificance of key comparative results calculated by unpaired two-tailed t-test from at least three biological repeats (Extended Data Table 1). (c) Working model for orientation-biased joining and (d) functions of DSBR proteins in maintaining directional CSR (details in text).
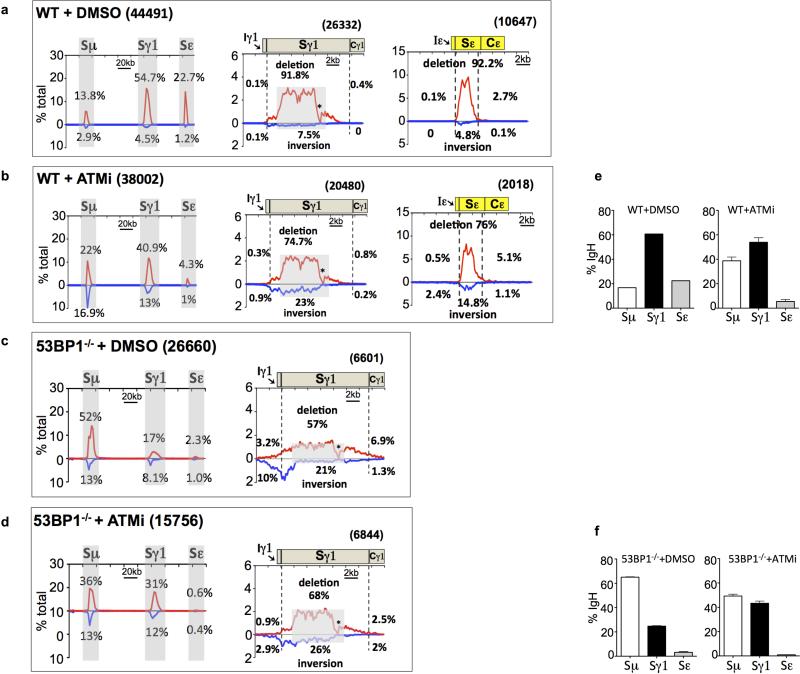
Due to potential difficulty in measuring relative resection of recurrent re-joins at or near the break-site, we focused on prey S region BE resections (Extended Data Figs. 1 and 6 legends). Because S regions are long and AID-initiated DSB locations within them are diverse, we estimated relative resection by quantifying bait BE to prey BE junctions downstream of S region positions where WT junctions descend to background (Fig. 3b-e). Based on this “long” S region resection assay, ATM- and H2AX-deficient cells had modest resection increases, Rif1-deficient cells slightly greater increases, and 53BP1-deficient B cells far greater increases that were also apparent as a “flattening” of Sγ1 and Sε junction profiles relative to other backgrounds (Fig. 3c-e; Extended Data Fig. 6c,d; Fig. 4b; Extended Data Table 1c,d). HTGTS assays of rSμ bait BE junctions to Sγ1 and Sε (Extended Data Fig. 7) and I-SceI-generated 3’ΔSγ12xI- BE bait junctions to Sμ and Sε (Extended Data Fig. 8) gave similar results. In H2AX- or Rif1-deficient B cells, a large fraction of 5′Sμ junctions were within S regions, with the main difference from WT being a subset of junctions extending beyond S regions, likely reflecting extensive resection of BEs not rapidly fused (Extended Data Fig. 6c,d; Fig. 4b). Treatment of 53BP1-deficient activated B cells with ATM kinase inhibitor substantially diminished very long S region resections, but did not alter orientation-dependent joining (Fig.4a,b; Extended Data Table 1; Extended Data Fig. 9a-f). This finding may reflect shorter resections in inhibitor-treated 53BP1-deficient versus ATM-deficient B cells that are not revealed by our long resection assay. Another possibility would involve putative specialized 53BP1 roles in stabilizing synapsed S regions23.
We demonstrate that CSR is mechanistically programmed to occur in a productive, deletional orientation. Based on our findings, we propose a working model for orientation-specific CSR, in which a key component is the organization of S regions within topologically-associated domains (“TADs”) that promote their frequent S synapsis2,12,13 via Langevin motion2,13,28 (Fig. 4c) Within such TADs, we implicate additional IgH-specific organizational features, not yet fully elucidated, in playing a fundamental role in mediating synapsis in an orientation that promotes deletional joining (Fig.4c). We find that functions of such organizational features are complemented by S regions, potentially associated with their ability to promote either AID-initiated DSBs, multiple frequent DSBs, or both. Our studies also implicate DSBR factors in enforcing this mechanism (Fig. 4d). The broader DSBR likely contributes by tethering un-synapsed S region DSBs for efficient re-joining, keeping them from separating into chromosomal breaks that could frequently translocate with orientation-independence to S region BEs within the TAD2,20; this function would also allow subsequent AID-initiated breakage and joining to a synapsed S region (Fig. 4c). DSBR factors also prevent long end-resections that could cause S region BEs to linger in resection complexes, preventing synapsis with other S region BEs and/or diminishing ability to be joined by C-NHEJ (Fig. 4d). Different DSBR factors have differential impact in tethering versus resection-inhibition and, thus, may impact orientation-dependence via different routes. For example, ATM deficiency inhibits resection by impairing CtIP activation29, but promotes resection via other nucleases by impairing inhibitory activities of H2AX, 53BP1 and, indirectly, Rif126,27 (Fig. 4d). 53BP1-deficiency is unique in that it both impairs tethering for rejoining and activates resection of un-joined ends by failure to activate Rif1, leading to extreme resections and the greatest impairment of CSR and orientation-dependent joining (Fig. 4d). As common and unique impacts of 53BP1-deficiency markedly affect both donor and acceptor S regions, they would be multiplicative and, thereby, explain the profound impact of 53BP1-deficiency on CSR.
METHODS
Mice
IgHI-96k AID-/- (11), ΔSμ2xI/ΔSγ12xI chimera12, ΔSγ12xI-SceI (12), SμΔ/Δ (17), c-myc25xI-SceI (4), ATM-/- (30), H2AX-/- (31), 53BP1-/- (32), Rif1f/fCD19Cre (33) lines have been reported previously. Mouse work was performed under protocols approved by the Boston Children's Hospital and the Rockefeller University Institutional Animal Care and Use Committees.
Plasmids and oligos
Oligonucleotides for gRNAs for CRISPR/Cas9-mediated targeting of various IgH regions have been cloned into pX330 vector (Addgene plasmid ID 42230) as described36. The target sequences of Cas9 constructs are listed in DNA oligos table in Supplementary Information. Exchange vector (pLH28) with heterologous loxP sites was obtained from Dr. Kefei Yu. A 200-bp GFP-derived sequence was amplified and ligated to I-SceI recognition sequence and subsequently introduced into the pLH28 vector to make the pLH-1x I-Sce1 exchange vector. To obtain the I-SceI expression plasmid for transducing CH12 cell lines, I-SceI-IRES-GFP fragment was shuttled from a retroviral construct (pMX-ISce1-IRES-GFP) into pCDNA3.0 (Invitrogen) vector.
B cell culture, transduction and FACS analysis
Mature splenic B cells isolated by using CD43-negative selection kit (MACS), were cultured in lymphocyte medium R15 (RPMI1640, 15% FBS, L-glutamate, 1x penicillin and streptomycin). B cell stimulation was performed with anti-CD40 (1 μg/ml, eBioscience) plus IL4 (20 ng/ml, PeproTech) or LPS (25 ng/ml, Sigma) plus anti-IgD-dextran (3 ng/ml, a kind gift from R. Casellas) for 96 hr. Infection with I-SceI expression or control retrovirus was carried out at day one post-stimulation by the standard spinning method with the presence of 4 μg/ml polybrene as previously described13. Efficiency of retrovirus infection and switching levels were evaluated by flow cytometry as previously described13. Where indicated, ATM inhibitor KU-55933 (Tocris) was added to stimulated cells at day one post-stimulation to a final concentration of 10 μM and was maintained during the course of the experiment until harvesting of the cells for FACS and HTGTS libraries.
Cell lines and nucleofection
CH12F3 cell line stimulation to IgA was done as described34. CH12F3 cells with Recombinase Mediated Cassette Exchange (RMCE) in place of endogenous Sα region, referred as 1F7 cells34 were maintained at 37°C, 5% CO2 and cultured in RPMI media with 10% FCS, 0.5% penicillin/streptomycin, 50 μM β-mercaptoethanol. Exchange vector with heterologous loxP sites containing 1x I-Sce1 site embedded in 200 bp of GFP-derived sequence was cloned. RMCE was performed as previously described34. Exchanged ΔSα1xI clones were verified by PCR, Sanger sequencing and Southern blotting. ΔSα1xI cells were then stimulated with anti-CD40, IL4 and TGF-β for 15 hr followed by nucleofection with pcDNA-ISce1-IRES-GFP expression vector using 4D-nucleofector X (Lonza, solution SF, protocol CA-137) and replated in stimulation-conditioned media. On day 3 post-stimulation cells were harvested and genomic DNA was isolated for HTGTS library preparation.
To obtain CH12F3 (productive allele Sμ (INV)/non-productive allele ΔSμ-Sα) cells, wild-type CH12F3 cells were first nucleofected using the 4D-nucleofector X (Lonza, solution P3, protocol CA-137) with the gRNA vectors to excise the sequences between JH4 intron and ~130 bp downstream of Cα polyadenylation on the non-coding allele that has already switched to Sα. Single cell subclones were seeded into 96-well plates 12 hr post-nucleofection, and the resulting clones were screened by PCR and Southern blot. One confirmed positive clone was further modified by gRNA vectors targeted at 5’Sμ_1 and 3’Sμ region to invert Sμ (~4 kb) sequence. Initial screening for positive clones was done by PCR, followed by Southern blotting and Sanger sequencing for inversion junction. The resultant cells were stimulated with anti-CD40, IL4 and TGF-β, IgA CSR was measured by FACS on days 2 and 3 post-stimulation. ΔSα1xI Sμ(INV-4kb) cells were obtained by targeting above mentioned 1x I-Sce1 RMCE positive cells with gRNA targeting 5’Sμ_2 and 3’Sμ for inverting Sμ (~4 kb) sequence same as above. The resultant positive clones were verified by PCR, Southern blotting and Sanger sequencing for knowing inversion junction. To make rSμ-CH12F3 cells, above mentioned CH12F3 (non-productive allele ΔSμ-Sα) were used to further truncate Sμ sequences on the coding allele with gRNA targeting 5’Sμ_2 and 3’Sμ. Single-cell deletion subclones were screened and confirmed by PCR and Southern blot. The resultant rSμ-CH12F3 cells were stimulated with anti-CD40, IL4 and TGF-β and harvested on days 2 and 3 for genomic DNA isolation for HTGTS library preparation.
DC-PCR
The DC-PCR assay was performed as described previously35. Briefly, genomic DNA was isolated and subsequently purified by phenol chloroform extraction from day 4 anti-CD40/IL4 stimulated B cells. Five μg of genomic DNA was digested overnight with 20 U of EcoRI (Roche). Ligations were performed under diluted conditions to promote circularization. Digested DNA was ligated overnight at 16°C with a concentration of 1.8-9 ng/μl in a total volume of 100 μl per reaction. Three to four ligation reactions were pooled, column purified, concentrated and serially diluted at a 1:5 ratio. PCR reaction was then performed in 50 μl/reaction using 2.5 U Taq (Qiagen) with serially diluted DNA starting from ~50-150 ng. Primers were designed to amplify the Sμ-Sγ1 rearrangements that occur during CSR to IgG1 in direct chromosomal joining of Sμ-Sγ1 with excision of circular DNA or inversion of sequences between breakends of Sμ and Sγ1. As a control for EcoRI digestion and circularization of input DNA, amplification of an EcoRI fragment of nicotinic acetylcholine receptor B subunit gene (CHRNB1) was performed, which after EcoRI digestion and circularization, generates a 753-bp DC-PCR product. To quantify the amount of direct or inversion joins amplified by PCR, DC-PCR products of direct or inversion joins were cloned into the pcR2.1 Topo TA vector. Precise plasmid concentrations were determined and a standard curve was generated ranging from 4 to 10,000 copies/reaction. After running on 1% agarose gel, PCR fragments were transferred to nitrocellulose membrane and hybridized to 3’Sγ1 probe according to standard Southern blotting procedures. Primers for direct joining PCR: forward: 5′ CATGAGAGCTGGAGCTAGTATGAAGGTG -3′, reverse: 5′-ACTGACTGACTGAGTGTCCTCTCAAC-3′. Primers for inversional joining PCR forward: 5′-CAGTCACAGAGAAACTGATCCAGGTGAG -3′, reverse: 5′- CCATAGCAGTTGGTCAATCCTTGTCTCC-3’. Primers for control CHRNB1 DC-PCR35: forward: 5′-GCGCCATCGATGGACTGCTGTGGGTTTCACCCAG-3′, reverse: 5′-GGCCGGTCGACAGGCGCGCACTGACACCACTAAG-3′. Oligo probe for the detection of both deletional and inversional CSR joining products: Sγ1-CCTGGGTAGGTTACAGGTCAAGGCT.
High-throughput genome-wide translocation sequencing (HTGTS)
HTGTS libraries were generated by emulsion-mediated PCR (EM-PCR) and linear amplification-mediated (LAM)-PCR method as described in detail by Frock et al.5 Briefly, sonicated (Bioruptor, Diagenode) genomic DNA was subjected to LAM-PCR using 1 U Taq polymerase (Qiagen) per reaction with a single biotinylated primer for 50 cycles under condition 94°C 180 s; 94°C 30 s; 58°C 30 s; 72°C 90 s. One more unit of Taq polymerase was added to the reaction mixture to execute PCR for additional 50 cycles. Biotinylated DNA fragments were captured with Dynabeads MyOne streptavidin C1 beads (Invitrogen) at room temperature for 1 hr, followed by on-bead ligation at 25°C for 2 hr with bridge adapters in the presence of 15% PEG-8000 (Sigma) and 1 mM hexammine cobalt chloride (Sigma). After washing beads with B&W buffer as described by the vender, ligated products were subjected to 15 cycles of on-beads PCR with Phusion polymerase (Fisher), locus-specific and adapter primer followed by blocking digestion with appropriate restriction enzymes to remove uncut germline genomic DNA. A third round of tagging-PCR to add Illumina Miseq-compatible adapters at 5’ and 3’ ends of the second-round PCR product was carried out for another 10 cycles with Phusion polymerase. PCR products were size-fractionated for DNA fragments between 300-1000 bp on a 1% agrose gel, column purified (Qiagen) before loading onto Illumina Miseq machine for sequencing.
Data Analyses
Data analysis of MiSeq sequencing reads has been described in Frock et al.5 Briefly, De-multiplexing for the MiSeq reads was performed using the fastq-multx tool from ea-utils (https://code.google.com/p/eautils/) and adaptor sequence trimming was done using the SeqPrep utility (https://github.com/jstjohn/SeqPrep). Reads were mapped using Bowtie2 (http://bowtiebio.sourceforge.net/bowtie2/manual.shtml) to either mm9 (for libraries generated with rif1 KO cells and CH12F3-derived cells) or modified mm9 reference genome (for all other genotypes) containing the 176 kb IgH constant region of 129s genome, in which the region between chr12:114493849-114665808 of mm9 was replaced with DNA sequence ranging 1416975-1593283 on the 129s IgH reference sequences AJ851868.3. In cases where necessary, for instance when aligning reads to the Sμ1xI locus on the IgHI-96k allele and other circumstances, we further modified the custom 129s_IgHC genome to insert the cassette sequences to accurately reflect the changes of genomic information before aligning MiSeq reads by Bowtie2. CH12F3 clone was derived from CH12.LX lymphoma cell line37. CH12.LX cells were subcloned from the original CH12 lymphoma cell line38, which originated from C57BL/10 mice substrain double congenic for H-2a H-4b (39). C57BL/10 and C57BL/6 are both substrains of C57BL and thus we use BL/6 (mm9) as reference genome when running our HTGTS data analyses pipeline on libraries made with CH12F3 cells. To reflect additional genome modifications (e.g. Sμ(INV) shown in Fig. 2b), mm9 genome sequence was modified accordingly.
Best-path searching algorithm (based on YAHA read aligner and breakpoint detector, Faust et al., 201240) was used to select optimal sequence alignments from Bowtie2 reported top alignments with an alignment score above 50, which represents a perfect 25-nt local alignment. To avoid detecting possible mis-priming events, we set a threshold of at least 10 nt perfectly aligned bait alignment extending from the end of cloning primer. Aligned reads are subsequently filtered on following criteria: (i) reads must include both a bait alignment and a prey alignment and (ii) the bait alignment cannot extend more than 10 nt beyond the targeted site. For reads mapped to the repetitive low mappability regions, multiple competing alignments with identical or similar scores exist and the coordinates for best alignment are randomly chosen among the competing ones. For junctions mapped to each individual repetitive S region, there are no competing alignments from outside of that region as shown by simulation (see details below), although the exact junction coordinate within the region could not be manifest. We also applied filter to remove duplicates (referred to as “de-dup” hereafter) wherein coordinates of the end of the bait alignment was compared to the start of the prey alignment across all reads. A read is marked as a duplicate if it has bait and prey alignments coordinates offset within 2 nt of another read's bait and prey alignments. To plot all the S region junctions, we took the ones filtered by mappability filter but unequivocally mapped to S regions and removed the repeats through the de-dup program mentioned above, prior to combining with “good” reads passing both the mappability and de-dup filters. Grey box over S regions (e.g. Sμ and Sγ1) in the figures were used to denote the repetitive regions in these S sequences wherein the randomly assigned mappability filtered reads were included. Additionally we applied post-filtering stringencies to remove junctions mapped to simple sequence repeats, telomere repeats and reads with excessive microhomology >20 nt and insertions >30 nt before further analysis. In the end, the combined and cleaned junctions were then plotted genome-wide or onto desired S regions by using the “PlotRegion” tool (for details see section below).
Scripts and details of pipeline parameters are available upon request.
Pipeline simulation for S region mappability
Results of the S region mappability simulations are available in the Supplementary Information.
S region junction plotting
As described above, filtered junctions by mappability filter are retrieved and de-duped before combining with normal junctions. To plot junction coordinates onto individual S region or the entire IgH constant region, combined junctions are binned using the “PlotRegion” tool into 100 bins (bin size varies depending on the length of target region that libraries are plotted to) based on the junction coordinates and orientation of joining. The bincount file (histogram information for junction distribution in both joining orientation) generated by the PlotRegion tool is used to calculate the percentage of junctions in each bin in either + or – orientation to the total number of junctions mapped to the region of interest. The results were then plotted as linear graph by the Prism software. Note that the scale on top of each graph is to indicate the size of region plotted and it is fixed as 1/10 in size of the plotted region, thus is always 10x bin size.
Calculation of joining orientation bias and acceptor S region resection
For simplicity, joining from 5’Sμ to downstream Sγ1 and Sε breaks are used for the explanation of orientation bias and resection of acceptor S region DSBs. Junctions mapped to Sγ1 and Sε can be divided into six regions (denoted by a-f) on either (+) or (-) orientation as shown below:
| core Sγ1/Sε | |||
|---|---|---|---|
| a | b | c | (−) |
| d | e | f | (+) |
Junctions encompassing core Sγ1/Sε are illustrated as b and e regions for (-) and (+) junctions respectively, c region (deletional joining, (-) orientation) or d region (inversional joining, (+) orientation) represent joining of bait DSB BE to resected acceptor Sγ1/Sε DSBs. Junctions falling into region a and f represent joining to non-AID-generated de novo breaks of unknown source and are often very small in number, thus omitted from calculation of both resection and orientation bias. Since in most genetic backgrounds other than 53BP1-/- inversion joins are much less than deletions, the level of resection junctions into d region fluctuates much more than c region resection junctions. We thus chose c region for calculating resection in all genotypes as follows:
The degree of orientation bias, for the purpose of positively correlating with level of resection, is calculated as the ratio of inversional joins versus deletional joins as below:
To make bar graph for comparison of orientation bias degree and resection levels in the CSR junctions obtained from libraries with different genetic backgrounds, individual replicate HTGTS libraries were first size normalized to the one with smallest junction number in the region of interest among the replicates; resection and bias ratio values from individual experiments were calculated separately and averages were used for statistical analysis with unpaired two-tailed t-test. Experiments for each genotype were performed for at least three times.
Extended Data
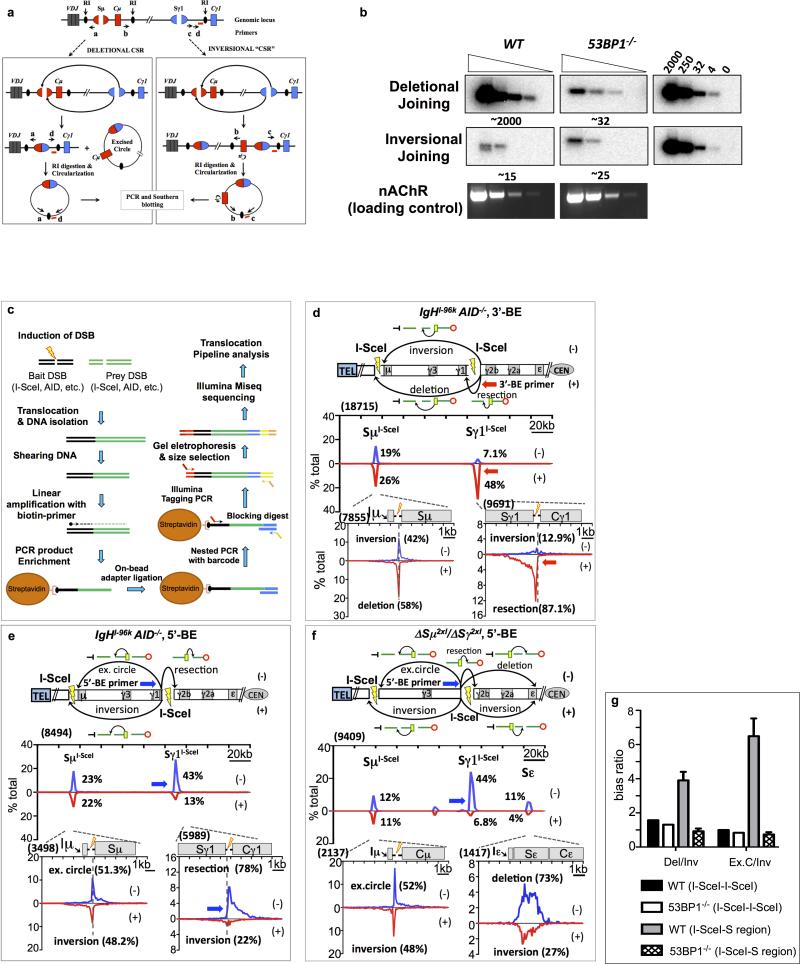
Extended Data Figure 1. Deletional CSR in in vitro activated B cells by DC-PCR. | I-Sce1 DSBs within the IgH constant region locus in activated B cells join with orientation-independence.
(a) Schematic representation of DC-PCR assay.
(b) DC-PCR results from anti-CD40/IL4-activated WT and 53BP1-/- B cells.
(c) Schematic representation of High-Throughput Genome-wide Translocation Sequencing (HTGTS) method.
(d, e) HTGTS libraries analyses of anti-CD40/IL4-stimulated IgHI-96k B cells with 3′ BEs (red arrow, n=3) or 5’BE (blue arrow, n=3) primer.
(f) HTGTS libraries with 5’-BE primer (blue arrow, n=3) from ΔSμ2xI/ΔSγ12xI B cells stimulated with anti-CD40/IL4.
(g) Bar graph depicting Deletion/Inversion and Excision Circle/Inversion ratio between two ISceI sites and between ISceI and S-region in WT versus 53BP1 background.
For detailed legends refer to Supplementary Information.
Extended Data Figure 2. Genome-wide translocation junctions lack orientation bias. | Statistical analyses for experimental replicates in Fig. 1 and 2. | Orientation-biased joining between I-SceI break in place of Sα and AID-initiated Sμ breaks in CH12F3 cells.
(a, b) Circos plots for translocation junctions across the whole genome from 3’BE (a, n=4) or 5’BE (b, n=3) HTGTS with anti-CD40/IL4 stimulated ΔSμ2xI/ΔSγ12xI B cells.
(c, d) Bar graphs depicting percentage of genome-wide junctions from pooled 3’BE and 5’BE libraries plotted separately mapping in (-) or (+) orientation ± s.d., respectively.
(e) Joining from ΔSγ12xI 3’-BE to AID off-target DSBs in Il4ra gene on chr 7.
(f) Bar graph showing the percentage of junctions (average ± s.d.) recovered from IgHI-96k AID-/- 3’-BE HTGTS libraries (n=3) at breaksite and the upstream Sμ1xI prey break as the percentage over the total number of junctions mapped to the 200 kb IgH constant region. Right panel shows the percentage of junctions mapping at Sμ1xI (average ± s.d.) over the total IgH junctions that are mapped in the deletion (Del) or inversional (Inv) orientation. The numbers above the bar graph (average ± s.d.) denote ratio of deletional versus inversional junctions.
(g) Bar graph showing the percentage of junctions (average ± s.d.) recovered from the IgHI-96kAID-/- 5’-BE HTGTS libraries (n=3).
(h) Bar graph showing the percentage of junctions (average ± s.d.) recovered from the ΔSμ2xI/ΔSγ12xI 3’-BE libraries (n=4).
(i) Bar graph showing the percentage of junctions (average ± s.d.) recovered from the ΔSμ2xI /ΔSγ2xI 5’-BE libraries (n=3).
(j) Bar graph showing the percentage of junctions (average ± s.d.) recovered from the WT ΔSγ12xI-3’BE libraries (n=3).
(k) Bar graph showing the percentage of junctions (average ± s.d.) recovered from the ΔSα1xI
CH12F3 3’-BE libraries (n=3) and ΔSα1xI Sμ(INV) CH12F3 cells 3’-BE libraries (n=3).
(l) Bar graphs depicting percentage of trans junctions mapping to Sμ in (-) and (+) orientation from libraries of ΔSμ2xI/ΔSγ12xI B cells (n=3) cloning from ΔSγ12xI 3’BE.
(m) Bar graphs depicting percentage of trans junctions mapping to Sμ in (-) and (+) orientation and to Sε in (-) and (+) orientation from libraries of c-myc25x-I-sceI 5′BE (n=3).
(n, o) HTGTS libraries analyses of ΔSα1xI CH12F3 cells stimulated with αCD40, IL4 and TGFβ and nucleofected with I-Sce1 expression plasmid. Cells were harvested on day 3 post-stimulation for 3’-BE (n,n=6) and 5’-BE (o, n=6) libraries.
(p) 3’-BE and 5’-BE libraries are normalized with “symmetric junctions” (see Supplementary Information).
(q) Bar graph showing percentage of junctions from ΔSα1xI CH12F3 cells (n=6) from 3’BE or 5’BE primer.
For detailed legends refer to Supplementary Information.
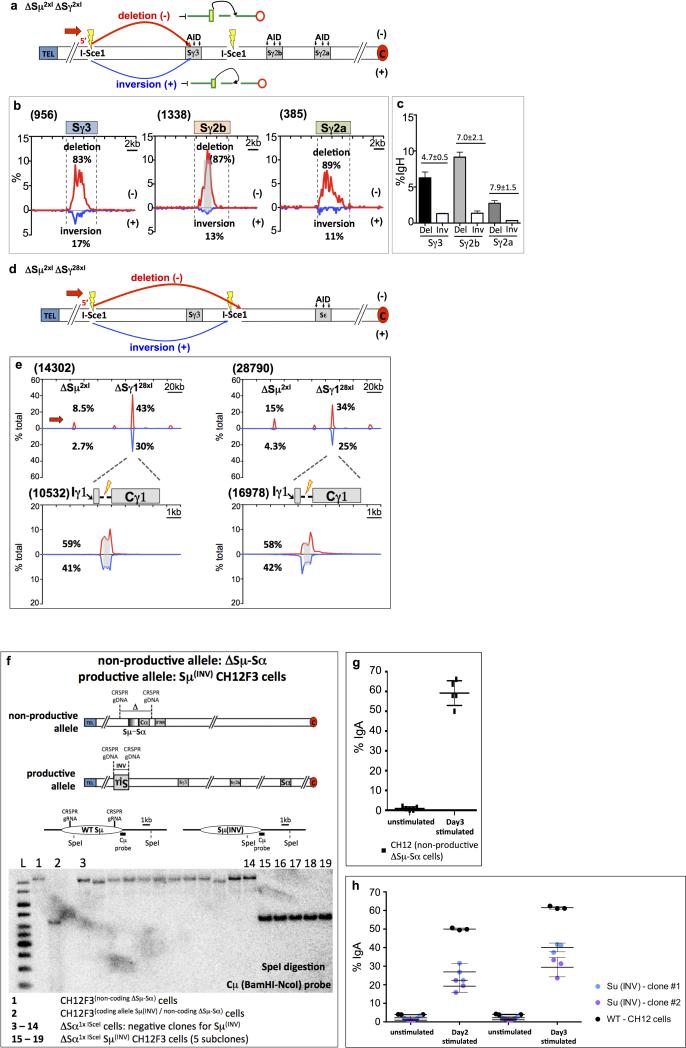
Extended Data Figure 3. Joining between I-SceI break at Sμ and AID-initiated S region breaks in LPS-activated ΔSμ2xI /ΔSγ12xIB cells and clustered I-Sce1 breaks in ΔSμ2xI ΔSγ128xI B cells in place of Sγ1. | Inverted Sμ in CH12F3 cells support robust IgA CSR.
(a) Diagram of IgH locus organization in ΔSμ2xI/ΔSγ12xI B cells highlighting AID-initiated breaks in Sγ3, Sγ2b and Sγ2a regions upon LPS stimulation and potential outcomes of CSR in the form of deletion (red, (-)) and inversional joining (blue, (+)).
(b) Plots showing enlarged distribution of pooled prey junctions in 20 kb region flanking Sγ3 and Sγ2b and Sγ2a from HTGTS libraries of ΔSμ2xI/ΔSγ12xI B cells (n=3) stimulated with LPS and anti-IgD-dextran and infected with I-SceI expressing retrovirus.
(c) Bar graph from three independent ΔSμ2xI/ΔSγ12xI 5’BE libraries showing percentage of junctions mapped at different S regions.
(d) Diagram of IgH locus organization in ΔSμ2xI ΔSγ128xI B cells highlighting joining outcomes of I-Sce1-mediated bait DSBs at ΔSμ2xI to clustered I-SceI DSBs at ΔSγ128xI in the form of deletion (red, (-)) and inversional joining (blue, (+)).
(e) Pooled prey junctions from independent ΔSμ2xI ΔSγ128xI B cell libraries (n=2, left panel, EM-PCR; n=2, right panel, LAM-HTGTS).
(f) Southern blot for Sμ inversion on the productive allele of CH12F3 cells with non-productive allele deleted.
(g) IgA CSR on Day 3 for CH12F3 (non-productive ΔSμ-Sα) cells stimulated with αCD40, IL4 and TGFβ.
(h) IgA CSR on CH12F3 (productive allele Sμ(INV) /non-productive allele ΔSμ-Sα) cells stimulated with αCD40, IL4 and TGFβ. Two independent clones of CH12F3(Sμ(INV)/non-productive ΔSμ-Sα).
For detailed legends refer to Supplementary Information.
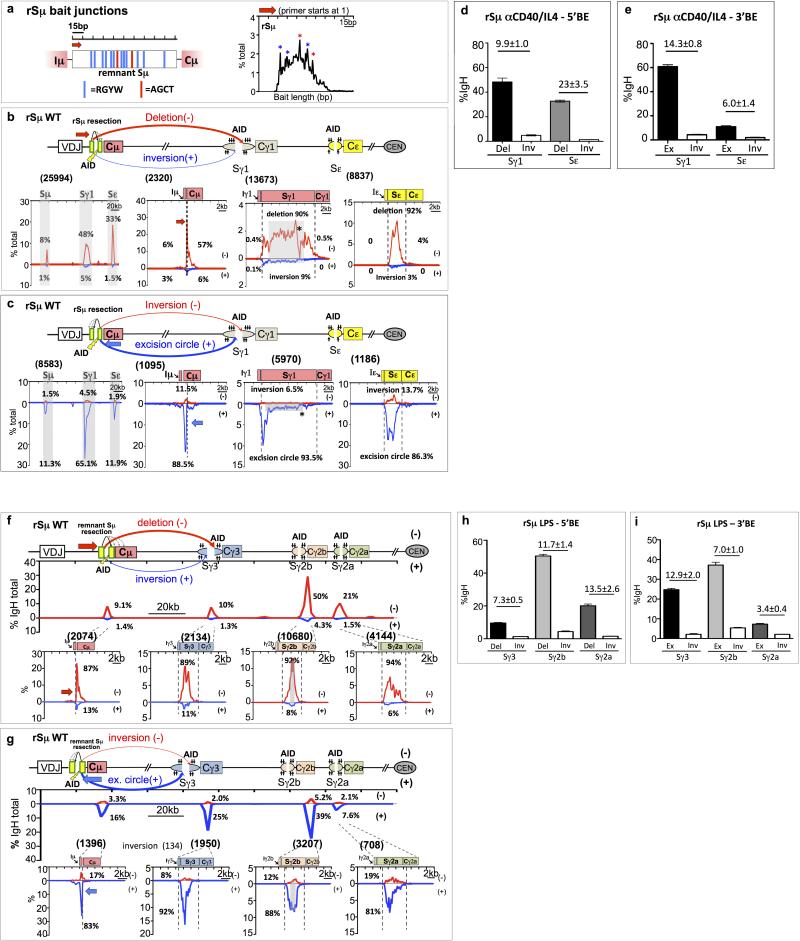
Extended Data Figure 4. Orientation-biased joining between AID-initiated rSμ and downstream AID-initiated S region breaks in anti-CD40/IL4-activated and in LPS-activated Sμ truncated B cells.
(a) 150 bp rSμ sequence used as HTGTS bait with red arrow indicating rSμ 5′BE HTGTS primer; red and blue vertical lines, respectively, indicate canonical AGCT or other RGYW AID-targeting motifs. Distribution of rSμ break-points in junctions to downstream S regions recovered from αCD40/IL-4 stimulated rSμ B cells.
(b) HTGTS analyses of αCD40/IL-4-activated rSμ B cells, 5’ rSμ AID-initiated BE (red primer, n=3) junctions to AID-initiated DSBs in Sγ1 and Sε which includes deletion (- orientation, red) or inversions (+ orientation, blue).
(c) HTGTS analyses of αCD40/IL-4-activated rSμ B cells, 3’ rSμ AID-initiated BE (blue primer, n=3) junctions to AID-initiated DSBs in Sγ1 and Sε which includes excision circle (+ orientation, blue) or inversions (- orientation, red).
(d) Bar graph showing percentage of junctions (average ± s.d.) from αCD40/IL-4-activated rSμ 5’-BE libraries mapped to Sγ1 and Sε.
(e) Bar graph showing percentage of junctions (average±s.d.) from αCD40/IL-4-activated rSμ 3’-BE libraries mapped to Sγ1 and Sε.
(f) HTGTS analyses of LPS-activated rSμ B cells, 5’ rSμ (red primer, n=3) AID-initiated BE junctions to AID-initiated DSBs in Sγ2a which includes deletional joining (- orientation, red) or inversions (+ orientation, blue).
(g) HTGTS analyses of LPS-activated rSμ B cells, 3’ rSμ (blue primer, n=3) AID-initiated BE junctions to AID-initiated DSBs of above LPS stimulated cells in Sγ3 and Sγ2b and Sγ2a which includes excision circle (+ orientation, blue) or inversions (- orientation, red).
(h, i) Percentage of junction distribution at Sγ3, Sγ2b and Sγ2a in both orientations from both 5’BE libraries (h) and 3’BE libraries (i) are shown as average ± s.d. from three independent experiments.
For detailed legends refer to Supplementary Information.
Extended Data Figure 5. Orientation-biased joining between rSμα and AID-induced SαDSBs in CSR-activated CH12F3 cells.
(a) Diagram outlining potential junction outcomes from 5’ rSμ (red primer) or 3’ rSμ (blue primer) AID-initiated BE junctions to AID-initiated DSBs in Sα upon αCD40, IL4 and TGFβ stimulation of ΔSμ-CH12F3 cells.
(b and c) Top panel shows HTGTS libraries analyses of Day 2 (b) and Day 3 (c) stimulated CH12F3 (non-productive allele: ΔSμ-Sα / productive allele: ΔSμ) cells cloning from 5’BE rSμ (red primer, n=3), whereas lower panel shows HTGTS libraries cloning from 3’BE rSμ (blue primer, n=3).
(d) Bar graph shows percentage of junctions (average ± s.d.) for 5’BE and 3’BE libraries indicated in (b) and (c).
(e) Bar graph with percentage of junctions (average ± s.d.) from rSμ libraries mapped to prey Sα in the deletion (DEL) or inversion (INV) for 5’BE libraries and in excision circle (EC) or inversion (INV) orientation for 3’BE libraries.
For detailed legends refer to Supplementary Information.
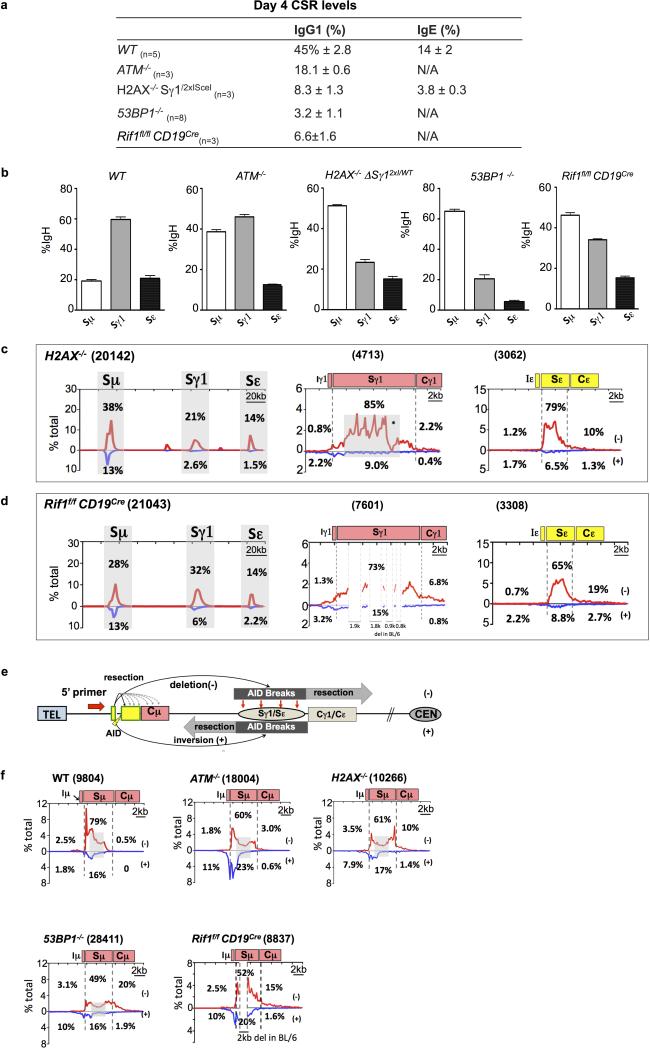
Extended Data Figure 6. Level of junctions to downstream S regions in WT and DSBR-deficient 5’Sμ HTGTS libraries correlate with CSR levels. | 5’Sμ breaksite undergoes variable degrees of resection from stimulated DSBR-deficient B cells.
(a) Table showing IgG1 and IgE CSR levels of splenic B cells from various genotypes (with number of replicates indicated) activated in vitro with anti-CD40 + IL4. FACS was performed on day 4 and values indicate average ± s.d.
(b) Left panel shows bar graph for percentage of junctions (average ± s.d.) recovered from WT 5’Sμ 5’-BE libraries mapped to the Sμ, Sγ1 and Sε over the total number of junctions identified from the 200 kb IgH constant region. Remaining panels shows the similar results from different DSBR-deficient backgrounds using the same 5’-BE primer.
(c and d) 5’Sμ 5’-BE HTGTS libraries analyses from H2AX-/- and RIF1fl/fl CD19Cre B cells are shown respectively.
(e) Diagram of potential junction outcomes from 5’Sμ AID-initiated 5’BE junctions to AID-initiated DSBs in Sγ1 and Sε.
(f) Data from HTGTS libraries mapped to the 20kb region flanking 5’Sμ breaksite from B cells stimulated with anti-CD40/IL4 in WT and DSBR-deficient backgrounds.
For detailed legends refer to Supplementary Information.
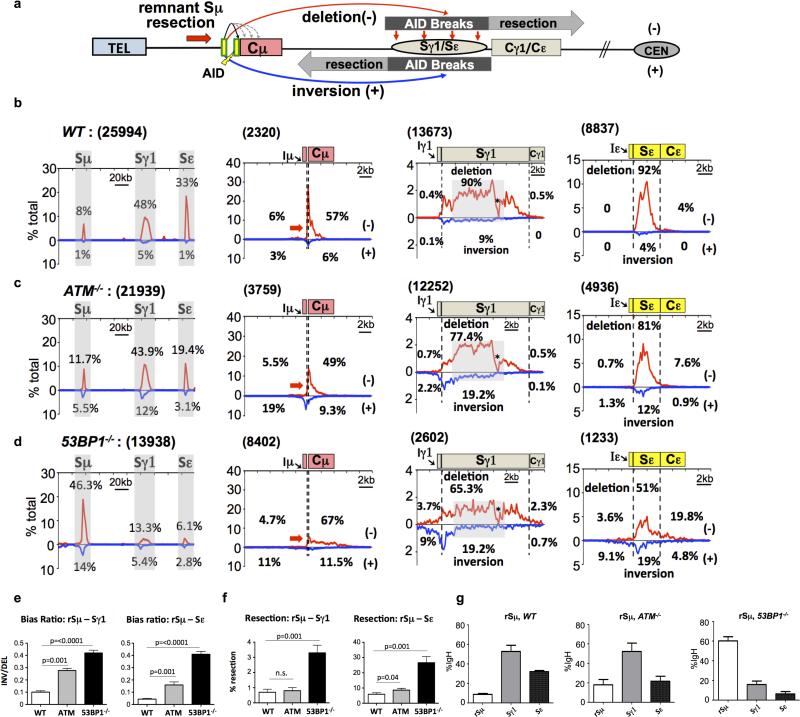
Extended Data Figure 7. Orientation-biased joining between rSμ and AID-induced Sγ and Sε DSBs in WT, ATM-deficient, and 53BP1-deficient B cells.
(a) Diagram of potential junction outcomes from 5’ rSμ AID-initiated BE junctions to AID-initiated DSBs in Sγ1 and Sε as described earlier.
(b-d) Linear plots of pooled junctions across the 200 kb IgH constant region (first panel), 20 kb region flanking rSμ breaksite (second panel), 20 kb region flanking downstream Sγ1 (third panel) and Sε (last panel) from three independent WT (b), ATM- (c), or 53BP1- (d) deficient 5’BE rSμ libraries.
(e) Bias ratios of HTGTS Sγ1 (left panel) and Sε (right panel) junctions in different genotypes showing average ± s.d. from three independent libraries for each genotype.
(f) Bar graphs showing percentage of long resection of Sγ1 (left panel) and Sε (right panel) junctions in different genotypes as average ± s.d.
(g) Statistical analyses of reproducibility for experiments mentioned above. For detailed legends refer to Supplementary Information.
Extended Data Figure 8. Orientation-biased joining of I-SceI DSBs at Sγ1 to AID-induced S region breaks in various DSBR-deficient backgrounds.
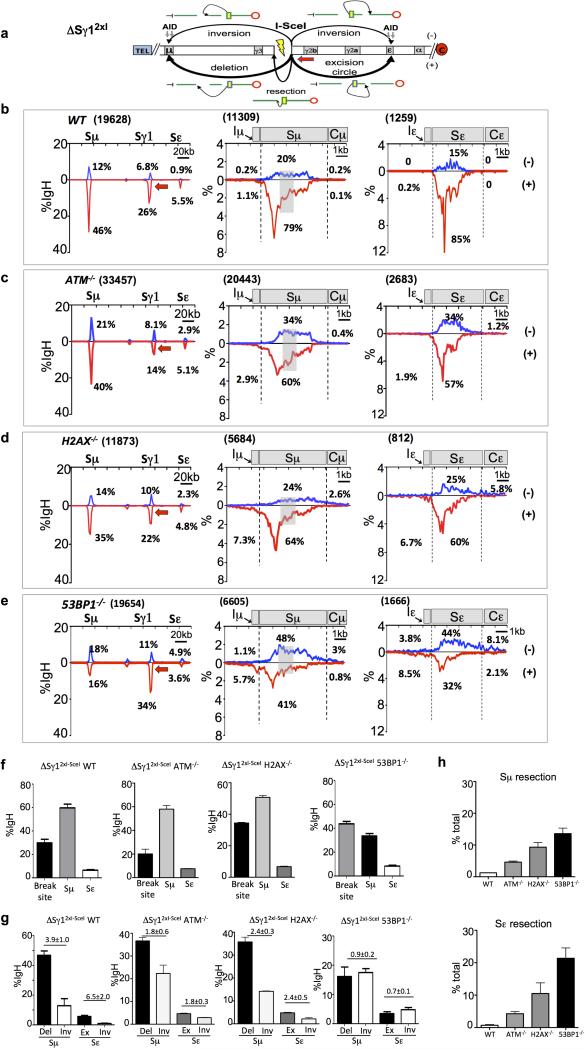
(a) Schematic illustration of the ΔSγ12xI allele and joining outcomes from 3’BE (red arrow) to AID-initiated upstream Sμ and downstream Sε DSBs.
(b) Linear distribution of junctions between ΔSγ12xI-3’BE to AID-induced Sμ/Sε region DSBs in anti-CD40/IL4 stimulated WT (b, n=4), ATM-/- (c, n=3), H2AX-/- (d, n=3) and 53BP1-/- (e, n=4) cells across the 200 kb IgH region (first panels), 10kb-Sμ (second panels) and Sε (last panels).
(f) Bar graphs for percent of junctions mapped at ΔSγ12xI (breaksite), Sμ and Sε over the total number of junctions in the 200 kb IgH constant region in different genotypes.
(g) Bar graphs with percent of junctions from above various genotypes of ΔSγ12xI-3’BE libraries mapped to Sμ and Sε as average ± s.d.
(h) Comparison of percentages of junctions cloned using ΔSγ12xI-3’BE involving resection of Sμ (top panel) and Sε (bottom panel) breaks in indicated backgrounds.
For detailed legends refer to Supplementary Information.
Extended Data Figure 9. Inhibition of resection in 53BP1-deficient B cells by ATMi does not rescue directional CSR joining to Sγ1.
(a-d) Linear plots of pooled junctions across the 200 kb IgH constant region (left panels), 20 kb region flanking downstream Sγ1 (middle panels) and Sε (right panels) from WT DMSO control (a, n=2), WT + ATMi (b, n=3), 53BP1-/- + DMSO (c, n=3) and 53BP1-/- + ATMi (d, n=3) libraries are shown similarly as mentioned above.
(e) Bar graph for percentage of Sμ, Sγ1 and Sε junctions (average ± s.d.) from WT+DMSO 5’Sμ libraries (left panel) and WT+ATMi 5’BE libraries (right panel, n=3).
(f) Bar graph for percentage of Sμ, Sγ1 and Sε junctions (average ± s.d.) from 53BP1-/- +DMSO (left panel) and 53BP1-/- +ATMi (right panel) 5’Sμ libraries.
For detailed legends refer to Supplementary Information.
Extended Data Table 1. Statistical comparison for orientation bias and resection in Sγ1 and Sε junctions from WT and DSBR-deficient B cell libraries.
Unpaired two-tailed t-test for the degree of bias in the Sγ1 (a) and Sε (b) junctions between WT and DSBR-deficient B cells with full-length Sμ was performed for experiments described in Figs. 3 and 4. Orientation bias was calculated as described in methods for individual libraries. Numbers in parenthesis indicate times of independent experiments performed for each genotype. N/A: not available. Unpaired two-tailed t-test for the level of resections in the Sγ1 (c) and Sε (d) junctions was performed for experiments described above. Percentage of resection was calculated as described in Methods for individual libraries. Numbers in parenthesis indicate number of times of independent experiments performed for each genotype. N/A: not available.
| Extended Data Table 1a Statistical analysis of bias ratio of Sγ1 junctions | ||||||
|---|---|---|---|---|---|---|
| WT | ATM−/− | H2AX−/− | 53BP1−/− | 53BP1−/−+ Ai | Rif1−/− | |
| WT (n=5) | ||||||
| ATM−/− (n=3) | <0.0001 | |||||
| H2AX−/− (n=3) | 0.0057 | 0.0031 | ||||
| 53BP1−/− (n=8) | <0.0001 | <0.0001 | <0.0001 | |||
| 53BP1−/−+Ai(n=3) | <0.0001 | 0.0039 | 0.001 | 0.1481 | ||
| Rif1−/− (n=3) | <0.0001 | 0.181 | 0.0094 | <0.0001 | 0.0029 | |
| Extended Data Table 1b Statistical analysis of bias ratio of Sε junctions | ||||||
|---|---|---|---|---|---|---|
| WT | ATM−/− | H2AX−/− | 53BP1−/− | 53BP1−/−+ Ai | Rif1−/− | |
| WT (n=5) | ||||||
| ATM−/− (n=3) | <0.0001 | |||||
| H2AX−/− (n=3) | 0.0034 | 0.0291 | ||||
| 53BP1−/− (n=5) | <0.0001 | 0.0003 | 0.0002 | |||
| 53BP1−/−+Ai(n=3) | N/A | N/A | N/A | N/A | ||
| Rif1−/− (n=3) | 0.0012 | 0.9274 | 0.1154 | 0.0003 | N/A | |
| Extended Data Table 1c Statistical analysis of resection of Sγ1 junctions | ||||||
|---|---|---|---|---|---|---|
| WT | ATM−/− | H2AX−/− | 53BP1−/− | 53BP1−/−+ Ai | Rif1−/− | |
| WT (n=5) | ||||||
| ATM−/− (n=3) | 0.0002 | |||||
| H2AX−/− (n=3) | 0.0037 | 0.3012 | ||||
| 53BP1−/− (n=8) | <0.0001 | 0.0002 | 0.0008 | |||
| 53BP1−/−+Ai(n=3) | <0.0001 | 0.158 | 0.7974 | 0.0005 | ||
| Rif1−/− (n=3) | N/A | N/A | N/A | N/A | N/A | |
| Extended Data Table 1d Statistical analysis of resection of Sε junctions | ||||||
|---|---|---|---|---|---|---|
| WT | ATM−/− | H2AX−/− | 53BP1−/− | 53BP1−/−+ Ai | Rif1−/− | |
| WT (n=5) | ||||||
| ATM−/− (n=3) | <0.0001 | |||||
| H2AX−/− (n=3) | <0.0001 | 0.0279 | ||||
| 53BP1−/− (n=5) | <0.0001 | 0.0001 | 0.0003 | |||
| 53BP1−/−+Ai(n=3) | N/A | N/A | N/A | N/A | ||
| Rif1−/− (n=3) | <0.0001 | 0.0199 | 0.058 | 0.0062 | N/A | |
Supplementary Material
ACKNOWLEDGEMENTS
We thank K. Yu for providing CH12F3-RMCE (1F7) cell line and exchange cassette plasmid. This work was supported by National Institute of Health grants AI077595 to F.W.A., CA133781 to J.M., AI112602 to D.F.R., and AI037526 and AI072529 to M.C.N. S.V. was supported by NIH training grant T32HL066987. F.W.A. and M.C.N. are Investigators of the Howard Hughes Medical Institute. J.H. is supported by a Robertson Foundation/Cancer Research Institute Irvington Fellowship. F.M. is a Lymphoma Research Foundation postdoctoral fellow and was a Cancer Research Institute postdoctoral fellow.
Footnotes
AUTHOR CONTRIBUTIONS
J.D., R.P., T.Z., J.P.M. and F.W.A. designed the study; J.D., R.P., T.Z., J.H. and S.V. performed experiments; Y.H. and R.M. designed bioinformatics pipelines; R.M., J.D., R.P. and Z.D. performed computational analyses of sequencing data; J.D., R.P. and F.W.A. wrote the paper. Other authors provided reagents, designed or performed certain experiments, and helped polish the paper.
The authors declare no competing financial interests.
SEQUENCING DATA
HTGTS sequencing data is deposited in the GEO database under the accession number GSE71005.
REFERENCES
- 1.Schatz DG, Swanson PC. V(D)J recombination: mechanisms of initiation. Annu. Rev. Genet. 2011;45:167–202. doi: 10.1146/annurev-genet-110410-132552. [DOI] [PubMed] [Google Scholar]
- 2.Alt FW, Zhang Y, Meng FL, Guo C, Schwer B. Mechanisms of programmed DNA lesions and genomic instability in the immune system. Cell. 2013;152:417–29. doi: 10.1016/j.cell.2013.01.007. [DOI] [PMC free article] [PubMed] [Google Scholar]
- 3.Di Noia JM, Neuberger MS. Molecular mechanisms of antibody somatic hypermutation. Annu. Rev. Biochem. 2007;76:1–22. doi: 10.1146/annurev.biochem.76.061705.090740. [DOI] [PubMed] [Google Scholar]
- 4.Chiarle R, et al. Genome-wide translocation sequencing reveals mechanisms of chromosome breaks and rearrangements in B cells. Cell. 2011;147:107–19. doi: 10.1016/j.cell.2011.07.049. [DOI] [PMC free article] [PubMed] [Google Scholar]
- 5.Frock RL, et al. Genome-wide detection of DNA double-stranded breaks induced by engineered nucleases. Nat. Biotechnol. 2015;33:179–186. doi: 10.1038/nbt.3101. [DOI] [PMC free article] [PubMed] [Google Scholar]
- 6.Yancopoulos GD, et al. Secondary genomic rearrangement events in pre-B cells: VHDJH replacement by a LINE-1 sequence and directed class switching. EMBO J. 1986;5:3259–66. doi: 10.1002/j.1460-2075.1986.tb04637.x. [DOI] [PMC free article] [PubMed] [Google Scholar]
- 7.Jack HM, et al. Looping out and deletion mechanism for the immunoglobulin heavy-chain class switch. Proc. Natl. Acad. Sci. U.S.A. 1988;85:1581–5. doi: 10.1073/pnas.85.5.1581. [DOI] [PMC free article] [PubMed] [Google Scholar]
- 8.Vaandrager JW, et al. DNA fiber fluorescence in situ hybridization analysis of immunoglobulin class switching in B-cell neoplasia: aberrant CH gene rearrangements in follicle center-cell lymphoma. Blood. 1998;92:2871–8. [PubMed] [Google Scholar]
- 9.Lenz G, et al. Aberrant immunoglobulin class switch recombination and switch translocations in activated B cell-like diffuse large B cell lymphoma. J. Exp. Med. 2007;204:633–43. doi: 10.1084/jem.20062041. [DOI] [PMC free article] [PubMed] [Google Scholar]
- 10.Harriman W, Völk H, Defranoux N, Wabl M. Immunoglobulin class switch recombination. Annu. Rev. Immunol. 1993;11:361–84. doi: 10.1146/annurev.iy.11.040193.002045. [DOI] [PubMed] [Google Scholar]
- 11.Bothmer A, et al. 53BP1 regulates DNA resection and the choice between classical and alternative end joining during class switch recombination. J. Exp. Med. 2010;207:855–65. doi: 10.1084/jem.20100244. [DOI] [PMC free article] [PubMed] [Google Scholar]
- 12.Zarrin AA, et al. Antibody class switching mediated by yeast endonuclease- generated DNA breaks. Science. 2007;315:377–81. doi: 10.1126/science.1136386. [DOI] [PubMed] [Google Scholar]
- 13.Gostissa M, et al. IgH class switching exploits a general property of two DNA breaks to be joined in cis over long chromosomal distances. Proc. Natl. Acad. Sci. U.S.A. 2014;111:2644–9. doi: 10.1073/pnas.1324176111. [DOI] [PMC free article] [PubMed] [Google Scholar]
- 14.Tian M, Alt FW. Transcription-induced cleavage of immunoglobulin switch regions by nucleotide excision repair nucleases in vitro. J. Biol. Chem. 2000;275:24163–72. doi: 10.1074/jbc.M003343200. [DOI] [PubMed] [Google Scholar]
- 15.Yu K, Chedin F, Hsieh CL, Wilson TE, Lieber MR. R-loops at immunoglobulin class switch regions in the chromosomes of stimulated B cells. Nat. Immunol. 2003;4:442–51. doi: 10.1038/ni919. [DOI] [PubMed] [Google Scholar]
- 16.Reynaud S, et al. Interallelic class switch recombination contributes significantly to class switching in mouse B cells. J. Immunol. 2005;174:6176–83. doi: 10.4049/jimmunol.174.10.6176. [DOI] [PubMed] [Google Scholar]
- 17.Khamlichi AA, et al. Immunoglobulin class-switch recombination in mice devoid of any Sμ tandem repeat. Blood. 2004;103:3828–36. doi: 10.1182/blood-2003-10-3470. [DOI] [PubMed] [Google Scholar]
- 18.Zhang T, et al. Downstream class switching leads to IgE antibody production by B lymphocytes lacking IgM switch regions. Proc. Natl. Acad. Sci. U.S.A. 2010;107:3040–5. doi: 10.1073/pnas.0915072107. [DOI] [PMC free article] [PubMed] [Google Scholar]
- 19.Nussenzweig A, Nussenzweig MC. Origin of chromosomal translocations in lymphoid cancer. Cell. 2010;141:27–38. doi: 10.1016/j.cell.2010.03.016. [DOI] [PMC free article] [PubMed] [Google Scholar]
- 20.Franco S. H2AX prevents DNA breaks from progressing to chromosome breaks and translocations. Mol. Cell. 2006;21:201–14. doi: 10.1016/j.molcel.2006.01.005. [DOI] [PubMed] [Google Scholar]
- 21.Bredemeyer AL, et al. ATM stabilizes DNA double-strand-break complexes during V(D)J recombination. Nature. 2006;442:466–70. doi: 10.1038/nature04866. [DOI] [PubMed] [Google Scholar]
- 22.Daniel JA, Nussenzweig A. The AID-induced DNA damage response in chromatin. Mol. Cell. 2013;50:309–21. doi: 10.1016/j.molcel.2013.04.017. [DOI] [PMC free article] [PubMed] [Google Scholar]
- 23.Reina-San-Martin B, Chen J, Nussenzweig A, Nussenzweig MC. Enhanced intra-switch region recombination during immunoglobulin class switch recombination in 53BP1−/− B cells. Eur. J. Immunol. 2007;37:235–9. doi: 10.1002/eji.200636789. [DOI] [PubMed] [Google Scholar]
- 24.Bassing CH, Alt FW. The cellular response to general and programmed DNA double-strand breaks. DNA Repair (Amst) 2004;3:781–96. doi: 10.1016/j.dnarep.2004.06.001. [DOI] [PubMed] [Google Scholar]
- 25.Yamane A, et al. RPA accumulation during class switch recombination represents 5′-3′ DNA-end resection during the S-G2/M phase of the cell cycle. Cell Rep. 2013;3:138–47. doi: 10.1016/j.celrep.2012.12.006. [DOI] [PMC free article] [PubMed] [Google Scholar]
- 26.Panier S, Boulton SJ. Double-strand break repair: 53BP1 comes into focus. Nat. Rev. Mol. Cell Biol. 2014;15:7–18. doi: 10.1038/nrm3719. [DOI] [PubMed] [Google Scholar]
- 27.Zimmermann M, de Lange T. 53BP1: pro choice in DNA repair. Trends Cell Biol. 2014;24:108–17. doi: 10.1016/j.tcb.2013.09.003. [DOI] [PMC free article] [PubMed] [Google Scholar]
- 28.Lucas JS, Zhang Y, Dudko OK, Murre C. 3D trajectories adopted by coding and regulatory DNA elements: first-passage times for genomic interactions. Cell. 2014;158:339–52. doi: 10.1016/j.cell.2014.05.036. [DOI] [PMC free article] [PubMed] [Google Scholar]
- 29.Helmink BA, et al. H2AX prevents CtIP-mediated DNA end resection and aberrant repair in G1-phase lymphocytes. Nature. 2011;469:245–9. doi: 10.1038/nature09585. [DOI] [PMC free article] [PubMed] [Google Scholar]
- 30.Borghesani PR, et al. Abnormal development of Purkinje cells and lymphocytes in Atm mutant mice. Proc. Natl. Acad. Sci. U.S.A. 2000;97:3336–41. doi: 10.1073/pnas.050584897. [DOI] [PMC free article] [PubMed] [Google Scholar]
- 31.Bassing CH, et al. Histone H2AX: a dosage-dependent suppressor of oncogenic translocations and tumors. Cell. 2003;114:359–70. doi: 10.1016/s0092-8674(03)00566-x. [DOI] [PubMed] [Google Scholar]
- 32.Morales JC, et al. Role for the BRCA1 C-terminal repeats (BRCT) protein 53BP1 in maintaining genomic stability. J. Biol. Chem. 2003;278:14971–7. doi: 10.1074/jbc.M212484200. [DOI] [PubMed] [Google Scholar]
- 33.Di Virgilio M, et al. Rif1 prevents resection of DNA breaks and promotes immunoglobulin class switching. Science. 2013;339:711–5. doi: 10.1126/science.1230624. [DOI] [PMC free article] [PubMed] [Google Scholar]
- 34.Han L, Masani S, Yu K. Overlapping activation-induced cytidine deaminase hotspot motifs in Ig class-switch recombination. Proc. Natl. Acad. Sci. U.S.A. 2011;108:11584–9. doi: 10.1073/pnas.1018726108. [DOI] [PMC free article] [PubMed] [Google Scholar]
- 35.Chu CC, Paul WE, Max EE. Quantitation of immunoglobulin μ-γ1 heavy chain switch region recombination by a digestion-circularization polymerase chain reaction method. Proc. Natl. Acad. Sci. U.S.A. 1992;89:6978–82. doi: 10.1073/pnas.89.15.6978. [DOI] [PMC free article] [PubMed] [Google Scholar]
- 36.Cong L, et al. Multiplex genome engineering using CRISPR/Cas systems. Science. 2013;339:819–23. doi: 10.1126/science.1231143. [DOI] [PMC free article] [PubMed] [Google Scholar]
- 37.Nakamura M, et al. High frequency class switching of an IgM+ B lymphoma clone CH12F3 to IgA+ cells. Int. Immunol. 1996;8:193–201. doi: 10.1093/intimm/8.2.193. [DOI] [PubMed] [Google Scholar]
- 38.Bishop GA, Haughton G. Induced differentiation of a transformed clone of Ly-1 B cells by clonal T cells and antigen. Proc. Natl. Acad. Sci. U.S.A. 1986;83:7410–7414. doi: 10.1073/pnas.83.19.7410. [DOI] [PMC free article] [PubMed] [Google Scholar]
- 39.Haughton G, Arnold LW, Bishop GA, Mercolino TJ. The CH series of murine B cell lymphomas: neoplastic analogues of Ly-1+ normal B cells. Immunol. Rev. 1986;93:35–51. doi: 10.1111/j.1600-065x.1986.tb01501.x. [DOI] [PubMed] [Google Scholar]
- 40.Faust GG, Hall IM. YAHA: fast and flexible long-read alignment with optimal breakpoint detection. Bioinformatics. 2012;28:2417–24. doi: 10.1093/bioinformatics/bts456. [DOI] [PMC free article] [PubMed] [Google Scholar]
Associated Data
This section collects any data citations, data availability statements, or supplementary materials included in this article.


