

Abstract
BACKGROUND
Although heregulin and HER3 are frequently expressed at high levels in head and neck cancer, their prognostic value remains unclear. We explored the prognostic significance of heregulin/HER3 expression in patients with oropharyngeal squamous cell carcinoma (OPSCC), taking into account other HER family members as well as p16 status.
METHODS
Ninety-six primary tumor specimens from OPSCC patients were retrospectively collected and analyzed for heregulin mRNA by in situ hybridization and for HER3, EGFR, and HER2 by quantitative immunohistochemistry. Heregulin and HER3 mRNA levels were also examined among different tumor types using The Cancer Genome Atlas (TCGA) database.
RESULTS
High heregulin mRNA (> median) correlated significantly with poor OS (HR: 8.48; 95% CI: 2.17–33.17; P = 0.002) but not DFS (HR: 1.52; 95% CI: 0.64–3.65; P = 0.344), in OPSCC patients. Heregulin mRNA correlated negatively with OS in both p16-positive (P = 0.049) and p16-negative (P = 0.091) OPSCC patients on univariate analysis. High HER3 (> median) also correlated with poor OS (HR: 4.68; 95%CI: 1.47–14.90; P = 0.009) on multivariate analysis. EGFR levels independently correlated with DFS (P = 0.025) and inversely correlate with p16 status (P = 0.012). In addition, TCGA data showed that head and neck squamous cell carcinoma exhibits higher heregulin expression compared to other solid tumor types examined. CONCLUSION: High heregulin mRNA and high HER3 protein levels independently correlate with poor OS in OPSCC. These data support targeting HER3 in heregulin-high OPSCC and warrant further clinical investigation.
Keywords: heregulin, EGFR, HER3, human papillomavirus, head and neck cancer
INTRODUCTION
Head and neck cancer (HNC) is the sixth most common malignancy worldwide, representing a major international health problem. In the United States, approximately 55,070 new cases of oral cavity, pharyngeal, and laryngeal cancers are estimated in 2014, accounting for 3.3% of overall new cancer cases.1 Over the last several decades, although the incidence and mortality of HNC has been decreasing, the incidence of human papillomavirus (HPV)-associated HNC has been on the rise.2 It is estimated that by the year 2020, HPV-positive oropharyngeal squamous cell carcinoma (OPSCC) will surpass cervical cancer as the most common HPV-associated cancer in the United States.3, 4 HPV-associated OPSCC represents a distinct clinical identity with improved outcomes relative to HPV-negative OPSCC.5–8 Prognostic markers and potential therapeutic targets in HNC, for both HPV-associated and non-associated disease, are currently the subject of intense investigation.
The HER family of receptors, which includes EGFR, HER2, HER3, and HER4, has drawn much clinical interest, owing primarily to the frequently observed overexpression, mutation, or gene amplification of EGFR and HER2 in human epithelial malignancies.9 HER family receptors have been targeted repeatedly for therapeutic intervention, both as primary drivers of tumor progression and as key mediators of drug resistance.10, 11 Their levels as well as mutation status have also been linked to patient outcome.12, 13 Within the scope of head and neck squamous cell carcinoma (HNSCC), the lack of reliable predictive markers remains a major challenge. For example, although overexpression of EGFR is prognostic of worse patient outcomes in HNSCC, it is not predictive of response to therapy, as concluded from an analysis of the EXTREME trial.14 It also remains unclear whether EGFR expression contributes to the prognosis of HPV-associated OPSCC15–19 and little is known regarding other HER family members in OPSCC.
Heregulin is a secreted growth factor that has been implicated in cell proliferation, differentiation, invasion, and survival in human cancers.20 Binding of heregulin to its receptors (HER3 and HER4) leads to the formation of diverse dimers, including HER2/HER3, HER2/HER4, HER3/HER4, and HER4/HER4.21, 22 It also promotes dimerization of HER3 and HER4 with EGFR. Although HER3 lacks kinase activity and HER2 has no known ligand, the HER2/HER3 heterodimer is the most mitogenic dimer and represents an important target in oncology.23, 24 HER2 potently activates proliferative signaling through the MAPK pathway, and HER3, which features six high-affinity docking sites for PI3K, potently activates survival signaling through the PI3K/Akt/mTOR pathway. Yonesaka et al. demonstrated that acquired resistance to cetuximab is mediated through increased HER2 signaling or enhanced levels of heregulin in adenocarcinoma of the colon.25 Similarly, Zhang et al. showed that HER2/HER3 signaling promotes resistance to EGFR-targeted therapy (e.g., cetuximab) in pre-clinical models of HNSCC and colorectal cancer (CRC).26 Their data further showed that HER3 phosphorylation is strictly dependent on association with HER2 but not EGFR, and that activation of HER2/HER3 signaling by heregulin (neuregulin 1) abolishes the effect of EGFR blockade on the growth of colorectal cancer. More recently, we found that the combination of seribantumab (MM-121), a fully human heregulin-blocking anti-HER3 antibody, with cetuximab synergistically inhibits HNC tumor cell growth, both in vitro and in xenograft models.27 In addition, it has been reported that heregulin expression is correlated with activated HER3 (p-HER3) in HNC and may serve as an “actionable biomarker”.28 Most recently, evidence from Phase 2 clinical trials suggests that adding an anti-HER3 antibody to other systemic anti-cancer agents leads to increased progression-free survival in various tumor types, including ovarian,29 breast,30 and non-small cell lung cancer.31–33 These data clearly support the role of heregulin and anti-HER3 targeting in HNSCC. There is currently, however, very little information regarding the prognostic value of heregulin in HNSCC.
In the present study, we assessed the prognostic value of heregulin mRNA and HER3 protein in OPSCC. Consistent with the emerging role of heregulin/HER3 as a general mediator of resistance to therapy, we found that both biomarkers are independently prognostic of poor overall survival in OPSCC, which deserves further clinical validation. Future studies are also warranted to explore the predictive value of heregulin/HER3 in HNC.
MATERIALS AND METHODS
Antibodies
Mouse anti-EGFR antibody was purchased from Life Technologies (Grand Island, NY). Rabbit anti-HER2 antibody was purchased from NeoMarkers (Fremont, CA) and mouse anti-HER3 antibody from DAKO (Carpinteria, CA). Alexa Fluor® 555 GAM IgG (H+L), Alexa Fluor® 555 GAR (H+L), and Prolong Gold Antifade Reagent w/DAPI were purchased from Life Technologies (Grand Island, NY). Cytokeratin (monoclonal mouse anti-human IgG1 kappa), pan-cytokeratin (rabbit anti-cow wide screening) antibodies, and anti-rabbit/mouse HRP-labeled polymer were purchased from DAKO (Carpinteria, CA).
OPSCC Specimen Collection
A total of 96 formalin-fixed paraffin-embedded (FFPE) tissue specimens were obtained from patients diagnosed with OPSCC at the Winship Cancer Institute of Emory University from 1994 to 2008. No other treatments were administered to patients before tissue biopsy or surgery. This study was approved by the Institutional Review Board at Emory University and clinical characteristics were decoded in compliance with the Health Insurance Portability and Accountability Act (HIPAA). Information on clinical characteristics was retrieved from the treating physicians. Patient characteristics are shown in Supplementary Table S1.
Tissue Microarray (TMA) Construction and Analysis
Protein levels of HER3, EGFR and HER2 were analyzed using a tissue microarray prepared from 96 archived FFPE tumor tissues, each cored in duplicate. H&E-stained sections for all tissue blocks were pre-reviewed by a pathologist to define representative tumor areas to be included in the TMA. Each replicate was selected from two different tumor locations of the same tissue block. Tissue blocks were re-embedded and cut at a depth of 4 μm for slide preparation. One of the sections was used for routine H&E staining, which an expert head and neck pathologist reviewed for tumor content, quality, and clinical diagnosis. Areas of tumor, stroma, and necrosis were differentiated. Subsequently, adjacent or nearby tissue sections (within 20 μm of the H&E section) were used for the biomarker assays described below.
Fluorescence-based Quantitative Immunohistochemistry (qIHC) Staining of HER3, EGFR and HER2
HER3, EGFR, and HER2 were stained by fluorescence-based qIHC, which provides a measure of the number of protein molecules per tumor cell in each patient sample. A tissue microarray comprising plugs of cell lines with known receptor levels is used to generate a standard curve from which these measurements are derived. An assay of this type for HER2 has previously been described.34 For this study, TMA blocks were sectioned, de-paraffinized, and hydrated according to standard procedures. For EGFR detection, slides underwent manual antigen retrieval: 300 μL of ready to use (RTU) Digest-All 3 Pepsin (Invitrogen) was applied to each slide, which was then allowed to incubate at 37°C for 10 min and washed 3 times with 1× TBST buffer, 3 min each. For HER2 and HER3 detection, automated antigen retrieval was performed by placing slides into a pre-heated (65°C) DAKO PT Module containing PT module buffer 4 (Tris-EDTA, pH 9 ± 0.05), boiled for 25 min, and allowed to cool at room temperature (RT). Slides were incubated with primary antibody cocktails of DaVinci Green (BD), mouse anti-EGFR (1:100), and pan-cytokeratin (1:200) for EGFR staining; with DaVinci Green (BD), anti-HER2 (1:300), and cytokeratin (1:50) for HER2 staining; or with DaVinci Green (BD), anti-HER3 (1:10), and pan-cytokeratin (1:200) for HER3 staining, each for 1 h at RT. After a washing step (1× TBST buffer, twice), slides were incubated with secondary antibody cocktails of Alexa Fluor® 555 GAR IgG (H+L) (1:200) and horseradish peroxidase (HRP)-polymer-labeled anti-mouse for EGFR staining; with Alexa Fluor® 555 GAM IgG (H+L) (1:200) and HRP-polymer-labeled anti-rabbit for HER2 staining; or with Alexa Fluor® 555 GAR IgG (H+L) (1:200) and HRP-polymer-labeled anti-mouse for HER3 staining, each for 30 min at RT. After another washing step (1× TBST buffer, twice), slides were incubated with cyanine 5 tyramide (1:50) for 10 min at RT. Slides were then washed with 1× TBST buffer twice, dried, and mounted with ProLong Gold Antifade reagent with DAPI and cured overnight in the dark. Slides were scanned the following day using an Aperio ScanScope FL at 20× magnification. Representative images of EGFR, HER2, and HER3 qIHF staining and the standard curves used for quantification are shown in Supplementary Figure S1.
Heregulin RNA In Situ Hybridization (ISH)
FFPE tumor samples were stained for heregulin-1 mRNA levels using the RNAScope assay from Advanced Cell Diagnostics. Following deparaffinization, slides were covered with Pretreat1 solution (ACD) to block endogenous enzymes and rinsed in dH2O. Slides were then incubated in boiling Pretreat2 solution for 15 min to unmask binding sites. After washing by immersion in dH2O (2 × 2 min), tissue was incubated with Pretreat3 solution at 40°C for 30 min to expose RNA transcripts to the target probes. After washing, the tissues were incubated with RNAScope probes for heregulin-1, which were provided as custom reagents from Advanced Cell Diagnostics. In total, 45 probe pairs were used that target a 2,535-base region of the heregulin-1 transcript and cover 17 separate isoforms. Serial tissue sections were incubated with positive control probes (peptidylprolyl isomerase B; PPIB), negative control probes (bacterial gene DapB), or heregulin-1 probes for 2 h at 40°C. Slides were washed (2 × 2 min) with 1 × RNAScope wash buffer before incubating with Amp1 reagent (40°C for 30 min) which favors binding only to pairs of adjacent probes bound to RNA transcripts. Slides were washed by immersion in RNAScope wash buffer before incubating with sequentially-applied signal amplifying reagents, each of which binds to the preceding reagent and amplifies the signal present at the previous step. Amplification steps were: Amp2 (15 min, 40°C), Amp3 (30 min, 40°C), Amp4 (15 min, 40°C), Amp5 (30 min, RT), and Amp6 (15 min, room temperature). The final reagent, Amp6, is conjugated to horseradish peroxidase (HRP). To visualize the transcripts, the slides were incubated with the ACD staining reagent, which contains diaminobenzidine (DAB), for 10 min at RT. Chromogen development was stopped by rinsing with dH2O. Nuclei were then counterstained with hematoxylin. After dehydration, stained slides were coverslipped with Cytoseal non-aqueous mounting medium (Thermo Scientific).
To score the assay, a TMA comprising plugs of four different cell lines was included in each staining run. The pathologist used reference images from independent TMAs (Supplementary Figure S2) to provide a score ranging from 0 (undetectable) to 4 (high). The pathologist provided two scores for the top two populations of tumor cells (each population must have ≥ 10% of overall tumor cells), and one score for the top population of stromal cells (when available).
Analysis of Heregulin and HER3 mRNA Levels among Different Tumor Types using TCGA Data
Pan-cancer analyses of HER3 and heregulin expression were performed using the cBioPortal application programming interface and R software.35 We included data from TCGA breast, high-grade serous ovarian cancer, lung adenocarcinoma, lung squamous cell carcinoma, cervix and HNSCC. We downloaded normalized RNA-Seq V2 and gene-specific RSEM-derived expression values36 from each cancer type and displayed the data as box plots.
Statistical Analysis
Protein expression levels were compared between p16-positive and -negative disease with analysis of variance (ANOVA) or Wilcoxon rank-sum test, where appropriate. Univariate association of each protein expression with patient characteristics was examined with ANOVA, Kruskal-Wallis test, Pearson correlation coefficient, or Spearman rank correlation coefficient, where appropriate. Pairwise correlation between two markers was examined using either Pearson correlation coefficient or Spearman rank correlation coefficient. Survival functions were estimated by the Kaplan-Meier method and a log-rank test was used to assess the difference in disease-free survival (DFS) or overall survival (OS) between different groups stratified by variables of interest. A Cox proportional hazards model was employed to examine the effect of each marker expression on DFS or OS. Multivariable survival analysis was carried out using a backward variable selection method with an alpha level of 0.1 for removal criteria. A more detailed description of the method is shown in the supplementary section. All of these analyses were performed using SAS 9.3 (SAS Institute, Inc., Cary, North Carolina) and significance levels were set at 0.05. For box-plot graph construction and correlation analysis, SigmaPlot 12.0 software (Systat Software, Inc., San Jose, California) was used.
RESULSTS
Study Population
Patient characteristics are shown in Supplementary Table S1. Correlations were examined between p16 status (as measured by IHC), which is a widely used substrate biomarker for HPV status in OPSCC,37 and expression of the HER family members. Among all patients with primary OPSCC, ~73% (70 out of 96) were p16-positive. The majority of patients were Caucasian (81.25%), whereas African Americans accounted for 11.5% of cases. Only one patient was Hispanic. Given the limited numbers of non-Caucasian cases, these were combined as non-Caucasians in the analysis. p16-positive patients were more frequently Caucasian non-smokers and were younger with more frequent node metastasis and an early tumor stage.
Expression of Heregulin, HER3 and other HER Family Members
Heregulin mRNA was detected in 74 out of 96 (77.1%) patient samples. Interestingly, heregulin expression was detected only in tumor cells and not in adjacent stromal tissue except for one sample which received a score of 1. The qIHC data showed that HER3, HER2 and EGFR were ubiquitously expressed in the OPSCC patient samples (Figure 1 A–D). Heregulin, HER3, and HER2 were not significantly correlated with p16 status (Figure 1A, 1C and 1D), whereas EGFR expression inversely correlated with p16 status (P = 0.012, Figure 1B). OPSCC tumors expressed low levels of HER3 (103–104 receptors/cell) and intermediate levels of EGFR and HER2 (104–105 receptors/cell). In addition, HER2 expression correlated weakly with HER3 expression (r = 0.197; P = 0.057, Figure 1E), whereas no significant correlations were found between the other HER family members or with heregulin (Supplementary Table S2).
Figure 1.

Expression profile of heregulin and HER family members in OPSCC patients. Heregulin (A), HER2 (C) and HER3 (D) expression was not significantly different between p16-positive and p16-negative patients, whereas EGFR expression (B) was higher in p16-negative patients. A marginally significant correlation was found between expression of HER2 and HER3 (E).
Association of Biomarkers with Patient Characteristics
Heregulin mRNA levels were higher in keratinizing versus non-keratinizing tumors (P = 0.038, Supplementary Table S3), whereas HER3 expression was marginally higher in non-keratinizing versus keratinizing tumors (P = 0.054, Supplementary Table S3). EGFR expression was significantly higher in tumors of current smokers compared to former or never smokers (P = 0.006, Supplementary Table S3), and significantly higher in patients with T3/T4 versus T1/T2 stage (P = 0.04) tumors.
Prognostic Value of Heregulin and HER Family Members in all OPSCC Patients
The median OS and DFS times of all patients were 5.10 and 3.98 years, respectively. Of all the biomarkers studied, the most significant correlation between biomarker levels and patient outcomes were observed for heregulin: high heregulin mRNA levels (> median) correlated with poor OS (HR(95%CI): 2.35(1.12–4.93), P = 0.020, Figure 2A). On the other hand, heregulin did not significantly correlate with DFS (HR(95%CI): 1.52(0.64–3.65), P = 0.344, Figure 2B). To test whether heregulin and HER3 were independent prognostic factors for patient outcomes, we performed multivariate analysis. The results showed that high heregulin was an independent prognostic factor for OS (HR(95%CI): 8.48(2.17–33.17), P = 0.002, Table 1), after adjusting for age, gender, race, p16 status, smoking, node metastasis, differentiation, stage, tumor stage, and the measured protein levels of HER3, HER2, and EGFR. Multivariate analysis after adjusting for the above-mentioned variables revealed that HER3 expression also correlated significantly with OS (HR(95%CI): 4.68 (1.47–14.90), P = 0.009, Table 1), although the correlation was not significant on univariate analysis (P = 0.56, Table 1). Neither HER2 nor EGFR levels correlated significantly with OS, either on univariate or multivariate analysis (Table 1). Only EGFR levels correlated with DFS on multivariate analysis (Supplementary Table S4).
Figure 2.
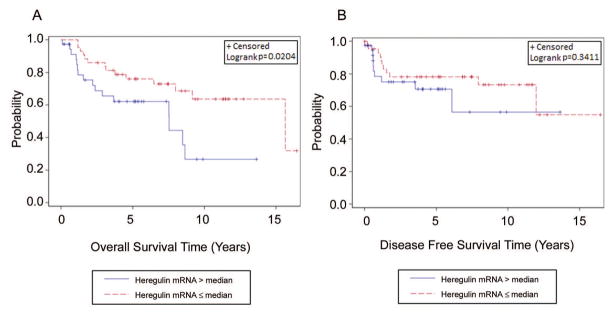
Kaplan-Meier estimates of overall survival (OS) and disease-free survival (DFS) in the overall OPSCC patients based on heregulin expression. High heregulin expression (> median) correlated significantly with poor OS (A) but not DFS (B).
Table 1.
OS analysis in the overall OPSCC patients.
| Covariate | Level | OS (Years)
|
||||
|---|---|---|---|---|---|---|
| N | Hazard Ratio (HR, 95% CI) | HR P-value | Log-rank P-value | |||
| Univariate | p16 status | Positive | 68 | 0.22 (0.11–0.43) | <.001 | <.001 |
| Negative | 26 | - | - | |||
| Age | 93 | 1.06 (1.02–1.09) | <.001 | - | ||
| Gender | Male | 77 | 0.95 (0.42–2.18) | 0.907 | 0.906 | |
| Female | 17 | - | - | |||
| Race | Caucasian | 76 | 0.34 (0.15–0.77) | 0.009 | 0.006 | |
| Non-Caucasian | 12 | - | - | |||
| Smoking | Smoker | 75 | 6.13 (1.46–25.77) | 0.013 | 0.005 | |
| Non-smoker | 18 | - | - | |||
| Differentiation | Keratinizing | 43 | 1.59 (0.83–3.05) | 0.159 | 0.155 | |
| Non-keratinizing | 51 | - | - | |||
| Tumor Stage | T1/T2 | 76 | 0.36 (0.16–0.80) | 0.012 | 0.009 | |
| T3/T4 | 12 | - | - | |||
| Stage | I/II | 20 | 1.07 (0.50–2.28) | 0.867 | 0.867 | |
| III/IV | 72 | - | - | |||
| Node Metastasis | Positive | 75 | 0.82 (0.38–1.75) | 0.603 | 0.602 | |
| Negative | 18 | - | - | |||
| EGFR | High (> median) | 47 | 1.44 (0.75–2.79) | 0.275 | 0.272 | |
| Low (≤ median) | 47 | - | - | |||
| HER2 | High (> median) | 46 | 1.39 (0.71–2.72) | 0.335 | 0.333 | |
| Low (≤ median) | 47 | - | - | |||
| HER3 | High (> median) | 46 | 1.22 (0.63–2.34) | 0.561 | 0.56 | |
| Low (≤ median) | 47 | - | - | |||
| Heregulin | High (> median) | 37 | 2.35 (1.12–4.93) | 0.024 | 0.02 | |
| Low (≤ median) | 43 | - | - | |||
|
|
||||||
| Multivariate * | Covariate | Level | Hazard Ratio (95%CI) | HR P-value | Type 3 P-value | |
|
|
||||||
| p16 status | Positive | 0.02 (0.00–0.11) | <.001 | <.001 | ||
| Negative | - | - | ||||
| Smoking | Smoker | 8.88 (1.16–68.15) | 0.036 | 0.036 | ||
| Non-smoker | - | - | ||||
| Tumor Stage | T1/T2 | 0.09 (0.02–0.37) | <.001 | <.001 | ||
| T3/T4 | - | - | ||||
| Node Metastasis | Positive | 21.44 (2.69–170.70) | 0.004 | 0.004 | ||
| Negative | - | - | ||||
| HER3 | High (> median) | 4.68 (1.47–14.90) | 0.009 | 0.009 | ||
| Low (≤ median) | - | - | ||||
| Heregulin | High (> median) | 8.48 (2.17–33.17) | 0.002 | 0.002 | ||
| Low (≤ median) | - | - | ||||
Backward selection with an alpha level of removal of 0.1 was used. The following variables were removed from the model: Age, Gender, Race, Differentiation, EGFR, and HER2.
Prognostic Value of Heregulin and HER Family Members in p16-positive Patients
In patients with p16-positive tumors, high heregulin mRNA (> median) correlated with poor OS (HR(95%CI): 3.30 (0.94–11.57), P = 0.049) on univariate analysis (Figure 3A, Table 2) but not for DFS (P = 0.309). In contrast, protein levels of HER3, HER2, and EGFR did not correlate with either OS or DFS on multivariate analysis (Supplementary Table S4).
Figure 3.
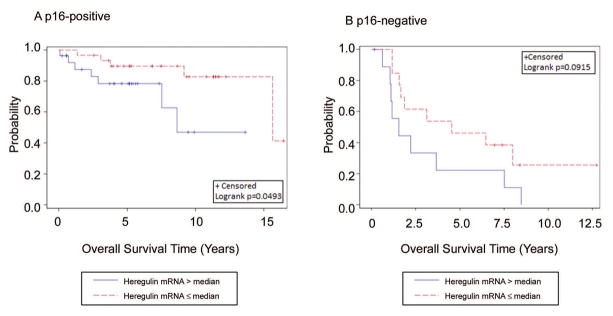
Kaplan-Meier estimates of OS in p16-positive and p16-negative OPSCC patients. High heregulin expression (> median) was marginally correlated with poor OS in p16-positive (A) and p16-negative (B) OPSCC patients.
Table 2.
Univariate OS analysis in p16-positive and negative OPSCC patients.
| Covariate | Level | Overall Survival Time (Years)
|
||||
|---|---|---|---|---|---|---|
| N | Hazard Ratio (HR, 95% CI) | HR P-value | Log-rank P-value | |||
| p16-positive | Age | 67 | 1.04 (0.99–1.10) | 0.088 | - | |
| Gender | Male | 59 | 2.42 (0.32–18.30) | 0.393 | 0.378 | |
| Female | 9 | - | - | |||
| Race | Caucasian | 60 | 0.65 (0.09–4.99) | 0.682 | 0.68 | |
| Non-Caucasian | 3 | - | - | |||
| Smoking | Smoker | 49 | 3.50 (0.78–15.65) | 0.101 | 0.082 | |
| Non-smoker | 18 | - | - | |||
| Differentiation | Keratinizing | 29 | 1.53 (0.59–3.97) | 0.385 | 0.382 | |
| Non-keratinizing | 39 | - | - | |||
| Tumor Stage | T1/T2 | 56 | 0.23 (0.07–0.76) | 0.016 | 0.009 | |
| T3/T4 | 7 | - | - | |||
| Stage | I/II | 11 | 0.66 (0.15–2.93) | 0.584 | 0.581 | |
| III/IV | 55 | - | - | |||
| Node Metastasis | Positive | 59 | 0.99 (0.22–4.42) | 0.989 | 0.989 | |
| Negative | 8 | - | - | |||
| EGFR | High (> median) | 34 | 1.86 (0.68–5.13) | 0.23 | 0.222 | |
| Low (≤ median) | 34 | - | - | |||
| HER2 | High (> median) | 34 | 1.10 (0.41–2.95) | 0.853 | 0.853 | |
| Low (≤ median) | 34 | - | - | |||
| HER3 | High (> median) | 33 | 0.82 (0.31–2.22) | 0.703 | 0.702 | |
| Low (≤ median) | 34 | - | - | |||
| Heregulin | High (> median) | 27 | 3.30 (0.94–11.57) | 0.062 | 0.049 | |
| Low (≤ median) | 30 | - | - | |||
|
|
||||||
| p16-negative | Age | 26 | 1.02 (0.97–1.07) | 0.399 | - | |
| Gender | Male | 18 | 1.47 (0.52–4.15) | 0.467 | 0.464 | |
| Female | 8 | - | - | |||
| Race | Caucasian | 16 | 0.56 (0.20–1.53) | 0.256 | 0.25 | |
| Non-Caucasian | 9 | - | - | |||
| Smoking | Former | 10 | 0.57 (0.22–1.44) | 0.232 | 0.226 | |
| Current | 16 | - | - | |||
| Differentiation | Keratinizing | 14 | 1.61 (0.66–3.92) | 0.296 | 0.292 | |
| Non-keratinizing | 12 | - | - | |||
| Tumor stage | T1/T2 | 20 | 0.59 (0.19–1.83) | 0.362 | 0.357 | |
| T3/T4 | 5 | - | - | |||
| Stage | I/II | 9 | 0.67 (0.26–1.70) | 0.401 | 0.398 | |
| III/IV | 17 | - | - | |||
| Node metastasis | Positive | 16 | 2.32 (0.86–6.22) | 0.095 | 0.087 | |
| Negative | 10 | - | - | |||
| EGFR | High (> median) | 13 | 2.03 (0.83–4.95) | 0.121 | 0.114 | |
| Low (≤ median) | 13 | - | - | |||
| HER2 | High (> median) | 12 | 3.38 (1.24–9.21) | 0.018 | 0.013 | |
| Low (≤ median) | 13 | - | - | |||
| HER3 | High (> median) | 13 | 1.83 (0.73–4.55) | 0.196 | 0.19 | |
| Low (≤ median) | 13 | - | - | |||
| Heregulin | High (> median) | 10 | 2.20 (0.86–5.63) | 0.099 | 0.091 | |
| Low (≤ median) | 13 | - | - | |||
Prognostic Values of HER Family Member Expression in p16-negative Patients
Heregulin expression also appears to be prognostic of poor OS in p16-negative patients (HR(95%CI): 2.20 (0.86–5.63), P = 0.099), although the significance is marginal (Figure 3B, Table 2). This, however, is likely due to the relatively small number of p16-negative patients in this study (N = 26). Interestingly, high HER2 levels appear to be prognostic of poor OS in this subgroup of patients (HR(95%CI): 3.38 (1.24–9.21), P = 0.018, Table 2). However, the same effect was not observed in the p16-positive patients. Multivariate analysis showed that heregulin, HER3, and HER2 levels correlate with OS, although with marginal significance. In contrast, EGFR expression does not correlate with OS (Supplementary Table S5).
With respect to DFS, only EGFR showed a weak correlation on univariate analysis (P = 0.0866), and on multivariate analysis only HER3 (HR(95%)CI: 3.65 (1.11–12.08), P = 0.034) and EGFR (HR(95%)CI: 4.28 (1.23–14.89), P = 0.022) correlated significantly with DFS (Supplementary Table S6). Because of the limited sample size (N = 26), multivariate analysis was not adjusted for clinical covariates.
Heregulin is Expressed at Higher Levels in HNC Relative to other Solid Tumor Types Examined
Based on the finding that heregulin mRNA levels were correlated with poor OS in HNSCC, we used The Cancer Genome Atlas (TCGA) database to determine how the levels of heregulin expression in HNSCC compared to those observed in other solid tumors. Strikingly, heregulin is expressed at significantly higher levels in HNSCC compared to breast (P < 0.001), ovarian (P < 0.001), and lung adenocarcinoma (P < 0.001), and even other squamous cell carcinomas, including lung (P < 0.001) and cervix (P < 0.001, Figure 4A). In contrast, HER3 expression was comparable between HNSCC and lung squamous cell carcinoma (P = 0.8182), and lower in HNSCC relative to cervical squamous cell carcinoma (P < 0.001), and breast (P < 0.001), ovarian (P < 0.001), and lung adenocarcinoma (P < 0.001, Figure 4B).
Figure 4.

Comparison of heregulin and HER3 mRNA expression among different tumor types using TCGA data. The normalized RNA-Seq V2, gene-specific RSEM-derived expression values from each cancer were downloaded and displayed as box plots. Heregulin mRNA expression was significantly higher in HNSCC compared to other tumor types. HER3 mRNA expression was lower in HNSCC than other tumor types except for lung squamous cell carcinoma. *, compared to HNSCC, P < 0.001. #, compared to HNSCC, P < 0.001.
DISCUSSION
Clinical investigations of the HER family receptors have uncovered critical therapeutic targets and several important drug resistance mechanisms.12, 13 Despite the fact that EGFR is frequently overexpressed in HNC, it has little or no predictive value for benefit from EGFR targeting; in addition, little is known about the prognostic value of other HER family members or their ligands in OPSCC. In HPV-associated OPSCC, it has been suggested that the intensity of therapy should be based on prognostic features of the disease, such as TNM stage.8 Prognostic information provided by molecular biomarkers may help to further refine therapeutic decisions and guide the development of new therapies that combat resistance mechanisms.
Strong evidence indicates that heregulin overexpression is involved in the activation of HER2/HER3 signaling and may mediate drug resistance in several tumor types, including HNSCC, colorectal, and prostate cancers.25, 26, 28, 38 These results raise the possibility that heregulin may also have prognostic value in HNSCC. In this retrospective study of OPSCC, we found that high heregulin mRNA levels are indeed prognostic of poor OS. It remains unclear, however, as to why heregulin did not correlate with DFS. This may be due to the limited sample size or the retrospective design of the study; future studies may be warranted to confirm or negate this observation. Using data from TCGA, we also found that heregulin mRNA levels are significantly higher in HNSCC compared to five other solid tumor types, including breast, ovarian, lung, and cervical cancer (Figure 4). Several clinical trials have now linked heregulin expression to rapid progression on standard therapy as well as an improved response to HER3-targeted therapies in various tumor types, including ovarian, breast, and non-small cell lung cancers.29–33 In preclinical models of HNSCC, we recently found that seribantumab (MM-121), a fully human antibody that blocks heregulin binding to HER3, and exhibits an anti-tumor activity either alone or in combination with cetuximab.27 Collectively, these finding strongly support the clinical investigation of HER3-directed therapy in HNSCC patients whose tumors exhibit high levels of heregulin mRNA.
In contrast to our findings for heregulin mRNA, multivariate analysis showed that EGFR expression correlated with DFS in all patients. In p16 positive patients who accounted for the majority of subjects, however, there was a lack of statistical significance. A possible explanation may be the strong association between EGFR and DFS in p16 negative patients [HR(95%CI): 4.28 (1.23–14.89)], which remained statistically significant even when the p16 positive patients were included. HER2, on the other hand, was not found to be prognostic of patient outcomes, consistent with previous findings in OPSCC.39 In our study, high HER3 expression independently correlated with poor OS, consistent with two previous studies reporting that HER3 gene copy number 40 and protein levels (IHC) 41 were significant prognostic factors of poor OS in recurrent or metastatic HNSCC. Our findings are also supported by a recent meta-analysis showing that high HER3 expression is prognostic in various solid tumors, including HNSCC.42 The observation that HER3 expression did not significantly correlated with OS in our univariate analysis may result from its partial dilution by other factors such as p16 status, smoking history, tumor stage, and node metastasis. In the final predictive model however, the effect of HER3 becomes significant after adjusting for these factors in the multivariate analysis.
The observation that heregulin mRNA was not found in adjacent stroma was intriguing; similar observations in HNSCC were also reported by Shames DS, et al.28 This contrasts with recent findings in ovarian and lung cancer (our unpublished data), where heregulin mRNA was frequently found in both the tumor and stromal compartments. That heregulin mRNA appears to be confined predominantly to tumor cells in our study may suggest that autocrine signaling through HER3, rather than paracrine signaling, plays a dominant role in HNSCC. A weak correlation was observed between HER2 and HER3 levels, supporting the potential formation of HER2/HER3 heterodimers in OPSCC. The high levels of heregulin expression in HNSCC relative to other tumor types further supports a role for the heregulin/HER2/HER3 trimeric complex in this disease, which has been linked to cell migration,43, 44 tumor cell survival, and drug resistance.45
Increasing evidence supports an inverse relationship between EGFR expression and p16 status in HNSCC.16, 46 The biological explanation for these clinical observations remains unclear, especially given that response to and benefit from cetuximab are not affected by HPV status in HNC patients.47 In our study, neither HER2 nor HER3 correlated with p16 status, which is consistent with a previous study in OPSCC.48 Our study did confirm, however, that p16-positive patients have improved OS and DFS.
In the present study we did not focus on clinical covariates in terms of prognostic relevance, although we observed that p16, tumor stage, smoking, and node metastasis were significantly correlated with OS in OPSCC patients (Table 1). p16 status was not correlated with DFS, possible due to an interaction with EGFR, which correlated significantly with DFS on multivariate analysis (Supplementary Table S4).
There are several limitations to our current study. First, the small number of p16-negative patients makes it difficult to conclude that p16 status does not affect the prognostic value of heregulin. Second, smoking status was retrospectively recorded based on patients’ accounts, so findings with respect to smoking status should be viewed with caution. Third, as the study population was limited to OPSCC, it is still unclear how other subtypes of HNSCC are affected by heregulin mRNA levels. Finally, due to a limited number of patients from different racial backgrounds, generalizations to non-Caucasian populations should also be viewed with some caution.
In summary, our findings highlight the importance of heregulin mRNA as a potential prognostic marker in HNSCC and support the clinical investigation of HER3 inhibition in heregulin mRNA-high patients. Our previously reported findings that HER3 inhibition potentiates the anti-tumor effects of cetuximab in preclinical models of HNSCC suggest that a combination therapy approach may be most appropriate. The lack of reliable predictive or prognostic molecular markers in HNSCC beyond HPV/p16 status render our findings particularly interesting, as they are also consistent with recent findings in other tumor types indicating that heregulin expression is predictive of poor response to standard therapy as well as benefit from HER3 inhibition. Our findings, together with recent data from clinical trials in other tumor types, support further clinical investigation and validation of HER3 inhibitors in HNSCC, focusing on patients with high levels of heregulin mRNA.
Supplementary Material
Figure S1. Quantification of ErbB receptors by fluorescence-based immunohistochemistry. (A) Representative images of the OPSCC tissue microarray. Three slides were each triple-stained for an ErbB receptor of interest (EGFR, HER2 or HER3) as well as cytokeratin and nuclear DNA (DAPI). (B) Standard curves for EGFR, HER2, and HER3, prepared using tissue microarrays of cell lines with known levels of each receptor (as measured by qFACS). The mean number of receptors per cell was determined for each patient sample and each receptor by referencing the observed mean fluorescent intensity for that sample to the appropriate standard curve.
Figure S2. Quantification of heregulin mRNA by RNA in situ hybridization (RNA-ISH). (A) Representative image of the OPSCC tissue microarray, showing staining for heregulin mRNA. (B) Staining of reference cell lines for heregulin mRNA. Patient samples were scored by comparing the number of dots per cell in each patient sample to the number of dots per cell in each of the reference cell lines: 1+, RT112; 2+, OVCAR3; 3+, TK10; 4+, NCI-H522.
Table S1. Patient characteristics.
Table S2. Pairwise correlation between markers.
Table S3. Univariate association of heregulin expression with covariates.
Table S4. Multivariable DFS analysis in all OPSCC patients.
Table S5. Multivariable OS analysis in p16-negative OPSCC patients.
Table S6. DFS analysis in p16-negative OPSCC patient.
Acknowledgments
FUNDING SUPPORT
The authors thank Dr. Anthea Hammond for her editing of the manuscript; Drs. Susan Müller and Dennis Sgroi for pathological evaluations; and Iga Sienczylo, Lia Luus, and Bjorn Millard for performing and analyzing IHC and ISH assays. This study was supported in part by Merrimack Pharmaceuticals, Inc. and by the Biostatistics and Bioinformatics Shared resource of Winship Cancer Institute of Emory University and NIH/NCI under award number P30CA138292.
Footnotes
The content is solely the responsibility of the authors and does not necessarily represent the official views of the National Institutes of Health.
CONFLICT OF INTEREST DISCLOSURES
This study was funded in part by Merrimack Pharmaceuticals. G. Garcia and G. MacBeath are employees and stockholders of Merrimack Pharmaceuticals.
References
- 1.Siegel R, Ma J, Zou Z, Jemal A. Cancer statistics, 2014. CA Cancer J Clin. 2014;64:9–29. doi: 10.3322/caac.21208. [DOI] [PubMed] [Google Scholar]
- 2.Saba NF, Goodman M, Ward K, et al. Gender and ethnic disparities in incidence and survival of squamous cell carcinoma of the oral tongue, base of tongue, and tonsils: a surveillance, epidemiology and end results program-based analysis. Oncology. 2011;81:12–20. doi: 10.1159/000330807. [DOI] [PMC free article] [PubMed] [Google Scholar]
- 3.Chaturvedi AK, Engels EA, Pfeiffer RM, et al. Human papillomavirus and rising oropharyngeal cancer incidence in the United States. J Clin Oncol. 2011;29:4294–4301. doi: 10.1200/JCO.2011.36.4596. [DOI] [PMC free article] [PubMed] [Google Scholar]
- 4.D’Souza G, Dempsey A. The role of HPV in head and neck cancer and review of the HPV vaccine. Prev Med. 2011;53 (Suppl 1):S5–S11. doi: 10.1016/j.ypmed.2011.08.001. [DOI] [PMC free article] [PubMed] [Google Scholar]
- 5.Gillison ML, Koch WM, Capone RB, et al. Evidence for a causal association between human papillomavirus and a subset of head and neck cancers. J Natl Cancer Inst. 2000;92:709–720. doi: 10.1093/jnci/92.9.709. [DOI] [PubMed] [Google Scholar]
- 6.Haddad RI, Shin DM. Recent advances in head and neck cancer. N Engl J Med. 2008;359:1143–1154. doi: 10.1056/NEJMra0707975. [DOI] [PubMed] [Google Scholar]
- 7.Ang KK, Harris J, Wheeler R, et al. Human papillomavirus and survival of patients with oropharyngeal cancer. N Engl J Med. 2010;363:24–35. doi: 10.1056/NEJMoa0912217. [DOI] [PMC free article] [PubMed] [Google Scholar]
- 8.O’Sullivan B, Huang SH, Siu LL, et al. Deintensification candidate subgroups in human papillomavirus-related oropharyngeal cancer according to minimal risk of distant metastasis. J Clin Oncol. 2013;31:543–550. doi: 10.1200/JCO.2012.44.0164. [DOI] [PubMed] [Google Scholar]
- 9.Yarden Y. The EGFR family and its ligands in human cancer. signalling mechanisms and therapeutic opportunities. Eur J Cancer. 2001;37 (Suppl 4):S3–8. doi: 10.1016/s0959-8049(01)00230-1. [DOI] [PubMed] [Google Scholar]
- 10.Dhomen NS, Mariadason J, Tebbutt N, Scott AM. Therapeutic targeting of the epidermal growth factor receptor in human cancer. Crit Rev Oncog. 2012;17:31–50. doi: 10.1615/critrevoncog.v17.i1.40. [DOI] [PubMed] [Google Scholar]
- 11.Vlacich G, Coffey RJ. Resistance to EGFR-targeted therapy: a family affair. Cancer Cell. 2011;20:423–425. doi: 10.1016/j.ccr.2011.10.006. [DOI] [PMC free article] [PubMed] [Google Scholar]
- 12.Mendelsohn J. Targeting the epidermal growth factor receptor for cancer therapy. J Clin Oncol. 2002;20:1S–13S. [PubMed] [Google Scholar]
- 13.Hansen AR, Siu LL. Epidermal growth factor receptor targeting in head and neck cancer: have we been just skimming the surface? J Clin Oncol. 2013;31:1381–1383. doi: 10.1200/JCO.2012.47.9220. [DOI] [PubMed] [Google Scholar]
- 14.Licitra L, Storkel S, Kerr KM, et al. Predictive value of epidermal growth factor receptor expression for first-line chemotherapy plus cetuximab in patients with head and neck and colorectal cancer: analysis of data from the EXTREME and CRYSTAL studies. Eur J Cancer. 2013;49:1161–1168. doi: 10.1016/j.ejca.2012.11.018. [DOI] [PubMed] [Google Scholar]
- 15.Kong CS, Narasimhan B, Cao H, et al. The relationship between human papillomavirus status and other molecular prognostic markers in head and neck squamous cell carcinomas. Int J Radiat Oncol Biol Phys. 2009;74:553–561. doi: 10.1016/j.ijrobp.2009.02.015. [DOI] [PMC free article] [PubMed] [Google Scholar]
- 16.Kumar B, Cordell KG, Lee JS, et al. EGFR, p16, HPV Titer, Bcl-xL and p53, sex, and smoking as indicators of response to therapy and survival in oropharyngeal cancer. J Clin Oncol. 2008;26:3128–3137. doi: 10.1200/JCO.2007.12.7662. [DOI] [PMC free article] [PubMed] [Google Scholar]
- 17.Hong A, Dobbins T, Lee CS, et al. Relationships between epidermal growth factor receptor expression and human papillomavirus status as markers of prognosis in oropharyngeal cancer. Eur J Cancer. 2010;46:2088–2096. doi: 10.1016/j.ejca.2010.04.016. [DOI] [PubMed] [Google Scholar]
- 18.Romanitan M, Nasman A, Munck-Wikland E, Dalianis T, Ramqvist T. EGFR and phosphorylated EGFR in relation to HPV and clinical outcome in tonsillar cancer. Anticancer Res. 2013;33:1575–1583. [PubMed] [Google Scholar]
- 19.Spangle JM, Munger K. The HPV16 E6 oncoprotein causes prolonged receptor protein tyrosine kinase signaling and enhances internalization of phosphorylated receptor species. PLoS Pathog. 2013;9:e1003237. doi: 10.1371/journal.ppat.1003237. [DOI] [PMC free article] [PubMed] [Google Scholar]
- 20.Breuleux M. Role of heregulin in human cancer. Cell Mol Life Sci. 2007;64:2358–2377. doi: 10.1007/s00018-007-7120-0. [DOI] [PMC free article] [PubMed] [Google Scholar]
- 21.Jones JT, Akita RW, Sliwkowski MX. Binding specificities and affinities of egf domains for ErbB receptors. FEBS Lett. 1999;447:227–231. doi: 10.1016/s0014-5793(99)00283-5. [DOI] [PubMed] [Google Scholar]
- 22.Pinkas-Kramarski R, Shelly M, Guarino BC, et al. ErbB tyrosine kinases and the two neuregulin families constitute a ligand-receptor network. Mol Cell Biol. 1998;18:6090–6101. doi: 10.1128/mcb.18.10.6090. [DOI] [PMC free article] [PubMed] [Google Scholar]
- 23.Yarden Y, Sliwkowski MX. Untangling the ErbB signalling network. Nat Rev Mol Cell Biol. 2001;2:127–137. doi: 10.1038/35052073. [DOI] [PubMed] [Google Scholar]
- 24.Citri A, Skaria KB, Yarden Y. The deaf and the dumb: the biology of ErbB-2 and ErbB-3. Exp Cell Res. 2003;284:54–65. doi: 10.1016/s0014-4827(02)00101-5. [DOI] [PubMed] [Google Scholar]
- 25.Yonesaka K, Zejnullahu K, Okamoto I, et al. Activation of ERBB2 signaling causes resistance to the EGFR-directed therapeutic antibody cetuximab. Sci Transl Med. 2011;3:99ra86. doi: 10.1126/scitranslmed.3002442. [DOI] [PMC free article] [PubMed] [Google Scholar]
- 26.Zhang L, Castanaro C, Luan B, et al. ERBB3/HER2 signaling promotes resistance to EGFR blockade in head and neck and colorectal cancer models. Mol Cancer Ther. 2014;13:1345–1355. doi: 10.1158/1535-7163.MCT-13-1033. [DOI] [PubMed] [Google Scholar]
- 27.Jiang N, Wang D, Hu Z, et al. Combination of Anti-HER3 Antibody MM-121/SAR256212 and Cetuximab Inhibits Tumor Growth in Preclinical Models of Head and Neck Squamous Cell Carcinoma (HNSCC) Mol Cancer Ther. 2014 doi: 10.1158/1535-7163.MCT-13-1093. [DOI] [PMC free article] [PubMed] [Google Scholar]
- 28.Shames DS, Carbon J, Walter K, et al. High heregulin expression is associated with activated HER3 and may define an actionable biomarker in patients with squamous cell carcinomas of the head and neck. PLoS One. 2013;8:e56765. doi: 10.1371/journal.pone.0056765. [DOI] [PMC free article] [PubMed] [Google Scholar]
- 29.Liu J, Ray-coquard IL, Selle F, Poveda A, Cibula D, Hirte HW, Raspagliesi F, Gladieff L, Harter P, Siena S, Tabah-Fisch I, Riahi K, Kubasek W, MacBeath G, Czibere A, Naumann W, Coleman R, Vergote I, Pujade-Lauraine E. A phase II randomized open-label study of MM-121, a fully human monoclonal antibody targeting ERBB3, in combination with weekly paclitaxel versus weekly paclitaxel in patients with platinum-resistant/refractory ovarian cancers. J Clin Oncol. 2014;32(supplement):abstract 5519. [Google Scholar]
- 30.Higgins MJ, Doyle C, Paepke S, Azaro A, Martin M, Semiglazov V, Smirnova I, Krasnozhon D, Manikhas A, Harb W, Panasci L, Horgan K, Pearlberg J, MacBeath G, Nering R, Goss P, Miller K. A randomized, double-blind phase II trial of exemestane plus MM-121 (a monoclonal antibody targeting ERBB3) or placebo in postmenopausal women with locally advanced or metastatic ER+/PR+, HER2-negative breast cancer. J Clin Oncol. 2014;32(supplement):abstract 587. [Google Scholar]
- 31.Sequist LV, Lopez-Chavez A, Doebele RC, Gray JE, Harb W, Modiano MR, Jackman D, Baggstrom M, Atmaca A, Felip E, Provencio M, Cobo M, Mirshahidi H, Kripas C, Andreas K, MacBeath G, Czibere A, Chu Q, Schneider C, Cho BC, Park K, Shepherd F. A Randomized Phase 2 Trial of MM-121, a Fully Human Monoclonal Antibody Targeting ErbB3, in Combination with Erlotinib, in EGFR Wild-type NSCLC Patients. J Clin Oncol. 2014;32(supplement):abstract 8051. [Google Scholar]
- 32.Von Pawel J, Tseng J, Dediu M, Schumann C, Moritz B, Mendell-Harary J, Jin X, Feng W, Copigneaux C, Beckman RA. Phase 2 HERALD study of patritumab (P) with erlotinib (E) in advanced NSCLC subjects (SBJs) J Clin Oncol. 2014;32(supplement):abstr 8045. [Google Scholar]
- 33.MacBeath G, Adiwijaya B, Liu J, Pujade-Lauraine E, Higgins M, Tabah-Fisch I, Pearlberg J, Moyo V, Kubasek W, Nering R, Czibere A. A Meta-Analysis of Biomarkers in Three Randomized, Phase 2 Studies of MM-121, a Ligand-Blocking Anti-ErbB3 Antibody, in Patients With Ovarian, Lung, and Breast Cancers. Ann Oncol. 2014;25:iv58–iv84. [Google Scholar]
- 34.Onsum MD, Geretti E, Paragas V, et al. Single-cell quantitative HER2 measurement identifies heterogeneity and distinct subgroups within traditionally defined HER2-positive patients. Am J Pathol. 2013;183:1446–1460. doi: 10.1016/j.ajpath.2013.07.015. [DOI] [PubMed] [Google Scholar]
- 35.Cerami E, Gao J, Dogrusoz U, et al. The cBio cancer genomics portal: an open platform for exploring multidimensional cancer genomics data. Cancer Discov. 2012;2:401–404. doi: 10.1158/2159-8290.CD-12-0095. [DOI] [PMC free article] [PubMed] [Google Scholar]
- 36.https://wiki.nci.nih.gov/display/TCGA/RNASeq+Version+2.
- 37.Lewis JS., Jr p16 Immunohistochemistry as a standalone test for risk stratification in oropharyngeal squamous cell carcinoma. Head Neck Pathol. 2012;6 (Suppl 1):S75–82. doi: 10.1007/s12105-012-0369-0. [DOI] [PMC free article] [PubMed] [Google Scholar]
- 38.Gregory CW, Whang YE, McCall W, et al. Heregulin-induced activation of HER2 and HER3 increases androgen receptor transactivation and CWR-R1 human recurrent prostate cancer cell growth. Clin Cancer Res. 2005;11:1704–1712. doi: 10.1158/1078-0432.CCR-04-1158. [DOI] [PubMed] [Google Scholar]
- 39.Khan AJ, King BL, Smith BD, et al. Characterization of the HER-2/neu oncogene by immunohistochemical and fluorescence in situ hybridization analysis in oral and oropharyngeal squamous cell carcinoma. Clin Cancer Res. 2002;8:540–548. [PubMed] [Google Scholar]
- 40.Fountzilas G, Angouridakis N, Wirtz RM, Claas S, Nikolaou A, Kalogeras KT. Prognostic value of VEGFC, HER2 and HER3 gene expression in recurrent squamous cell head and neck tumors. J Clin Oncol (Meeting Abstracts) 2006;24:5538. [Google Scholar]
- 41.Takikita M, Xie R, Chung JY, et al. Membranous expression of Her3 is associated with a decreased survival in head and neck squamous cell carcinoma. J Transl Med. 2011;9:126. doi: 10.1186/1479-5876-9-126. [DOI] [PMC free article] [PubMed] [Google Scholar]
- 42.Ocana A, Vera-Badillo F, Seruga B, Templeton A, Pandiella A, Amir E. HER3 overexpression and survival in solid tumors: a meta-analysis. J Natl Cancer Inst. 2013;105:266–273. doi: 10.1093/jnci/djs501. [DOI] [PubMed] [Google Scholar]
- 43.Lee CY, Lin Y, Bratman SV, et al. Neuregulin autocrine signaling promotes self-renewal of breast tumor-initiating cells by triggering HER2/HER3 activation. Cancer Res. 2014;74:341–352. doi: 10.1158/0008-5472.CAN-13-1055. [DOI] [PMC free article] [PubMed] [Google Scholar]
- 44.Sollome JJ, Thavathiru E, Camenisch TD, Vaillancourt RR. HER2/HER3 regulates extracellular acidification and cell migration through MTK1 (MEKK4) Cell Signal. 2014;26:70–82. doi: 10.1016/j.cellsig.2013.08.043. [DOI] [PMC free article] [PubMed] [Google Scholar]
- 45.Xia W, Petricoin EF, 3rd, Zhao S, et al. An heregulin-EGFR-HER3 autocrine signaling axis can mediate acquired lapatinib resistance in HER2+ breast cancer models. Breast Cancer Res. 2013;15:R85. doi: 10.1186/bcr3480. [DOI] [PMC free article] [PubMed] [Google Scholar]
- 46.Husain H, Psyrri A, Markovic A, et al. Nuclear epidermal growth factor receptor and p16 expression in head and neck squamous cell carcinoma. Laryngoscope. 2012;122:2762–2768. doi: 10.1002/lary.23647. [DOI] [PMC free article] [PubMed] [Google Scholar]
- 47.Pogorzelski M, Ting S, Gauler TC, et al. Impact of human papilloma virus infection on the response of head and neck cancers to anti-epidermal growth factor receptor antibody therapy. Cell Death Dis. 2014;5:e1091. doi: 10.1038/cddis.2014.62. [DOI] [PMC free article] [PubMed] [Google Scholar]
- 48.Sudaka A, Saada E, Natale R, Poissonnet G, Benezery K, Bozec A, Hebert C, Dassonville O, Peyrade F. Differential expression of EGFR, HER2, P16, and high-risk (hr) HPV status in oropharyngeal (Or) and oral cavity (OC) squamous cell carcinoma (SCC) J Clin Oncol. 2012;30(supplement):abstr 5521. [Google Scholar]
Associated Data
This section collects any data citations, data availability statements, or supplementary materials included in this article.
Supplementary Materials
Figure S1. Quantification of ErbB receptors by fluorescence-based immunohistochemistry. (A) Representative images of the OPSCC tissue microarray. Three slides were each triple-stained for an ErbB receptor of interest (EGFR, HER2 or HER3) as well as cytokeratin and nuclear DNA (DAPI). (B) Standard curves for EGFR, HER2, and HER3, prepared using tissue microarrays of cell lines with known levels of each receptor (as measured by qFACS). The mean number of receptors per cell was determined for each patient sample and each receptor by referencing the observed mean fluorescent intensity for that sample to the appropriate standard curve.
Figure S2. Quantification of heregulin mRNA by RNA in situ hybridization (RNA-ISH). (A) Representative image of the OPSCC tissue microarray, showing staining for heregulin mRNA. (B) Staining of reference cell lines for heregulin mRNA. Patient samples were scored by comparing the number of dots per cell in each patient sample to the number of dots per cell in each of the reference cell lines: 1+, RT112; 2+, OVCAR3; 3+, TK10; 4+, NCI-H522.
Table S1. Patient characteristics.
Table S2. Pairwise correlation between markers.
Table S3. Univariate association of heregulin expression with covariates.
Table S4. Multivariable DFS analysis in all OPSCC patients.
Table S5. Multivariable OS analysis in p16-negative OPSCC patients.
Table S6. DFS analysis in p16-negative OPSCC patient.